Abstract
SummaryLignin is an abundant phenylpropanoid polymer produced by the oxidative polymerization of p‐hydroxycinnamyl alcohols (monolignols). Lignification, i.e., deposition of lignin, is a defining feature of secondary cell wall formation in vascular plants, and provides an important mechanism for their disease resistance; however, many aspects of the cell wall lignification process remain unclear partly because of a lack of suitable imaging methods to monitor the process in vivo. In this study, a set of monolignol analogs γ‐linked to fluorogenic aminocoumarin and nitrobenzofuran dyes were synthesized and tested as imaging probes to visualize the cell wall lignification process in Arabidopsis thaliana and Pinus radiata under various feeding regimens. In particular, we demonstrate that the fluorescence‐tagged monolignol analogs can penetrate into live plant tissues and cells, and appear to be metabolically incorporated into lignifying cell walls in a highly specific manner. The localization of the fluorogenic lignins synthesized during the feeding period can be readily visualized by fluorescence microscopy and is distinguishable from the other wall components such as polysaccharides as well as the pre‐existing lignin that was deposited earlier in development.
🔬 Techniques
🔭 Microscopes
🧬 Organisms
✨ Fluorophores
🧪 Sample Preparation
🏭 Microscope Brands
🧪 Reagent Suppliers
🎨 Filters
🏛️ Research Organizations (ROR)
Affiliated research institutions:
📋 Methods
Synthesis
Detailed synthetic protocols and characterization data for fluorescence-tagged monolignols and synthetic lignins are described in the Supporting Information (Appendix S1 and Data S1 ). UV-vis absorption spectra were recorded on a Shimadzu BioSpec-nano spectrophotometer equipped with a quartz cell adapter. Fluorescence spectroscopy was conducted with a PTI QuantaMaster Model C-60/2000 spectrofluorometer (Photon Technology International) at 25 ± 0.1°C and data acquisition used FelixGX software (Photon Technology International) .
Fluorescent quantum yields
(Φ f ) were determined according to the method described in the literature (Fery-Forgues and Lavabre, 1999 ), using anthracene (Sigma-Aldrich, http://www.sigmaaldrich.com/ ; λ em = 350 nm, Φ f = 0.27 in EtOH, η = 1.36) or fluoresceine (Sigma-Aldrich; λ em = 450 nm, Φ f = 0.92 in 0.1 N NaOH aq., η = 1.33) as standards.
Arabidopsis thaliana stems fed via a transpiration system
Primary inflorescence stems of Arabidopsis thaliana (Col-0) ecotype and fah1-2 mutants were harvested from 6-week-old plants while submerged in water and kept in water until ready for incubation with feeding solutions. Monolignol 1S or probe 2G was dissolved in dimethyl sulfoxide and diluted to a final concentration of 200 μ m 1S or 2G in water. Each stem was incubated in water containing 200 μ m of 1S or 2G under continuous light. Mäule staining was performed as previously described (Chapple et al ., 1992 ) with minor modifications. Hand-sectioned stem sections were fixed in 4% (v/v) glutaraldehyde for 1 h. After rinsed with water three times, sections were incubated in 0.5% (w/v) potassium permanganate solution for 10 min. Sections were rinsed with water multiple times until the solution was cleared, and then were incubated in 10% (w/v) HCl for 5 min and rinsed with water twice. Sections were then mounted in concentrated ammonium hydroxide and examined by bright field microscopy. DMAC fluorescence was detected using a Nikon E800 epifluorescence microscope using filters with an excitation wavelength of 360 ± 20 nm and emission wavelength of 420 nm.
Show full methods section
Synthesis
Detailed synthetic protocols and characterization data for fluorescence-tagged monolignols and synthetic lignins are described in the Supporting Information (Appendix S1 and Data S1 ). UV-vis absorption spectra were recorded on a Shimadzu BioSpec-nano spectrophotometer equipped with a quartz cell adapter. Fluorescence spectroscopy was conducted with a PTI QuantaMaster Model C-60/2000 spectrofluorometer (Photon Technology International) at 25 ± 0.1°C and data acquisition used FelixGX software (Photon Technology International) .
Fluorescent quantum yields
(Φ f ) were determined according to the method described in the literature (Fery-Forgues and Lavabre, 1999 ), using anthracene (Sigma-Aldrich, http://www.sigmaaldrich.com/ ; λ em = 350 nm, Φ f = 0.27 in EtOH, η = 1.36) or fluoresceine (Sigma-Aldrich; λ em = 450 nm, Φ f = 0.92 in 0.1 N NaOH aq., η = 1.33) as standards.
Arabidopsis thaliana stems fed via a transpiration system
Primary inflorescence stems of Arabidopsis thaliana (Col-0) ecotype and fah1-2 mutants were harvested from 6-week-old plants while submerged in water and kept in water until ready for incubation with feeding solutions. Monolignol 1S or probe 2G was dissolved in dimethyl sulfoxide and diluted to a final concentration of 200 μ m 1S or 2G in water. Each stem was incubated in water containing 200 μ m of 1S or 2G under continuous light. Mäule staining was performed as previously described (Chapple et al ., 1992 ) with minor modifications. Hand-sectioned stem sections were fixed in 4% (v/v) glutaraldehyde for 1 h. After rinsed with water three times, sections were incubated in 0.5% (w/v) potassium permanganate solution for 10 min. Sections were rinsed with water multiple times until the solution was cleared, and then were incubated in 10% (w/v) HCl for 5 min and rinsed with water twice. Sections were then mounted in concentrated ammonium hydroxide and examined by bright field microscopy. DMAC fluorescence was detected using a Nikon E800 epifluorescence microscope using filters with an excitation wavelength of 360 ± 20 nm and emission wavelength of 420 nm.
Arabidopsis thaliana stems fed via a micro-pump system
Stems from 6-week-old Arabidopsis thaliana ecotype Col-0 plants were used to study de novo lignification of the green probe 3G in planta . Stem fragments of approximately 8–9 inches were collected at mid-day from the base of freshly cut Col-0 inflorescences. Immediately after harvesting, the stem base was attached to the sleeve of a 3 ml syringe and fed with 2.5 ml of feeding solution, containing probe 3G (1 μ m ) or dye 5b (1 μ m ) along with unlabeled monolignols 1G and 1S mixture (49.5 μ m each), using a KDS230 micro-pump (KD Scientific) at a continuous rate of 2 μl min −1 at room temperature. In the case of CR feeding, the stem was fed with 2.5 ml of 0.5% CR (Sigma-Aldrich) solution. In order to extend the lignification period, fed-stems rested at room temperature for an additional 16 h after the end of the feeding prior to any measurement. Then the stem was embedded in 7% agarose, sectioned to 100 μm using a Leica VT1000S vibratome, washed with 96% ethanol for 3–5 min, and then placed in water. The imaging used a Carl Zeiss 710 LSM CLSM with excitation/emission at 488/492–534 nm (NBD) and 514/519–650 nm (CR). Pinus radiata stems Stems of 6-month-old Pinus radiata stems were harvested in early autumn, a period when secondary cell wall formation in developing xylem is dominated by lignification. Stem sections with secondary growth (60 μm) were sectioned immediately after harvest using a sledge microtome and placed into water. Enzymatic activity in control sections was quenched by incubating sections for 1 h at 85°C in water. Untreated sections and controls were subsequently transferred to aqueous solutions containing 1 μ m monolignol probe 2G or 3G in combination with 100 μ m non-labeled monolignol 1G for 1 h. After staining, sections were washed with 50 ml 96% ethanol and 50 ml water under gentle agitation for 1 h each to remove non-incorporated precursors. Peroxidase activity in stem sections was monitored as described (Ros-Barcelo et al ., 2006 ). Both the staining of sections in the presence of 0.1 m m ferulic acid and heat treatment of sections (see above) completely abolished peroxidase-dependent staining (Figure S1 ). Sections were imaged using a Leica SP5 II CLSM. For DMAC probe 2G , sequential imaging was used with excitation at 355 nm and 496 nm, and emission was acquired sequentially from 400–485 nm (DMAC) and 510–600 nm (autofluorescence). Some images were also made with only UV excitation and emission from 400–500 nm. A control section showed some weak lignin autofluorescence in the 400–485/500 nm range at the gain used for imaging the treated sections. For NBD probe 3G , excitation and emission settings were 488 and 500–650 nm. Autofluorescence in control sections was negligible in this emission range at the same gain. Sections treated with TMB to detect peroxidase were mounted in 50% glycerol and imaged using a Leica MZ12.5 stereomicroscope using transmitted light. Arabidopsis thaliana seedlings Seeds of Arabidopsis ecotype Col-0 were surface-sterilized and transferred to 12-well plates (6 seeds per well) with 2 ml liquid ½MS medium in each well. The plates were left overnight at 4°C for stratification after which they were transferred to a shaker in a temperature-controlled chamber (21°C, 130 rpm, 16 h light/8 h dark light cycle). After 3 days, probe 3G was added (to a total concentration of 100 μ m ) and then the seedlings were further grown for 1 day after which the live seedlings were imaged. For co-staining with PI, seedlings were treated with 10 μ m probe 3G for 2 days under the conditions described above, washed, and then treated with 10 μ m PI for 10 min after which the seedlings were imaged. For CLSM, a Carl Zeiss LSM5 EXCITER with 488 (NBD) and 543 (PI) nm excitation, and 505–530 (NBD) and >560 (PI) nm emission.
Arabidopsis thaliana protoplast cells
Protoplasts were isolated from fully expanded rosette leaves of Arabidopsis ecotype Col-0 (60 days old) according to literature (Wu et al ., 2008 ) with minor modifications. The buffers used for protoplast isolation procedure, i.e., protoplast enzyme solution and wash buffer, were prepared according to literature (Robert et al ., 2007 ). Peeled leaves were placed in a Petri dish with protoplast enzyme solution for 90 min in the dark, on an Excella shaker (Eppendorf) at 70 rpm. The remainder of the leaf tissue with tape was removed and a Cellector Tissue Sieve (EC Apparatus, USA) was used to clean the protoplasts from the remaining undigested tissue. Protoplasts were spun down for 20 min (20°C, 80 g ) and the protoplast enzyme solution was replaced with the wash buffer. The washing step was repeated. Probe 3G was dissolved in wash buffer and as such added to the protoplast suspension; the final concentration of the probe was 50 μ m . The protoplast suspension was gently shaken for 4 h. In order to stain the plasma membrane of protoplasts, a 5-min treatment with 4 μ m FM4-64 (Invitrogen) was performed. All treatments were carried out in the wash buffer at room temperature in the dark and at least in triplicate, with a minimum of 20 protoplasts checked for each treatment. For CLSM, a Carl Zeiss 710 LSM with excitation/emission at 488/505–530 nm (NBD) and 543/560 nm (FM4-64) was used.
Supporting Information Additional Supporting Information may be found in the online version of this article. Figure S1. Transverse sections (60 μm) of a Pinus radiata stem stained with tetramethylbenzidine (TMB), exhibiting the sites where phenol oxidase activities were detected before (left) and after (right) heat treatment (85°C for 1 h). Figure S2. A close comparison of labeled and unlabeled sections of Pinus radiata stem at identical exposure showing the contribution of autofluorescence. Figure S3. Arabidopsis thaliana protoplast cells treated with (left) and without (right) NBD-tagged monolignol (3G, 50 μ m for 4 h). Data S1. NMR spectra of synthetic compounds. Appendix S1. Synthetic procedures.
📊 Figures
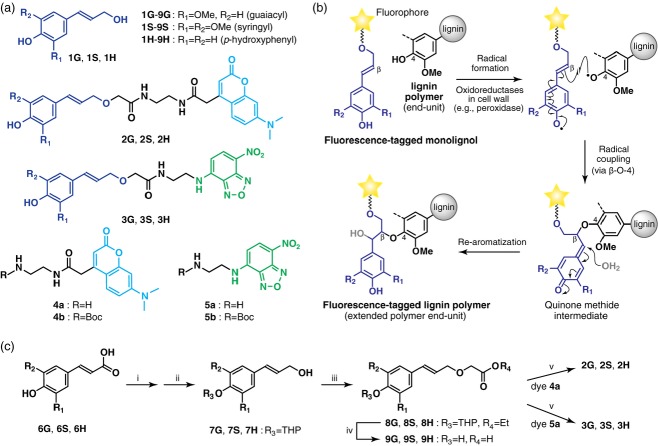
Figure 1
Monolignols and fluorescence-tagged monolignol analogs. (a) Chemical structures of monolignols, fluorescence-tagged monolignols, and DMAC and NBD fluorophores used in this study. (b) Incorporation of ...
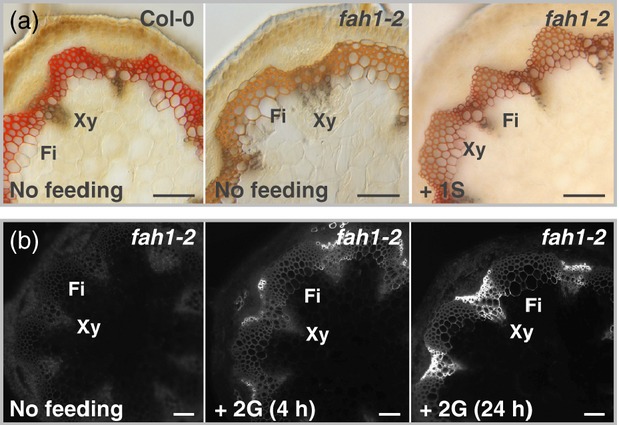
Figure 2
Incorporation of sinapyl alcohol 1S and DMAC-tagged monolignol probe 2G into Arabidopsis thaliana stems via the transpiration stream. (a) Arabidopsis stem sections stained with Mu00e4ule reagent. Wild...
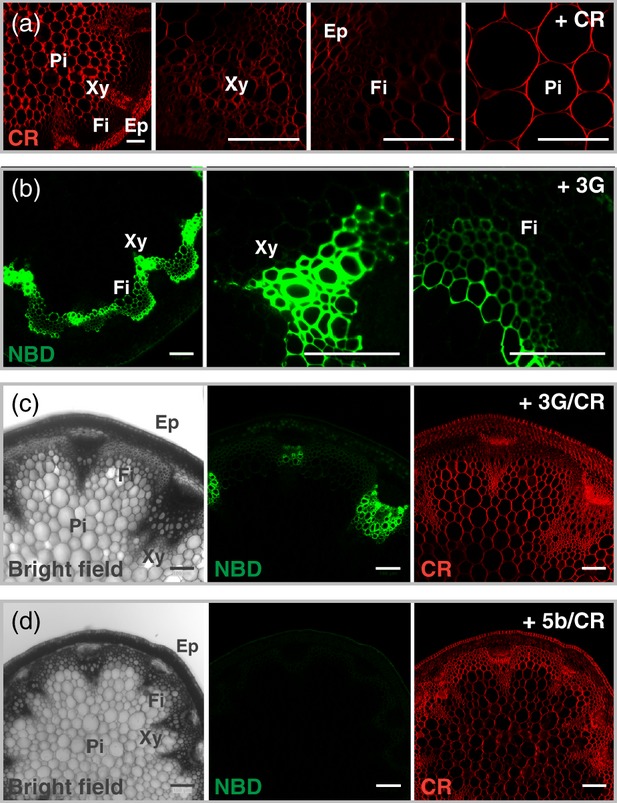
Figure 3
Incorporation of polysaccharide stain Congo red (CR) and NBD-tagged monolignol probe 3G into Arabidopsis thaliana stems via a peristaltic micro-pump. (a) Sections of the Arabidopsis stem (wild-type, C...
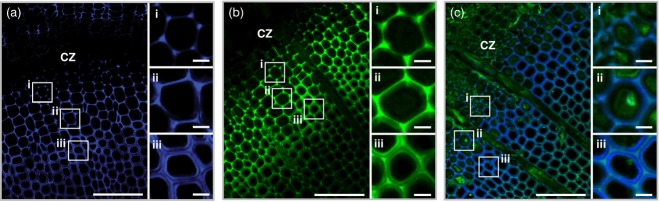
Figure 4
Transverse sections of Pinus radiata stem labeled with DMAC and NBD-tagged monolignol probes 2G and 3G showing developing xylem tissues around the cambial zone (CZ). (a) Labeled with 1 u03bc m 2G alon...
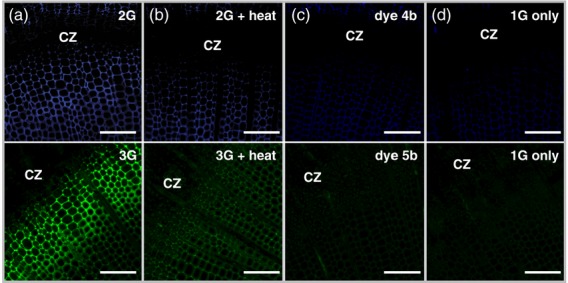
Figure 5
Pinus radiata stem labeled with DMAC and NBD-tagged monolignol probes, and control unlabeled stems visualized by identical imaging conditions. (a) Labeled sections obtained by treatment with DMAC or N...
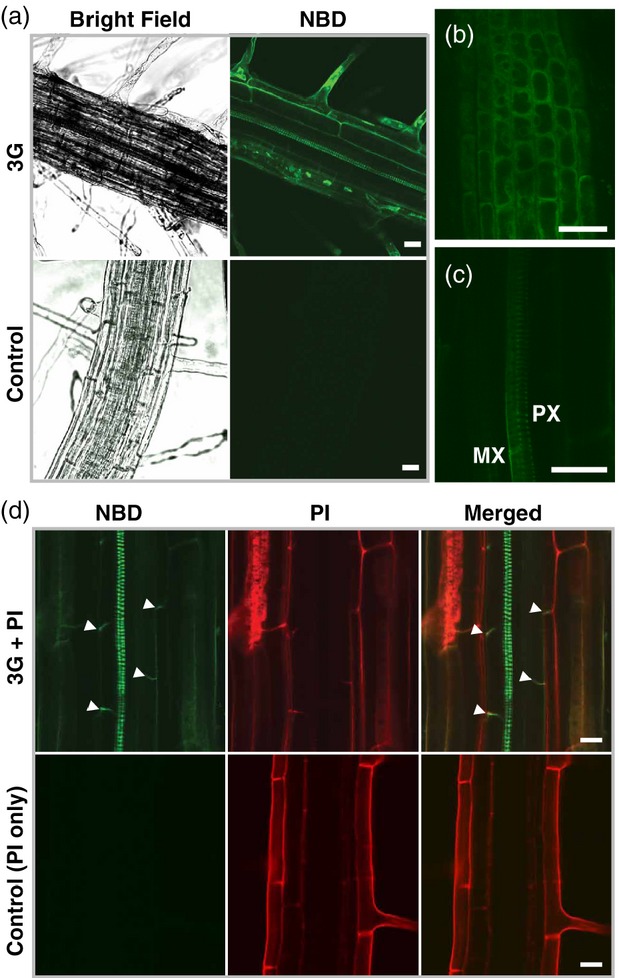
Figure 6
Incorporation of NBD-tagged monolignol probe 3G into Arabidopsis thaliana seedlings. (au2013c) Seedlings treated with 100 u03bc m probe 3G for 1 day after which the live seedlings were directly imaged...
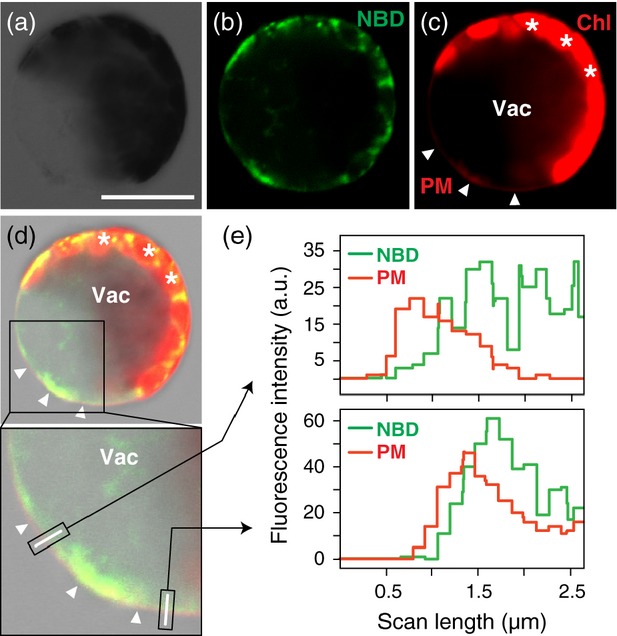
Figure 7
Subcellular localization of NBD-tagged monolignol probe 3G in Arabidopsis thaliana mesophyll protoplast cells. Isolated protoplast cells were treated with 50 u03bc m NBD probe 3G and then treated with...
Figure images are served from the NIH/NLM PubMed Central Open Access Subset or Europe PMC; copyright remains with the publishers and authors.
💬 Discussion
0 commentsNo comments yet. Be the first to start a discussion!
Leave a Comment