Abstract
AbstractThe dynamic ribosome–translocon complex, which resides at the endoplasmic reticulum (ER) membrane, produces a major fraction of the human proteome1,2. It governs the synthesis, translocation, membrane insertion, N-glycosylation, folding and disulfide-bond formation of nascent proteins. Although individual components of this machinery have been studied at high resolution in isolation3–7, insights into their interplay in the native membrane remain limited. Here we use cryo-electron tomography, extensive classification and molecular modelling to capture snapshots of mRNA translation and protein maturation at the ER membrane at molecular resolution. We identify a highly abundant classical pre-translocation intermediate with eukaryotic elongation factor 1a (eEF1a) in an extended conformation, suggesting that eEF1a may remain associated with the ribosome after GTP hydrolysis during proofreading. At the ER membrane, distinct polysomes bind to different ER translocons specialized in the synthesis of proteins with signal peptides or multipass transmembrane proteins with the translocon-associated protein complex (TRAP) present in both. The near-complete atomic model of the most abundant ER translocon variant comprising the protein-conducting channel SEC61, TRAP and the oligosaccharyltransferase complex A (OSTA) reveals specific interactions of TRAP with other translocon components. We observe stoichiometric and sub-stoichiometric cofactors associated with OSTA, which are likely to include protein isomerases. In sum, we visualize ER-bound polysomes with their coordinated downstream machinery.
🔬 Techniques
🔭 Microscopes
💻 Software
✨ Fluorophores
🧪 Sample Preparation
🔬 Cell Lines
🏭 Microscope Brands
🧪 Reagent Suppliers
📷 Detectors
💻 Software Details
💾 Data Repositories
🏷️ Research Resource Identifiers (RRIDs)
Verified research resources used in this paper:
🏛️ Research Organizations (ROR)
Affiliated research institutions:
📋 Methods
CRISPR–Cas9 knockout of CCDC47 FreeStyle 293-F cells (Thermo Fisher Scientific, R79007 ) were transfected with the plasmid pSpCas9(BB)-2A-Puro (PX459) V2.0 from the F. Zhang laboratory (Addgene plasmid 62988) containing the 20-bp single guide RNA (sgRNA) target sequence 5′-CACCGGTACACGGTGAACTCGTGCG-3′, PAM: AGG or 5′-CACCGGGAGGAAGCGGGCGAGGTGC-3′, PAM:GGG. Transfection was performed using Lipofectamine 2000 (Thermo Fisher Scientifiic, 11668019) according to the manufacturer’s instructions using 1 μg DNA per ml of culture at a cell density of 1 × 10 6 cells per ml. Cells were cultured for 48 h in FreeStyle 293 expression medium (Thermo Fisher Scientific, 12338018) on an orbital shaker (120 RPM) at 37 °C and supplemented with 5% CO 2 . Two days after transfection, cells were collected and resuspended in complete Dulbecco’s Modified Eagle Medium (DMEM) (Thermo Fisher Scientific, 11966025) (supplemented with 10% fetal bovine serum (Thermo Fisher Scientific, 10100147) and GlutaMAX-I (Thermo Fisher Scientific, 35050061)) with 0.5 μg ml −1 Puromycin (InvivoGen, ant-pr-1). Subsequently, cells were plated in T175 flasks (Thermo Fisher Scientific, 159910) and grown for 7 days in complete DMEM with 0.5 μg ml −1 Puromycin with periodical medium exchange or sub-culturing when confluency was reached. After 7 days of Puromycin selection, surviving cells were dislodged, collected, and resuspended at 5 cells per ml in conditioned complete DMEM. One-hundred and fifty microlitres per well of cell suspension was plated into sterile 96-well plates and cultured for 14 days. Cell colonies derived from single cells were used for further cell expansion. After 14 days in culture, conditioned complete DMEM was exchanged for FreeStyle medium and cell colonies transferred into 24-well plates. Subsequently, cells were grown to confluency and further expanded into 6-well plates and 10-cm dishes before analysis.
Show full methods section
CRISPR–Cas9 knockout of CCDC47 FreeStyle 293-F cells (Thermo Fisher Scientific, R79007 ) were transfected with the plasmid pSpCas9(BB)-2A-Puro (PX459) V2.0 from the F. Zhang laboratory (Addgene plasmid 62988) containing the 20-bp single guide RNA (sgRNA) target sequence 5′-CACCGGTACACGGTGAACTCGTGCG-3′, PAM: AGG or 5′-CACCGGGAGGAAGCGGGCGAGGTGC-3′, PAM:GGG. Transfection was performed using Lipofectamine 2000 (Thermo Fisher Scientifiic, 11668019) according to the manufacturer’s instructions using 1 μg DNA per ml of culture at a cell density of 1 × 10 6 cells per ml. Cells were cultured for 48 h in FreeStyle 293 expression medium (Thermo Fisher Scientific, 12338018) on an orbital shaker (120 RPM) at 37 °C and supplemented with 5% CO 2 . Two days after transfection, cells were collected and resuspended in complete Dulbecco’s Modified Eagle Medium (DMEM) (Thermo Fisher Scientific, 11966025) (supplemented with 10% fetal bovine serum (Thermo Fisher Scientific, 10100147) and GlutaMAX-I (Thermo Fisher Scientific, 35050061)) with 0.5 μg ml −1 Puromycin (InvivoGen, ant-pr-1). Subsequently, cells were plated in T175 flasks (Thermo Fisher Scientific, 159910) and grown for 7 days in complete DMEM with 0.5 μg ml −1 Puromycin with periodical medium exchange or sub-culturing when confluency was reached. After 7 days of Puromycin selection, surviving cells were dislodged, collected, and resuspended at 5 cells per ml in conditioned complete DMEM. One-hundred and fifty microlitres per well of cell suspension was plated into sterile 96-well plates and cultured for 14 days. Cell colonies derived from single cells were used for further cell expansion. After 14 days in culture, conditioned complete DMEM was exchanged for FreeStyle medium and cell colonies transferred into 24-well plates. Subsequently, cells were grown to confluency and further expanded into 6-well plates and 10-cm dishes before analysis.
Cell culture
HeLa and U2OS cells (from ATCC, CVCL_0042 and CVCL_0030 in Cellosaurus.org, respectively) were grown in standard tissue culture conditions (37°, 5% CO2) in DMEM Glutamax (Gibco). HEK 293F cells (Thermo Fisher Scientific, R79007 ) were grown in suspension in FreeStyle medium with 120 rpm agitation. Cell lines were not authenticated and were tested for negative mycoplasma. ER-vesicle preparation HEK 293F wild-type or CCDC47 knockout cells (0.5–1 × 10 6 cells per ml, 50 ml) were collected and washed (3 times with PBS, at 300 g , 5 min, 4 °C). HEK 293F cells used for ER stress studies were treated with 10 mM DTT for 2 h before collection. Cells were resuspended in lysis buffer (2–4 ml, 10 mM HEPES-NaOH pH 7.4, 250 mM sucrose, 2 mM MgCl 2 , 0.5 mM DTT, protease inhibitor cocktail (Roche)) and lysed using a Isobiotec cell cracker (5–10 passes, 14 μm clearance, on ice). The lysate was cleared (1,500 g , 2–3 × 5 min, 4 °C, in 2 ml tubes) using a cooled tabletop centrifuge. Vesicles were pelleted (10,000 g , 10 min, 4 °C), and washed with resuspension buffer (10 mM HEPES, 250 mM sucrose, 1 mM MgCl 2 , 0.5 mM DTT). The pellet was resuspended at a concentration of ~50 mg ml −1 determined by A 280 , frozen in liquid nitrogen and stored at −80 °C until further use. The supernatant was used for proteomics as control. Twenty micrograms of microsomes were used for SDS–PAGE followed by immunoblotting using antibodies against SEC61α (Abcam, ab15575; 1:1,000), TRAPγ (Sigma Aldrich, hpa014906; 1:1,000) and CCDC47 (Abcam, ab241608; 1:1,000). Mass spectrometry data acquisition Approximately 100 μg of the isolated ER-microsome and cytosolic fraction (supernatant) were digested using an S-Trap micro-MS column (protifi) according to the vendor’s protocol. Proteins were solubilized in lysis buffer (10% SDS, 100 mM Tris, pH 8), reduced (100 mM TCEP), alkylated (400 mM CAA in isopropanol) and denatured (27.5% phosphoric acid). For protein trapping, samples were flown over an S-Trap micro spin column, (10,000g, 30 s) and further washed with binding buffer (100 mM triethylammonium bicarbonate (TEAB) buffer, in 90% methanol). Protein digestion was achieved with an overnight incubation at 37 °C using a water bath (Grant Instruments, JB Academy) after the addition of digestion buffer (10% trypsin, 2% lysine, 50 mM Tris). Protein peptides were retrieved by washing with elution buffer (50 mM Tris), using a tabletop centrifuge (10,000 g , 1 min). Eluted peptides were lyophilized and dissolved in 2% formic acid prior to liquid chromatography–mass spectrometry (LC–MS/MS) data acquisition. MS data were acquired using an Ultimate 3000 RSLC nano system (Thermo Scientific) coupled to an Exploris 480 (Thermo Scientific). Three technical replicates of each sample were measured. Peptides were first trapped in a pre-column (Dr. Maisch Reprosil C18, 3 μm, 2 cm × 100 μm) prior to separation on the analytical column packed in-house (Poroshell EC-C18, 2.7 μm, 50 cm × 75 μm), both columns were kept at 40 °C in the built-in oven. Trapping was performed for 10 min in solvent A (0.1% v/v formic acid in water), and the elution gradient profile was as follows: 0–10% solvent B (0.1% v/v formic acid in 80% v/v acetonitrile) over 5 min, 13–44% solvent B over 37 min, 44–100% solvent B over 4 min, and finally 100% B for 4 min before re-equilibration in 100% A for 8 min. The mass spectrometer was operated in a data-dependent mode. Full-scan mass spectra were collected in a mass range of m / z 350–1,300 Thomson (Th) in the Orbitrap at a resolution of 60,000 after accumulation to an AGC target value of 10 6 with a maximum injection time of 50 ms. In-source fragmentation was activated and set to 15 eV. The cycle time for the acquisition of MS/MS fragmentation scans was set to 1 s. Dynamic exclusion properties were set to n = 1 and to an exclusion duration of 10 s. HCD fragmentation (MS/MS) was performed with a fixed normalized collision energy of 27% and the mass spectra acquired in the Orbitrap at a resolution of 30,000 after accumulation to an AGC target value of 10 5 with an isolation window of m / z = 1.4 Th. Raw data were processed using the MaxQuant software 51 version 2.0.1.0 with standard settings applied. In brief, the extracted peak lists were searched against the reviewed Human UniProtKB database (date 15 July 2021; 20,353 entries), with an allowed precursor mass deviation of 4.5 ppm and an allowed fragment mass deviation of 20 ppm. Cysteine carbamidomethylation was set as static modification, and methionine oxidation, N-terminal acetylation as variable modifications (maximum 5 modifications per peptide allowed). Both LFQ quantification and ‘match between runs’ were enabled. The iBAQ values in Supplementary Fig. 4b are approximate absolute abundances of the identified proteins derived by the normalization of the summed peptide intensities by the number of theoretically observable peptides for a given protein.Raw data were processed using the MaxQuant software 51 version 2.0.1.0 with standard settings applied. In brief, the extracted peak lists were searched against the reviewed Human UniProtKB database (date 15 July 2021; 20,353 entries), with an allowed precursor mass deviation of 4.5 ppm and an allowed fragment mass deviation of 20 ppm. Cysteine carbamidomethylation was set as static modification, and methionine oxidation, N-terminal acetylation as variable modifications (maximum five modifications per peptide allowed). Both LFQ quantification and ‘match between runs’ were enabled. The iBAQ values in Supplementary Fig. 4b are approximate absolute abundances of the identified proteins derived by the normalization of the summed peptide intensities by the number of theoretically observable peptides for a given protein.
Grid preparation
ER vesicles were diluted in resuspension buffer to a concentration of 2–3 mg ml −1 and 2 μl were applied onto a glow-discharged lacey carbon grid (Quantifoil). Four m,icrolitres of BSA-conjugated gold beads (10 nm, UMC Utrecht) diluted in resuspension buffer without sucrose were added and mixed with the sample on grid. Grids were immediately blotted from the backside for 5–6 s and plunged into a mix of liquid ethane and propane using a manual plunger. For the adherent cell lines (Hela and U2OS), cells were seeded on R2/2 holey carbon on gold grids (Quantifoil) coated with fibronectin in a Mattek dish and incubated for 24 h. The suspension HEK 293F cells were grown to mid-log phase, and the cells were then directly pipetted onto glow-discharged R2/1 Carbon on Copper grids (Quantifoil). Grids were immediately blotted from the back for 10 s and plunged into liquid ethane propane mix using a manual plunger.
Lamella preparation
Lamellae were prepared using an Aquilos FIB-SEM system (Thermo Fisher Scientific). Grids were sputtered with an initial platinum coat (10 s) followed by a 10 s gas injection system (GIS) to add an extra protective layer of organometallic platinum. Samples were tilted to an angle of 15° to 22° and 12 μm wide lamellae were prepared. The milling process was performed with an ion beam of 30 kV energy in 3 steps : (1) 500 pA, gap 3 μm with expansion joints, (2) 300 pA, gap 1 μm, (3) 100 pA, gap 500 nm. Lamellae were finally polished at 30–50 pA with a gap of 200 nm.
Data acquisition
We acquired 869 tilt series on a Talos Arctica (Thermo Fisher Scientific) operated at an acceleration voltage of 200 kV and equipped with a K2 summit direct electron detector and energy filter (Gatan). Images were recorded in movies of 7–8 frames at a target defocus of 3 μm and an object pixel size of 1.72 Å. Tilt series were acquired in SerialEM (3.8) 52 using a grouped dose-symmetric tilt scheme 53 covering a range of ±54° with an angular increment of 3°. The cumulative dose of a series did not exceed 80 e − Å −2 . Lamella data used in this analysis has been collected in one session on a pool of grids of human cell lines. Twenty-seven tilt series were acquired on six different lamellae on a Talos Arctica (same instrument as above). Images were recorded in movies of 5–8 frames at a target defocus of 4 μm and an object pixel size of 2.17 Å. Tilt series were acquired in SerialEM using a grouped dose-symmetric tilt scheme covering a range of ±60° with a pre tilt of ±10° and an angular increment of 3°. The cumulative dose of a series did not exceed 70 e − Å −2 .
Reconstruction and particle localization
Video files of individual projection images were motion-corrected in Warp (1.0.9) 54 and combined into stacks of tilt series with the determined contrast transfer function (CTF) parameters. The combined stacks were aligned using the gold fiducials in IMOD (4.10.25) 55 . Per-tilt CTF estimation for entire tilt series was performed in Warp and full deconvoluted tomograms were reconstructed by weighted back projection at a pixel size of 20 Å. Ice thickness was determined manually for a subset of 50 tomograms and results in an average thickness of 156 nm. Particle coordinates were determined by template matching against a reconstruction of a human 80S ribosome filtered to 40 Å and downsampled to match the tomogram pixel size (20 Å) using pyTOM (0.994) 56 . Most false-positive hits were manually removed in pyTOM. The determined positions of ribosomes were used to extract subtomograms and their corresponding CTF volumes at a pixel size of 3.45 Å (2× binned) in Warp. Video files of individual projection images were motion-corrected in Warp 54 and combined into stacks of tilt series with the determined CTF parameters. The combined stacks were aligned using the gold fiducials in IMOD 55 . Per-tilt CTF estimation for entire tilt series was performed in Warp and full deconvoluted tomograms were reconstructed by weighted back projection at a pixel size of 20 Å. Ice thickness was determined manually for a subset of 50 tomograms and results in an average thickness of 156 nm. Particle coordinates were determined by template matching against a reconstruction of a human 80S ribosome filtered to 40 Å and downsampled to match the tomogram pixel size (20 Å) using pyTOM 56 . Most false-positive hits were manually removed in pyTOM. The determined positions of ribosomes were used to extract subtomograms and their corresponding CTF volumes at a pixel size of 3.45 Å (2× binned) in Warp. Lamellae data were processed as above with slight variations. Video files of individual projection images were motion- and CTF-corrected in Warp and combined into stacks of tilt series. The combined stacks were aligned using patch tracking in IMOD. CTF estimation for entire tilt series was performed in Warp and full tomograms were reconstructed by weighted back projection at a pixel size of 17.36 Å. Ice thickness was determined manually and was found to be
📊 Figures
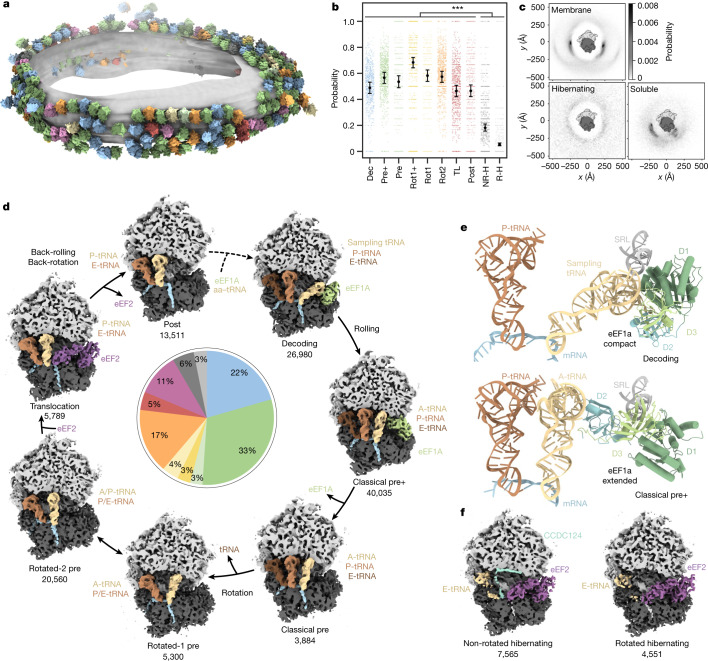
Fig. 1
Captured human ribosomal states and spatial distribution.
a , Different ribosome states mapped back onto one exemplary ER-derived vesicle ( n =u2009869 tomograms from one experiment, two independent replicates; Extended Data Fig. 4 ). b , Probabilities of ri...
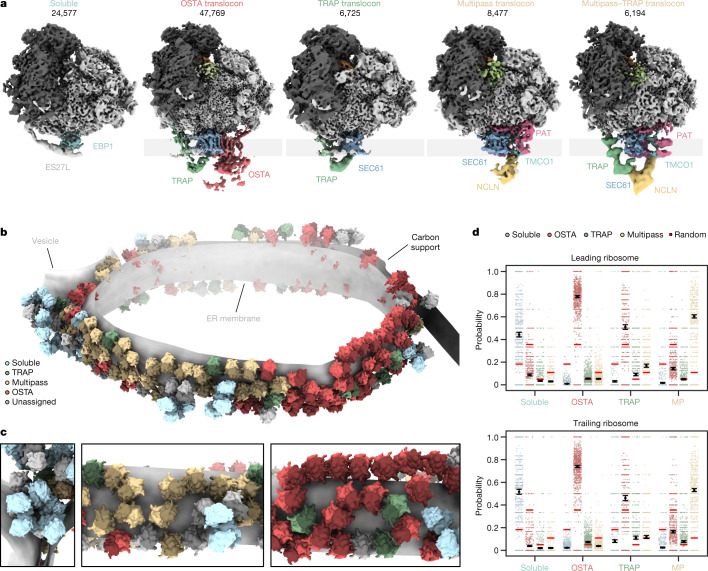
Fig. 2
Organization of soluble and ER membrane-associated ribosome populations.
a , Locally filtered reconstructions of different soluble and ER membrane-associated ribosome populations resulting from 3D classification focused near the exit tunnel. b , Segmented representation of...
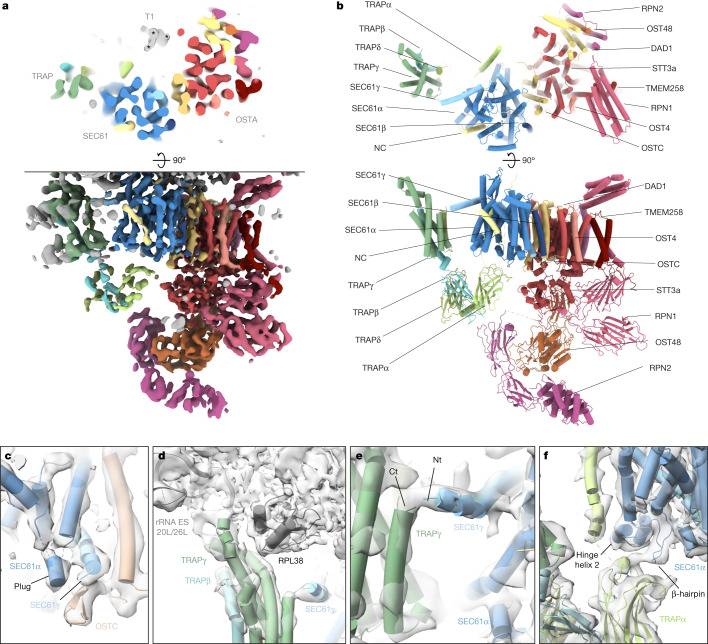
Fig. 3
Atomic model of the most abundant ER translocon.
a , Top view (top) and side view (bottom) of the translocon-centred reconstruction of SEC61u2013TRAPu2013OSTA. b , Atomic model of the ER translocon built from cryo-EM structures (PDB: 3JC2 and 6S7O) ...
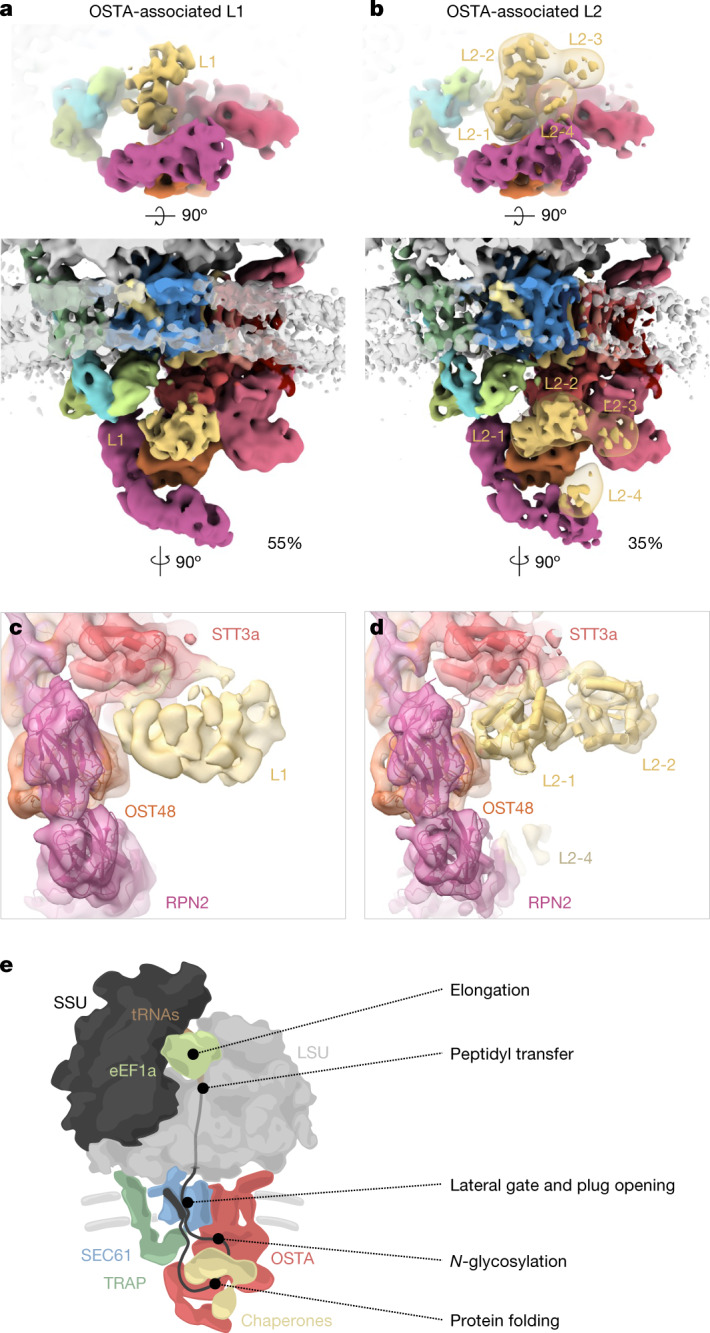
Fig. 4
Co-translational ER biogenesis factors and summary.
a , b , Top view (top) and front view (bottom) of the accessory factors L1 ( a ) and L2 ( b ) associated with the SEC61u2013TRAPu2013OSTA translocon. The transparent map represents L2 filtered to a re...
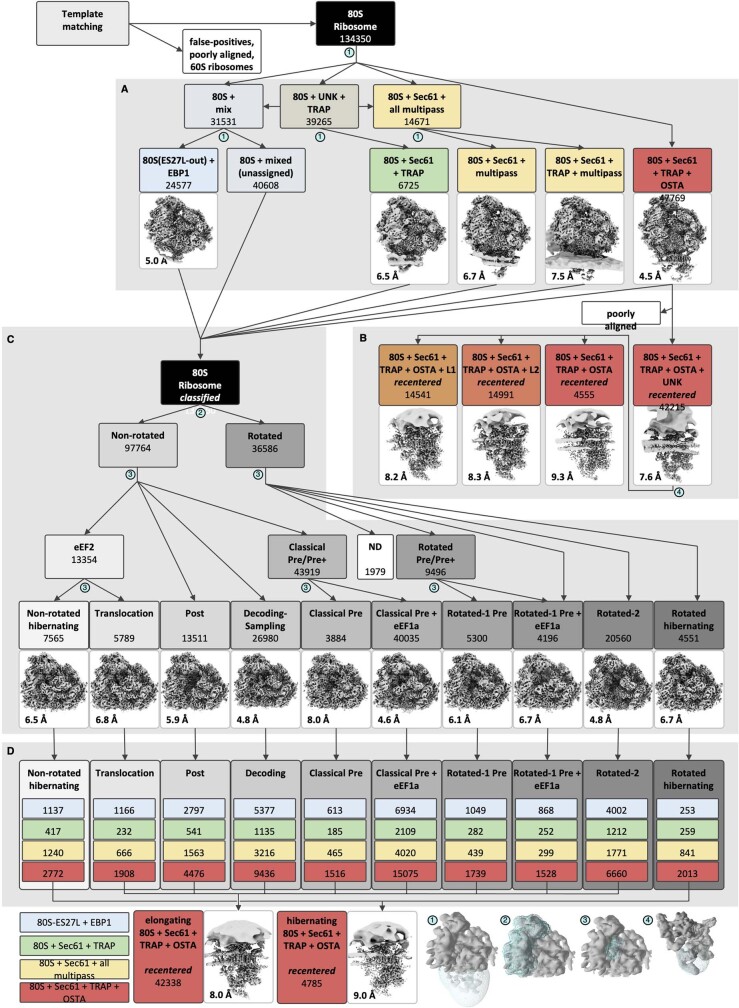
Extended Data Fig. 1
Cryo-ET data analysis workflow.
Template matching in PyTom 69 generates candidates for ribosomal particles, which are further analyzed in RELION 57 and M 17 . Initial coarse 3D classification allowed removal of false positives, poor...
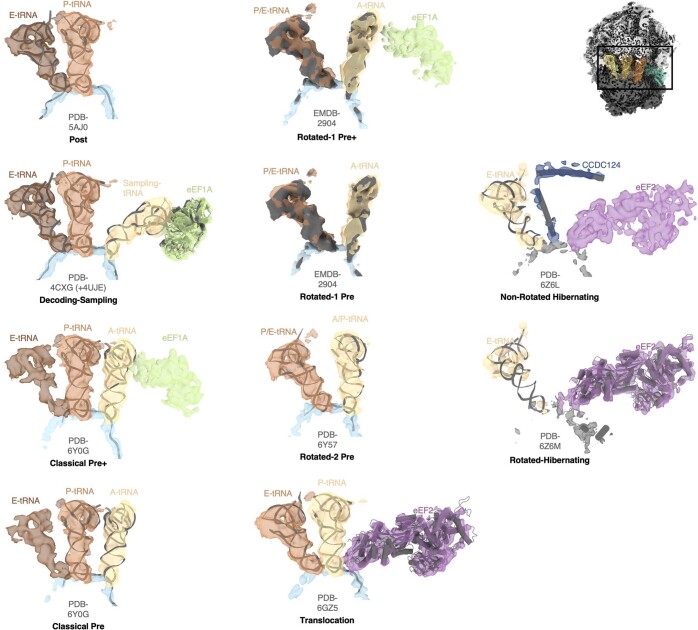
Extended Data Fig. 2
Identification of ribosomal intermediate states.
Large ribosomal subunits of models or maps of previously characterized intermediate states were fitted into our reconstructions from Fig. 1A , of which we only show the tRNAs and elongation factors fo...
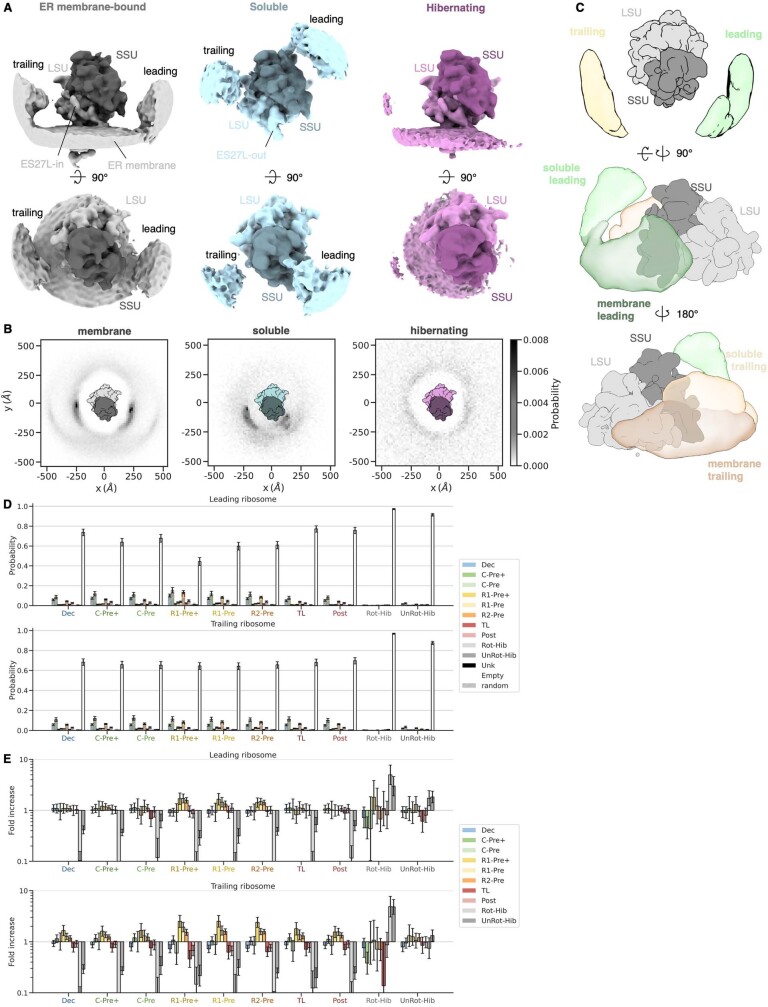
Extended Data Fig. 3
Neighborhood analysis of ER membrane-bound and soluble ribosomes and their intermediate states.
( A ) Side view (top panels) and top view (bottom panels) of filtered reconstructions of ER-membrane bound, soluble and hibernating ribosome populations depicted at low contour level. Densities of lea...
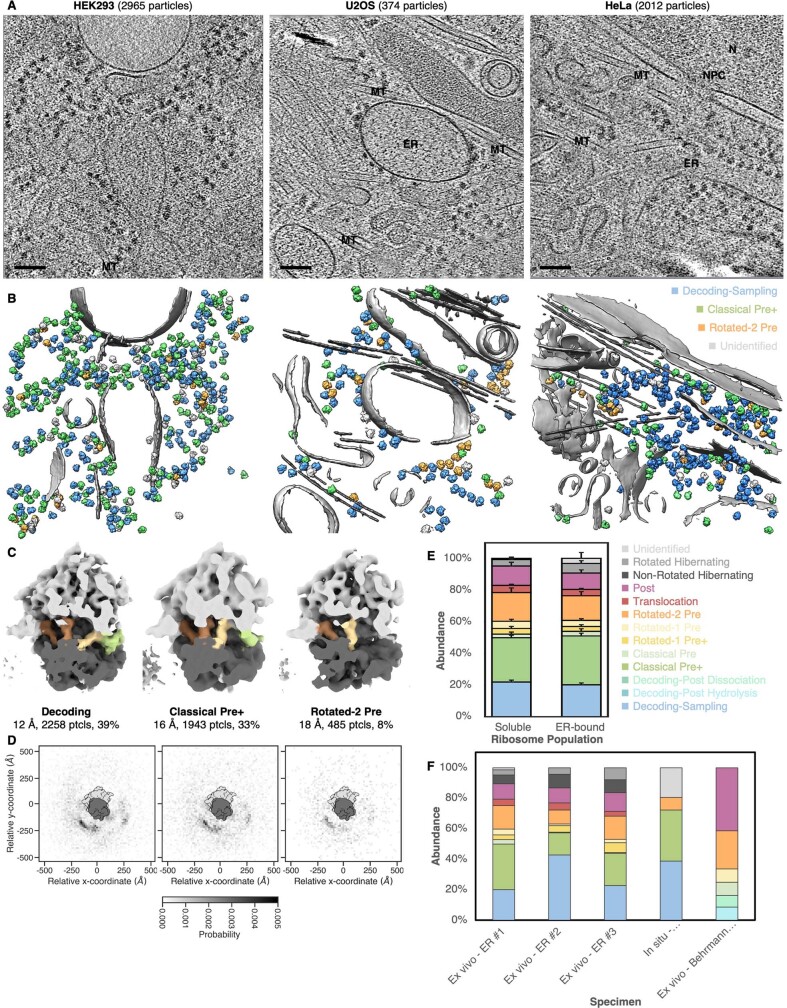
Extended Data Fig. 4
Ribosome states in situ and comparison to ex vivo abundances.
( A ) Central slice (thickness 1.7 nm) of representative tomograms of cryo-FIB milled HEK293, U2OS and HeLa cells. Scale bar: 100 nm. ( B ) Segmented representation of tomograms from ( A ). Subtomogra...
Extended Data Fig. 5
Identification of elongation factor-bound ribosomal intermediate states.
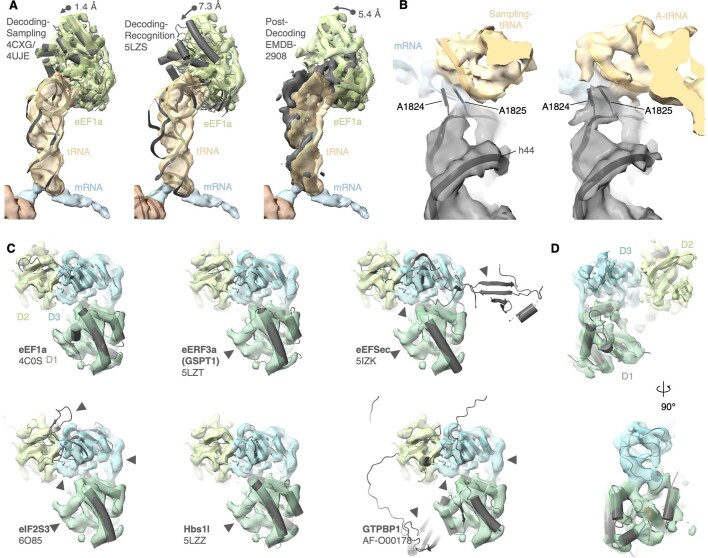
( A ) Superposition of the decoding-sampling (4CXG+4UJE), decoding-recognition (5LZS) and post-decoding (EMDB-2908) state (dark grey cartoon representations) onto our reconstruction (semi-transparent ...
Extended Data Fig. 6
Single particle analysis of the ribosome in the classical pre+ state.
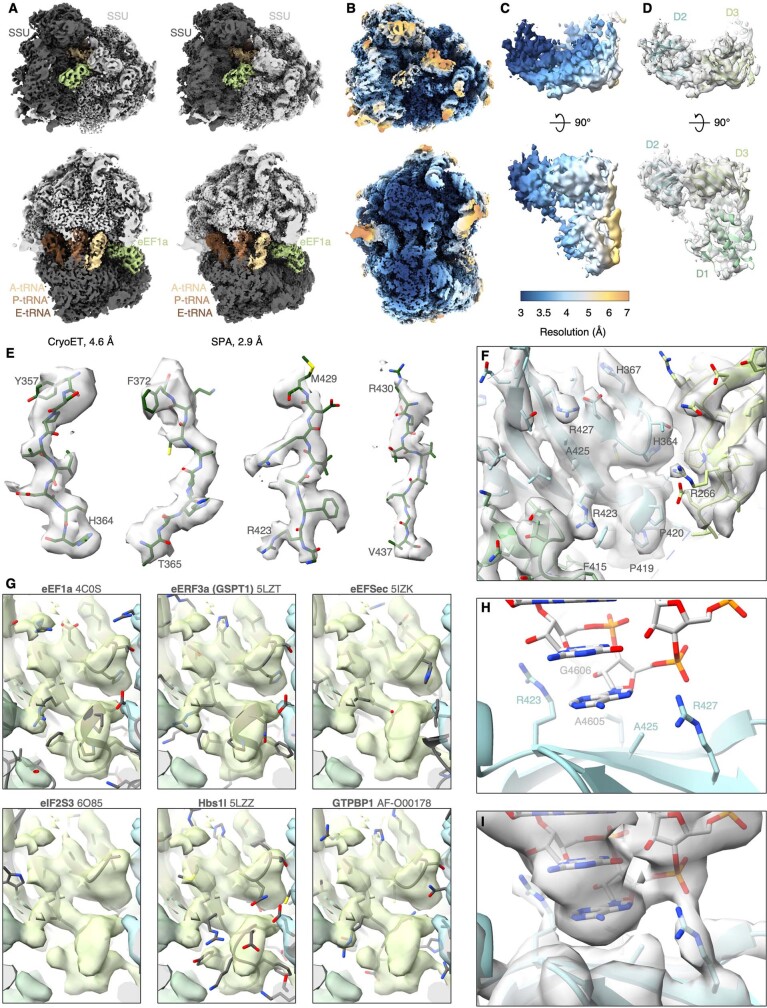
( A ) Comparison of cryo-ET and SPA reconstructions of the ribosome in the classical pre+ state filtered to local resolution. Ribosomes were clipped in top views (bottom panels). ( B ) SPA reconstruct...
Extended Data Fig. 7
Neighbor probability analysis of soluble and ER translocon populations.
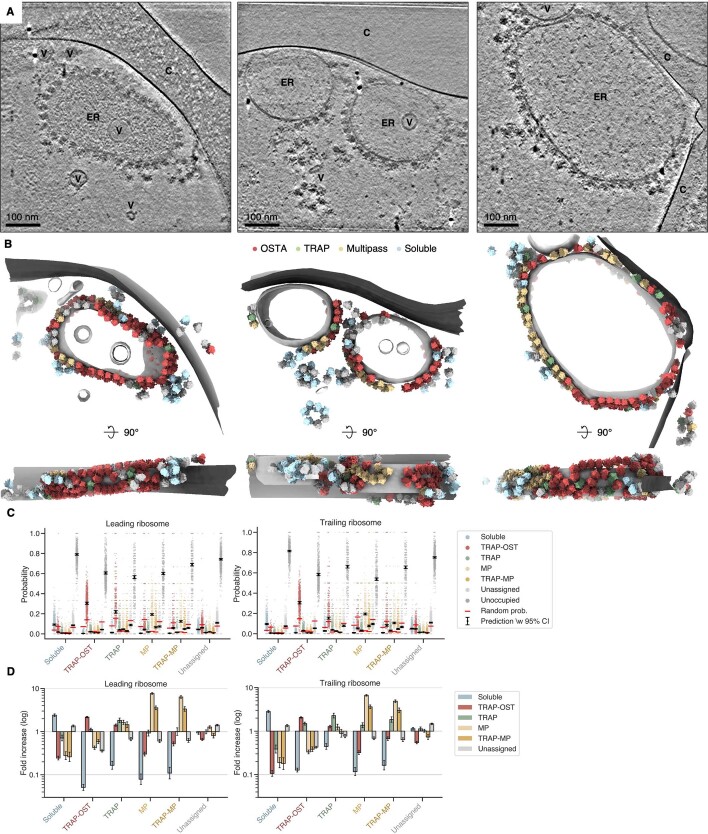
( A ) Central slices from representative filtered tomograms of ER-derived vesicles. ER (endoplasmic reticulum), V (vesicle), C (carbon support). ( B ) Segmented representation of tomograms from ( A ),...
Extended Data Fig. 8
Reconstruction of the Sec61-TRAP-OSTA-translocon.
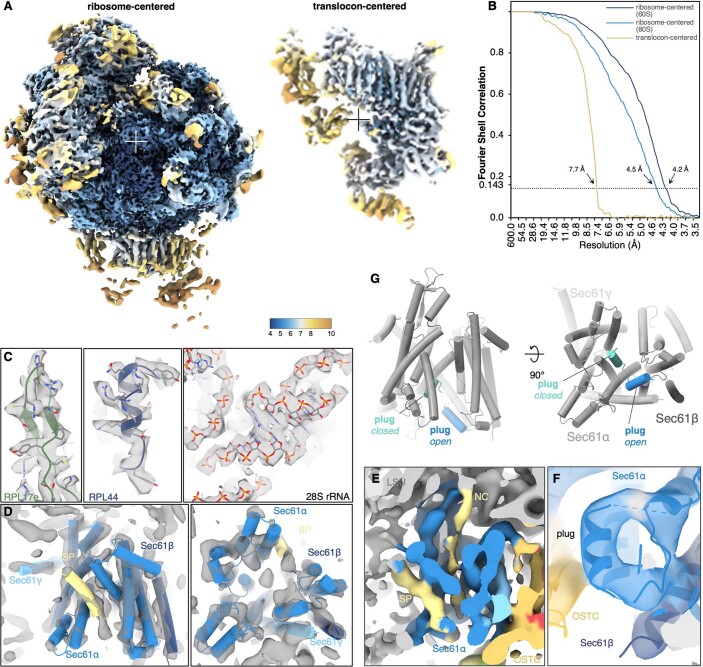
( A ) Ribosome- and translocon-centered reconstruction of the ribosome-Sec61-TRAP-OSTA-translocon color-coded by local resolution (color bar in u00c5). Centers of the respective reconstructions are in...
Extended Data Fig. 9
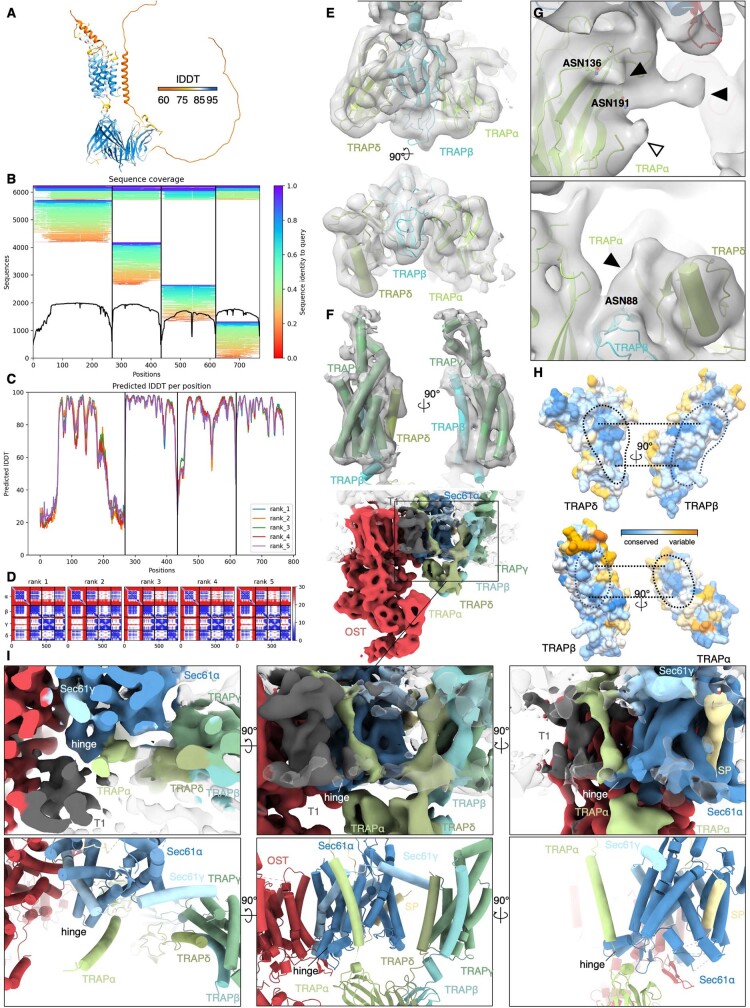
Model building of the TRAP complex.
( A ) Prediction model of TRAP ( P43307 , P43308 , Q9UNL2 , P51571 ) obtained by Colabfold (v1.4) 70 using MMseqs2 and Alphafold2-multimer (v2) 62 color-coded according to predicted local distance dif...
Extended Data Fig. 10
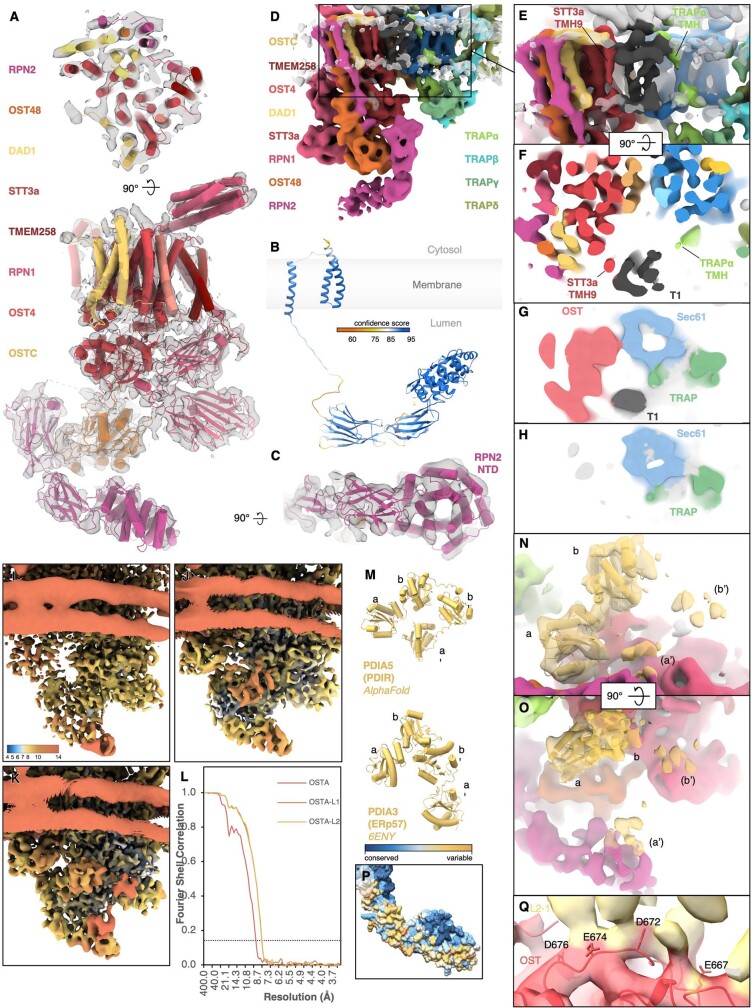
Native OSTA and its accessory factors.
( A ) View from cytosol (top) and side view (bottom) of the OSTA complex (PDB 6S7O, AlphaFold P04844 ) fitted into the segmented map of the translocon-centered reconstruction of the OSTA-translocon. (...
Figure images are served from the NIH/NLM PubMed Central Open Access Subset or Europe PMC; copyright remains with the publishers and authors.
💬 Discussion
0 commentsNo comments yet. Be the first to start a discussion!
Leave a Comment