Abstract
AbstractThree-photon wide-field depth-resolved excitation is used to overcome some of the limitations in conventional point-scanning two- and three-photon microscopy. Excitation of chromophores as diverse as channelrhodopsins and quantum dots is shown, and a penetration depth of more than 700 μm into fixed scattering brain tissue is achieved, approximately twice as deep as that achieved using two-photon wide-field excitation. Compatibility with live animal experiments is confirmed by imaging the cerebral vasculature of an anesthetized mouse; a complete focal stack was obtained without any evidence of photodamage. As an additional validation of the utility of wide-field three-photon excitation, functional excitation is demonstrated by performing three-photon optogenetic stimulation of cultured mouse hippocampal neurons expressing a channelrhodopsin; action potentials could reliably be excited without causing photodamage.
🔬 Techniques
✨ Fluorophores
🧪 Sample Preparation
🔬 Cell Lines
🏭 Microscope Brands
🧪 Reagent Suppliers
📷 Detectors
🎨 Filters
🏛️ Research Organizations (ROR)
Affiliated research institutions:
📋 Methods
Sample preparation
QD samples were prepared by dispersing a 4 μL drop of QDs suspended in water (525 nm emitting nanocrystals provided by QD Vision) on a microscope slide. A drop of UV-curing adhesive (Norland Products NOA 74) was placed on the dried QDs, a coverslip placed on top, and the sample cured by exposure to a UV source. HeLa cells on a glass coverslip were fixed at room temperature using 4% paraformaldehyde (Electron Microscopy Sciences 15742-10) for 10 min, permeablized for 2 × 15 min using 0.25% Triton X-100 (Sigma Aldrich 93427) in phosphate-buffered saline, and then treated with an endogenous biotin blocker (Life Technologies E21390). This was followed by treatment with Biotin-XX Phalloidin (Life Technologies B7474) for 20 min, then a 605-nm-emission QD-streptavidin conjugate (Life Technologies Q10151MP) before sealing with a coverslip using Mount Quick medium (Electron Microscopy Sciences 18000).
Mouse vasculature imaging
Intravital images were taken through a cranial window implanted into a male nude mouse 13 , 14 . The mouse was anesthetized by intraperitoneal injection of ketamine and xylazine. A tail vein catheter was placed for injecting the QD solution during imaging, however the injection was not performed until the mouse had been secured on the instrument. The QD solution consisted of green-emitting QDs in polyethylene glycol (PEG)-phospholipid micelles, synthesized as follows: QDs were transferred into aqueous buffers using a previously reported procedure 15 , 16 . Three milligrams (dry weight) QDs were mixed with 25 mg 18:1 PEG2000 PE (1,2-dioleoyl-sn-glycero-3-phosphoethanolamine- N -methoxy(polyethylene glycol)-2000; ammonium salt; Avanti Polar Lipids; cat. no. 880130) in chloroform. After sonication for 10 s, the solvent was removed under nitrogen flow and 2 mL isotonic saline or water was added. To completely solubilize the QDs, the aqueous solution was sonicated with a probe sonicator for 5 min, and filtered through a 0.2 μm filter. A total volume of 200 μL of this solution was injected during imaging. Animal experiments were conducted in accordance with approved institutional protocols of MGH and MIT. Temporal focusing A regenerative amplifier (Coherent Legend Elite) produced 130 fs pulses at 10 kHz, with 600 μJ pulse energy and 800 nm center wavelength. W average power was used to pump an optical parametric amplifier (OPA; Coherent, Opera Solo with second harmonic option) that converted the 800 nm pulses to 1300 nm, with average power up to 450 mW (up to 14% conversion efficiency). After an upgrade, 5.5 W average power was used to pump the OPA, yielding up to 960 mW at 1300 nm (17% conversion efficiency). The light from the OPA was attenuated either by altering the regenerative amplifier’s pulse compressor, by using a half waveplate (Thor Labs AHWP05M-1600) and polarizer (Newport 10GL08AR.18), or by placing a large tilted coverslip in the beam. The light then passed through a shutter (Vincent Associates VS25S2ZM1R3, suspended from an overhead gantry to avoid vibrational coupling to the table) and an 850 nm long-pass filter (Thor Labs FELH0850) to a variable beam expander (capable of × 1, × 2.5, × 3.5 and × 5 beam expansion). It then reflected off a silver mirror (Thor Labs PFSQ20-03-P01) onto a diffraction grating (Custom, Spectrogon 715.706.410 G 0750 NIR). The -1 order from the grating was imaged onto the microscope image plane through a × 0.25 telescope consisting of a 200-mm focal length, 75 mm diameter lens (Edmund Optics 86-923) and a 50 mm focal length compound lens made from two 100 mm focal length 30 mm diameter lenses (Edmund Optics 67-572). The silver mirror was placed as close to the 75 mm lens as possible, to operate the grating in a near-Littrow condition for efficiency. After the telescope, excitation light entering the microscope was collimated by a tube lens (Zeiss 425308-0000-000), reflected off a 1200 nm short-pass dichroic mirror (Edmund Optics 86-699) and imaged onto the sample through the × 25 1.0 NA near-IR microscope objective (Olympus XLPN25XSVMP) mounted on a 400-μm travel focusing drive (Piezosystem Jena MIPOS 500 SG). The median axial full-width half-maximum (FWHM) was found to be ~3.0 μm ( Supplementary Fig. 2 ). The two-photon excitation path was very similar; light from the regenerative amplifier was expanded using a × 5 Galilean cylindrical telescope constructed from a -15 mm focal length lens (Thor Labs, LK1006L1-B) and 75 mm focal length lens (Edmund Optics, 69-762). The beam struck a grating (Richardson Gratings, 53006BK02-540R) at an angle of 74°, such that the -1 order diffracted beam propagated along the microscope’s optical axis. The beam was demagnified using a × 1.75 telescope before being imaged onto the intermediate image plane as before; this telescope consisted of a 3″ diameter 190 mm focal length compound lens made from two singlets (Edmund Optics 86-920 and Newport KPX232AR.16), and the same 30 mm diameter 50 mm focal length lens used for three-photon excitation. Other than a change of filter cube to a 750 nm dichroic (Semrock, FF750-SDi02-25 × 36) and 775 nm short-pass emission filter (Semrock, FF01-775/SP-25), the microscope was identical to the three-photon configuration. The median axial FWHM was found to be ~18 μm ( Supplementary Fig. 3 ). For imaging experiments, fluorescence emission passed through the objective, dichroic, emission filter (1200 nm short pass, Edmund Optics 86-693) and microscope tube lens, before being detected on an EMCCD camera (Andor iXon 885k). The optical layout can be seen in Supplementary Fig. 1 . For the HeLa cells, the imaging parameters were 10 s integration time, × 100 EM gain on the EMCCD, 80 mW incident power and × 5 beam expander. Flat-field correction was applied to reduce the effect of non-uniform excitation. To determine the power scaling, pure QD samples were imaged with varying excitation intensities (controlled by a tilted coverslip to minimize dispersion). Images were captured on the camera with a 1 s integration time for the 525 nm QDs, and 0.1 s for the 605 nm QDs. The excitation region was cropped, the background subtracted and the average fluorescence intensity plotted as a function of incident power. For electrophysiology experiments, a Faraday cage was built around microscope, and an illumination system constructed, consisting of a red (Thor Labs M660L3, 660 nm center wavelength) and blue (Thor Labs M470L2, 470 nm center wavelength) LED combined using a dichroic mirror (make and model unknown; taken from a Green Fluorescent Protein filter cube) and focused onto the sample using a microscope objective (Olympus PlanN × 10/0.25). The red LED was used to locate the cells by bright-field illumination without triggering an action potential, and the blue LED was used to both excite fluorescence (in order to locate cells with high expression of CoChR) and to excite an action potential when necessary. Incident power required to excite an action potential was found to be between ~0.13 and 1.8 mW mm −2 . For experiments establishing the maximum achievable frequency due to one-photon absorption, the intensity was optimized until the highest frequency could be achieved; these are the data reported. To investigate the primary damage mechanism, the focal plane was placed ~180 μm from the cell surface (equal to one turn of the coarse focus knob on the microscope). Maximum laser power was used to ensure operation well above the damage threshold; this power averaged 720 mW at 1300 nm, corresponding to ~144 mW at the sample. The lowest power used was 640 mW, corresponding to ~128 mW at the sample. Four exposures of 300 ms were used as before, in addition to one exposure of 3 s. Penetration depth in fixed slices An epifluorescence microscope was constructed above the sample stage of the previously described three-photon instrument, consisting of an objective (Zeiss 421452-9880-000), tube lens (Thor Labs AC508-150-A-ML) and camera (PCO Edge 5.5). A dichroic mirror (make and model unknown; taken from a Green Fluorescent Protein filter cube) in the beam path reflected light from a 470 nm LED (Thor Labs M470L2) onto the sample to aid in locating the sample plane. Animal experiments were conducted in accordance with approved institutional protocols of MIT and MGH. Brain slices were obtained from a male C57BL/6J mouse; it was anesthetized and the tissues were fixed with 4% paraformaldehyde through cardiac perfusion. The fixed brain was extracted and kept in 4% paraformaldehyde, followed by embedding in low-melting agarose. It was then sliced to varying thicknesses using a vibratome (Leica VT1000S). The slices were placed in the well of a glass-bottomed dish (MatTek P50G-0-14-F) and covered with distilled water. A 4 μL drop of QDs suspended in water (525 nm emitting nanocrystals provided by QD Vision) was placed on a 30 mm diameter coverslip and allowed to dry; this coverslip was then placed on top of the brain slice with the QDs on the inside, the excess water wiped away and the coverslip sealed using clear nail varnish. The sample was mounted on the three-photon instrument, and the upper ‘imaging’ microscope brought into focus. The lower ‘excitation’ microscope was also focussed on an unobscured region of the QDs, to ensure the two microscopes were co-aligned. A 20 lp mm −1 Ronchi ruling (Edmund Optics 58-777) was placed at the image plane of the excitation microscope; the pattern projected onto the sample had a period of 2.2 μm. The brain slice was then translated towards the illumination region until the fluorescence from the QDs was not observable on the excitation microscope, even with 1 s exposure and × 10 electron multiplying gain. For thinner samples, green fluorescence was observable even when the brain slice completely overlapped the excitation region; in these cases, the brain slice was translated until it filled the field of view of the camera. Finally, the excitation light was refocused to maximize signal in the imaging microscope. For comparison with two-photon excitation, 6 W of average power was available at 800 nm, so a larger area was illuminated. Total power at the sample was 50 mW with an illuminated area of ~600 μm × 600 μm, however the increased cross-section of two-photon excitation relative to three-photon excitation resulted in similar emission intensities in the absence of scattering. Excitation was performed by routing light from the regenerative amplifier through a separate beam path described above. Imaging was performed with a 2 s integration time on the sCMOS camera; to compensate for vibration in the imaging microscope setup (an unavoidable consequence of having to mount the microscope so far above the table surface) 16 frames were captured and the frame exhibiting the least vibration-induced blurring was taken.
Show full methods section
Sample preparation
QD samples were prepared by dispersing a 4 μL drop of QDs suspended in water (525 nm emitting nanocrystals provided by QD Vision) on a microscope slide. A drop of UV-curing adhesive (Norland Products NOA 74) was placed on the dried QDs, a coverslip placed on top, and the sample cured by exposure to a UV source. HeLa cells on a glass coverslip were fixed at room temperature using 4% paraformaldehyde (Electron Microscopy Sciences 15742-10) for 10 min, permeablized for 2 × 15 min using 0.25% Triton X-100 (Sigma Aldrich 93427) in phosphate-buffered saline, and then treated with an endogenous biotin blocker (Life Technologies E21390). This was followed by treatment with Biotin-XX Phalloidin (Life Technologies B7474) for 20 min, then a 605-nm-emission QD-streptavidin conjugate (Life Technologies Q10151MP) before sealing with a coverslip using Mount Quick medium (Electron Microscopy Sciences 18000).
Mouse vasculature imaging
Intravital images were taken through a cranial window implanted into a male nude mouse 13 , 14 . The mouse was anesthetized by intraperitoneal injection of ketamine and xylazine. A tail vein catheter was placed for injecting the QD solution during imaging, however the injection was not performed until the mouse had been secured on the instrument. The QD solution consisted of green-emitting QDs in polyethylene glycol (PEG)-phospholipid micelles, synthesized as follows: QDs were transferred into aqueous buffers using a previously reported procedure 15 , 16 . Three milligrams (dry weight) QDs were mixed with 25 mg 18:1 PEG2000 PE (1,2-dioleoyl-sn-glycero-3-phosphoethanolamine- N -methoxy(polyethylene glycol)-2000; ammonium salt; Avanti Polar Lipids; cat. no. 880130) in chloroform. After sonication for 10 s, the solvent was removed under nitrogen flow and 2 mL isotonic saline or water was added. To completely solubilize the QDs, the aqueous solution was sonicated with a probe sonicator for 5 min, and filtered through a 0.2 μm filter. A total volume of 200 μL of this solution was injected during imaging. Animal experiments were conducted in accordance with approved institutional protocols of MGH and MIT. Temporal focusing A regenerative amplifier (Coherent Legend Elite) produced 130 fs pulses at 10 kHz, with 600 μJ pulse energy and 800 nm center wavelength. W average power was used to pump an optical parametric amplifier (OPA; Coherent, Opera Solo with second harmonic option) that converted the 800 nm pulses to 1300 nm, with average power up to 450 mW (up to 14% conversion efficiency). After an upgrade, 5.5 W average power was used to pump the OPA, yielding up to 960 mW at 1300 nm (17% conversion efficiency). The light from the OPA was attenuated either by altering the regenerative amplifier’s pulse compressor, by using a half waveplate (Thor Labs AHWP05M-1600) and polarizer (Newport 10GL08AR.18), or by placing a large tilted coverslip in the beam. The light then passed through a shutter (Vincent Associates VS25S2ZM1R3, suspended from an overhead gantry to avoid vibrational coupling to the table) and an 850 nm long-pass filter (Thor Labs FELH0850) to a variable beam expander (capable of × 1, × 2.5, × 3.5 and × 5 beam expansion). It then reflected off a silver mirror (Thor Labs PFSQ20-03-P01) onto a diffraction grating (Custom, Spectrogon 715.706.410 G 0750 NIR). The -1 order from the grating was imaged onto the microscope image plane through a × 0.25 telescope consisting of a 200-mm focal length, 75 mm diameter lens (Edmund Optics 86-923) and a 50 mm focal length compound lens made from two 100 mm focal length 30 mm diameter lenses (Edmund Optics 67-572). The silver mirror was placed as close to the 75 mm lens as possible, to operate the grating in a near-Littrow condition for efficiency. After the telescope, excitation light entering the microscope was collimated by a tube lens (Zeiss 425308-0000-000), reflected off a 1200 nm short-pass dichroic mirror (Edmund Optics 86-699) and imaged onto the sample through the × 25 1.0 NA near-IR microscope objective (Olympus XLPN25XSVMP) mounted on a 400-μm travel focusing drive (Piezosystem Jena MIPOS 500 SG). The median axial full-width half-maximum (FWHM) was found to be ~3.0 μm ( Supplementary Fig. 2 ). The two-photon excitation path was very similar; light from the regenerative amplifier was expanded using a × 5 Galilean cylindrical telescope constructed from a -15 mm focal length lens (Thor Labs, LK1006L1-B) and 75 mm focal length lens (Edmund Optics, 69-762). The beam struck a grating (Richardson Gratings, 53006BK02-540R) at an angle of 74°, such that the -1 order diffracted beam propagated along the microscope’s optical axis. The beam was demagnified using a × 1.75 telescope before being imaged onto the intermediate image plane as before; this telescope consisted of a 3″ diameter 190 mm focal length compound lens made from two singlets (Edmund Optics 86-920 and Newport KPX232AR.16), and the same 30 mm diameter 50 mm focal length lens used for three-photon excitation. Other than a change of filter cube to a 750 nm dichroic (Semrock, FF750-SDi02-25 × 36) and 775 nm short-pass emission filter (Semrock, FF01-775/SP-25), the microscope was identical to the three-photon configuration. The median axial FWHM was found to be ~18 μm ( Supplementary Fig. 3 ). For imaging experiments, fluorescence emission passed through the objective, dichroic, emission filter (1200 nm short pass, Edmund Optics 86-693) and microscope tube lens, before being detected on an EMCCD camera (Andor iXon 885k). The optical layout can be seen in Supplementary Fig. 1 . For the HeLa cells, the imaging parameters were 10 s integration time, × 100 EM gain on the EMCCD, 80 mW incident power and × 5 beam expander. Flat-field correction was applied to reduce the effect of non-uniform excitation. To determine the power scaling, pure QD samples were imaged with varying excitation intensities (controlled by a tilted coverslip to minimize dispersion). Images were captured on the camera with a 1 s integration time for the 525 nm QDs, and 0.1 s for the 605 nm QDs. The excitation region was cropped, the background subtracted and the average fluorescence intensity plotted as a function of incident power. For electrophysiology experiments, a Faraday cage was built around microscope, and an illumination system constructed, consisting of a red (Thor Labs M660L3, 660 nm center wavelength) and blue (Thor Labs M470L2, 470 nm center wavelength) LED combined using a dichroic mirror (make and model unknown; taken from a Green Fluorescent Protein filter cube) and focused onto the sample using a microscope objective (Olympus PlanN × 10/0.25). The red LED was used to locate the cells by bright-field illumination without triggering an action potential, and the blue LED was used to both excite fluorescence (in order to locate cells with high expression of CoChR) and to excite an action potential when necessary. Incident power required to excite an action potential was found to be between ~0.13 and 1.8 mW mm −2 . For experiments establishing the maximum achievable frequency due to one-photon absorption, the intensity was optimized until the highest frequency could be achieved; these are the data reported. To investigate the primary damage mechanism, the focal plane was placed ~180 μm from the cell surface (equal to one turn of the coarse focus knob on the microscope). Maximum laser power was used to ensure operation well above the damage threshold; this power averaged 720 mW at 1300 nm, corresponding to ~144 mW at the sample. The lowest power used was 640 mW, corresponding to ~128 mW at the sample. Four exposures of 300 ms were used as before, in addition to one exposure of 3 s. Penetration depth in fixed slices An epifluorescence microscope was constructed above the sample stage of the previously described three-photon instrument, consisting of an objective (Zeiss 421452-9880-000), tube lens (Thor Labs AC508-150-A-ML) and camera (PCO Edge 5.5). A dichroic mirror (make and model unknown; taken from a Green Fluorescent Protein filter cube) in the beam path reflected light from a 470 nm LED (Thor Labs M470L2) onto the sample to aid in locating the sample plane. Animal experiments were conducted in accordance with approved institutional protocols of MIT and MGH. Brain slices were obtained from a male C57BL/6J mouse; it was anesthetized and the tissues were fixed with 4% paraformaldehyde through cardiac perfusion. The fixed brain was extracted and kept in 4% paraformaldehyde, followed by embedding in low-melting agarose. It was then sliced to varying thicknesses using a vibratome (Leica VT1000S). The slices were placed in the well of a glass-bottomed dish (MatTek P50G-0-14-F) and covered with distilled water. A 4 μL drop of QDs suspended in water (525 nm emitting nanocrystals provided by QD Vision) was placed on a 30 mm diameter coverslip and allowed to dry; this coverslip was then placed on top of the brain slice with the QDs on the inside, the excess water wiped away and the coverslip sealed using clear nail varnish. The sample was mounted on the three-photon instrument, and the upper ‘imaging’ microscope brought into focus. The lower ‘excitation’ microscope was also focussed on an unobscured region of the QDs, to ensure the two microscopes were co-aligned. A 20 lp mm −1 Ronchi ruling (Edmund Optics 58-777) was placed at the image plane of the excitation microscope; the pattern projected onto the sample had a period of 2.2 μm. The brain slice was then translated towards the illumination region until the fluorescence from the QDs was not observable on the excitation microscope, even with 1 s exposure and × 10 electron multiplying gain. For thinner samples, green fluorescence was observable even when the brain slice completely overlapped the excitation region; in these cases, the brain slice was translated until it filled the field of view of the camera. Finally, the excitation light was refocused to maximize signal in the imaging microscope. For comparison with two-photon excitation, 6 W of average power was available at 800 nm, so a larger area was illuminated. Total power at the sample was 50 mW with an illuminated area of ~600 μm × 600 μm, however the increased cross-section of two-photon excitation relative to three-photon excitation resulted in similar emission intensities in the absence of scattering. Excitation was performed by routing light from the regenerative amplifier through a separate beam path described above. Imaging was performed with a 2 s integration time on the sCMOS camera; to compensate for vibration in the imaging microscope setup (an unavoidable consequence of having to mount the microscope so far above the table surface) 16 frames were captured and the frame exhibiting the least vibration-induced blurring was taken.
Electrophysiology
All procedures involving animals were in accordance with the US National Institutes of Health Guide for the Care and Use of Laboratory Animals and approved by the MIT Committee on Animal Care. Hippocampal neuron cultures were prepared from postnatal day 0 or 1 Swiss Webster (Taconic) mice as previously described 17 , 18 but with the following modifications: dissected hippocampal tissue was digested with 50 units of papain (Worthington Biochem) for 6–8 min, and the digestion was stopped with ovomucoid trypsin inhibitor (Worthington Biochem). Cells were plated at a density of 20,000–50,000 per glass coverslip coated with Matrigel (BD Biosciences). Neurons were seeded in 100 μL Plating Medium containing MEM (Life Technologies), glucose (33 mM, Sigma), transferrin (0.01%, Sigma), Hepes (10 mM), Glutagro (2 mM, Corning), Insulin (0.13%, Millipore), B27 supplement (2%, Gibco), heat inactivated fetal bovine serum (7.5%, Corning). After cell adhesion, additional Plating Medium was added. AraC (0.002 mM, Sigma) was added when glia density was 50–70%. Neurons were grown at 37 °C and 5% CO 2 in a humidified atmosphere. Cultured neurons were induced at 4 days in vitro (DIV) with 1.0 μL of rAAV2/8-Synapsin-CoChR-GFP (titer: 3.8 × 10 12 particles per mL) per well. AAV particles were produced by the University of North Carolina Chapel Hill Vector Core. Coverslips supporting the prepared neuronal cultures were mounted on glass-bottomed dishes (MatTek P50G-0-14-F) at 14-20 DIV and immersed in Tyrode solution containing 125 mM NaCl, 2 mM KCl, 3 mM CaCl 2 , 1 mM MgCl 2 , 10 mM HEPES, 30 mM glucose, 0.01 mM NBQX and 0.01 mM GABAzine. The pH was 7.3. Patch clamping was performed using a micromanipulator system (Sutter Instruments MP285 micromanipulator, MPC-200 controller and Axon Instruments CV-7B headstage). Signals from the headstage were recorded using an amplifier (Molecular Devices MultiClamp 700B) and data acquisition system (Molecular Devices Digidata 1440a), controlled using pCLAMP 10 software. Exposure was controlled by the shutter, which was controlled in turn by TTL input from the data acquisition system. Patching was performed using borosilicate glass pipettes (Warner Instruments) with an outer diameter of 1.2 mm and a wall thickness of 0.255 mm. These were pulled to a resistance of 5–10 MΩ with a P-97 Flaming/Brown micropipette puller (Sutter Instruments) and filled with a solution containing 135 mM K-gluconate, 8 mM NaCl, 0.1 mM CaCl 2 , 0.6 mM MgCl 2 , 1 mM EGTA, 10 mM HEPES, 4 mM Mg-ATP, and 0.4 mM Na-GTP, and with pH 7.3 and 290 mOsm. To ensure accurate measurements, cells were used with access resistance between 5 and 35 MΩ. Before all experiments, the holding current was adjusted such that the measured potential was between −60 and −65 mV; holding currents were within ±100 pA in all cases. In some cases a 60 Hz signal was present in the data; this was computationally removed from the presented data by fitting a 60 Hz sine wave and subtracting the fit.
Supplementary Material Supplementary Information Click here for additional data file. Supplementary Video 1 Click here for additional data file. Supplementary Video 2 Click here for additional data file.
📊 Figures
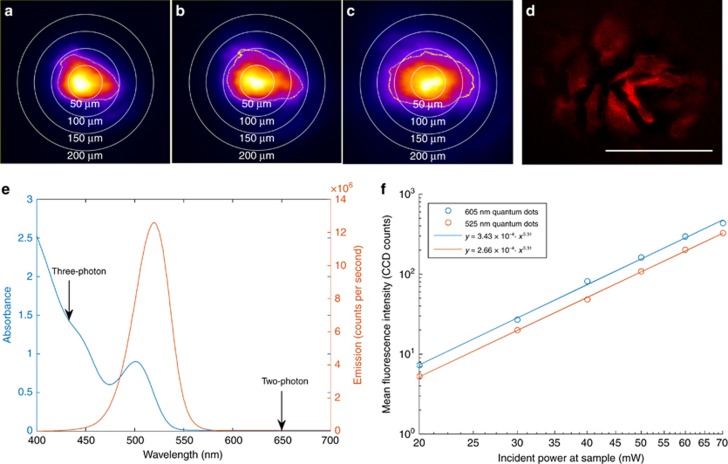
Figure 1
Demonstration of wide-field three-photon excitation at 1300u2009nm. ( a u2013 c ) Effect of increasing spot size. Sample consists of a drop of quantum dots on a glass microscope slide. Color scale is ...
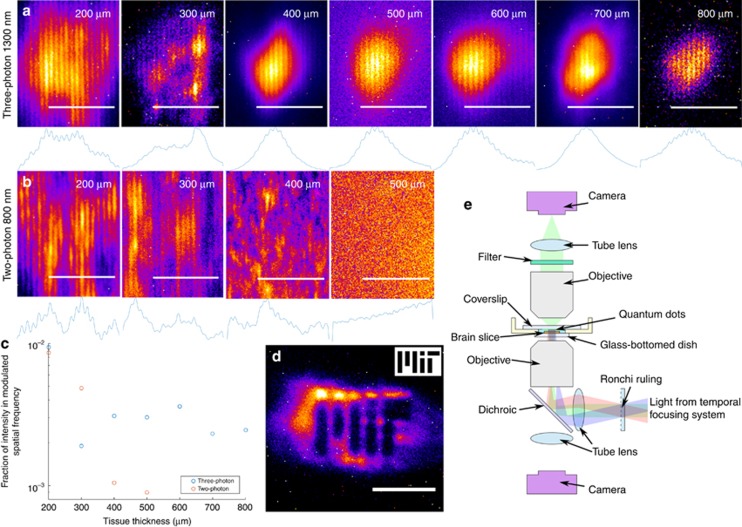
Figure 2
Establishing the achievable penetration depth into fixed brain tissue. ( a ) Three-photon excitation at 1300u2009nm through fixed tissue slices from 200 to 800u2009u03bcm, with a u00d7 2.5 beam expand...
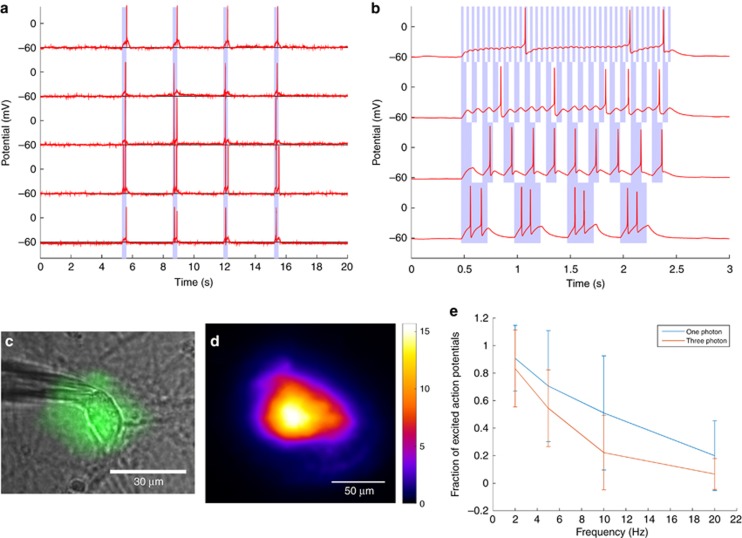
Figure 3
Three-photon optogenetic excitation at 1300u2009nm. ( a ) Representative examples of cultured neurons excited by three-photon excitation. The duration of exposure is indicated by the shaded area. ( b ...
Figure images are served from the NIH/NLM PubMed Central Open Access Subset or Europe PMC; copyright remains with the publishers and authors.
💬 Discussion
0 commentsNo comments yet. Be the first to start a discussion!
Leave a Comment