Abstract
The peptidoglycan (PG) cell wall is a peptide cross-linked glycan polymer essential for bacterial division and maintenance of cell shape and hydrostatic pressure. Bacteria in the Chlamydiales were long thought to lack PG until recent advances in PG labeling technologies revealed the presence of this critical cell wall component in Chlamydia trachomatis. In this study, we utilize bio-orthogonal D-amino acid dipeptide probes combined with super-resolution microscopy to demonstrate that four pathogenic Chlamydiae species each possess a ≤ 140 nm wide PG ring limited to the division plane during the replicative phase of their developmental cycles. Assembly of this PG ring is rapid, processive, and linked to the bacterial actin-like protein, MreB. Both MreB polymerization and PG biosynthesis occur only in the intracellular form of pathogenic Chlamydia and are required for cell enlargement, division, and transition between the microbe's developmental forms. Our kinetic, molecular, and biochemical analyses suggest that the development of this limited, transient, PG ring structure is the result of pathoadaptation by Chlamydia to an intracellular niche within its vertebrate host.
🔬 Techniques
🔭 Microscopes
💻 Software
✨ Fluorophores
🧪 Sample Preparation
🔬 Cell Lines
🏭 Microscope Brands
🧪 Reagent Suppliers
📷 Detectors
🔎 Objectives
💻 Software Details
🏛️ Research Organizations (ROR)
Affiliated research institutions:
📋 Methods
Reagents Clickable dipeptide PG probes
(EDA—DA and ADA—DA) and MreB polymerization inhibitors (A22 and MP265) were synthesized as previously described[ 9 , 49 ]. Alkynyl- and Azide-functionalized Alexa Fluor 488, TAMRA-5-azide, and Click-iT Cell Reaction Buffer Kit were purchased from Invitrogen.
Antibodies against chlamydial
MreB and IncA were generously provided by Scott Hefty (University of Kansas) and Dan Rocky (Oregon State University), respectively. The chlamydial RSGFP-expressing p2TK-SW2 plasmid was generously provided by Isabelle Derré (University of Virginia). Bacterial strains, growth conditions, and quantification of inclusion-forming units (IFUs) C . trachomatis serovar L2 strain 434/Bu was provided by H. Caldwell (Rocky Mountain Laboratories). C . muridarum strains Nigg "M9"[ 68 ], C . psittaci strain 6BC "BCRB"[ 69 ], C . caviae strain GPIC "SP6" [ 70 ] are all clonal lab strains picked and expanded from single plaques. Chlamydial stocks were generated and asynchronous infections were performed as previously described[ 9 ]. Briefly, chlamydial EBs were harvested from infected L2 (mouse fibroblast) cells at 40 hpi and stored at -80°C until use. For infections, tissue culture-treated glass coverslips were placed in 24 well plates (Costar) and L2 cells were plated so as to reach ~70–80% confluence by the day infections were carried out. Cells were washed twice with warm Dulbecco's modified Eagle's medium (DMEM), infected at a multiplicity of infection (MOI) of 1 with bacteria resuspended in DMEM, plates were rocked for two hours at 37°C 5% CO 2 , unbound bacteria were subsequently removed, and medium was replaced with DMEM supplemented with 10% FBS (HyClone), 1 × MEM Non-Essential Amino Acids Solution (Sigma), and 0.2 μg ml −1 cycloheximide (Sigma). Medium was supplemented with native/modified dipeptide molecules, antibiotics, and/or MreB inhibitors as noted in the text. For quantification of the toxicity of MreB-polymerization inhibitors, infections were carried out as described above utilizing the C . trachomatis serovar L2 strain 434/Bu transformed with the p2TK-SW2 plasmid [ 71 ] for the expression of RSGFP. Inhibitors were added at the time points / durations indicated in the text. At either 44 or 52 hpi, 1 ml of sucrose/phosphate glutamate buffer (SPG) was added to each well and cells were collected via scraping with glass beads. Resuspended cells were then subjected to sonication for brief (ten second) pulses, 1:10 dilutions were prepared and were immediately used to infect 96 well monolayers of L2 cells, which were seeded the previous day with 200 μl of 200,000 L2 cells/ml per well. Plates were then spun in an Eppendorf desktop centrifuge at 3000 rpm 35C for 1 hour and then allowed to incubate at 37°C 5% CO 2 for 24 hours. Inclusions were counted in live cells via fluorescence microscopy and IFUs were calculated for each experimental group in biological triplicates.
Show full methods section
Reagents Clickable dipeptide PG probes
(EDA—DA and ADA—DA) and MreB polymerization inhibitors (A22 and MP265) were synthesized as previously described[ 9 , 49 ]. Alkynyl- and Azide-functionalized Alexa Fluor 488, TAMRA-5-azide, and Click-iT Cell Reaction Buffer Kit were purchased from Invitrogen.
Antibodies against chlamydial
MreB and IncA were generously provided by Scott Hefty (University of Kansas) and Dan Rocky (Oregon State University), respectively. The chlamydial RSGFP-expressing p2TK-SW2 plasmid was generously provided by Isabelle Derré (University of Virginia). Bacterial strains, growth conditions, and quantification of inclusion-forming units (IFUs) C . trachomatis serovar L2 strain 434/Bu was provided by H. Caldwell (Rocky Mountain Laboratories). C . muridarum strains Nigg "M9"[ 68 ], C . psittaci strain 6BC "BCRB"[ 69 ], C . caviae strain GPIC "SP6" [ 70 ] are all clonal lab strains picked and expanded from single plaques. Chlamydial stocks were generated and asynchronous infections were performed as previously described[ 9 ]. Briefly, chlamydial EBs were harvested from infected L2 (mouse fibroblast) cells at 40 hpi and stored at -80°C until use. For infections, tissue culture-treated glass coverslips were placed in 24 well plates (Costar) and L2 cells were plated so as to reach ~70–80% confluence by the day infections were carried out. Cells were washed twice with warm Dulbecco's modified Eagle's medium (DMEM), infected at a multiplicity of infection (MOI) of 1 with bacteria resuspended in DMEM, plates were rocked for two hours at 37°C 5% CO 2 , unbound bacteria were subsequently removed, and medium was replaced with DMEM supplemented with 10% FBS (HyClone), 1 × MEM Non-Essential Amino Acids Solution (Sigma), and 0.2 μg ml −1 cycloheximide (Sigma). Medium was supplemented with native/modified dipeptide molecules, antibiotics, and/or MreB inhibitors as noted in the text. For quantification of the toxicity of MreB-polymerization inhibitors, infections were carried out as described above utilizing the C . trachomatis serovar L2 strain 434/Bu transformed with the p2TK-SW2 plasmid [ 71 ] for the expression of RSGFP. Inhibitors were added at the time points / durations indicated in the text. At either 44 or 52 hpi, 1 ml of sucrose/phosphate glutamate buffer (SPG) was added to each well and cells were collected via scraping with glass beads. Resuspended cells were then subjected to sonication for brief (ten second) pulses, 1:10 dilutions were prepared and were immediately used to infect 96 well monolayers of L2 cells, which were seeded the previous day with 200 μl of 200,000 L2 cells/ml per well. Plates were then spun in an Eppendorf desktop centrifuge at 3000 rpm 35C for 1 hour and then allowed to incubate at 37°C 5% CO 2 for 24 hours. Inclusions were counted in live cells via fluorescence microscopy and IFUs were calculated for each experimental group in biological triplicates.
Labeling of chlamydial PG
Experiments in which chlamydial PG was labeled with incorporated, clickable dipeptide probes (DAADs) were carried out as described previously[ 9 ]. Briefly, at designated time points post infection, treated coverslips containing Chlamydia -infected cells were washed first in warm DMEM, then with PBS, and fixed/ permeabilized with methanol for five minutes. Cells were then washed with PBS, further permeabilized with 0.5% Triton X for five minutes, and washed a final time with PBS. Coverslips were then blocked with 3% BSA (in PBS) and the click chemistry reaction was carried out utilizing the Click-iT Cell Reaction Buffer Kit (Invitrogen) with appropriate azide-modified fluorophores (Alexa fluor 488/647 and TAMRA-5). The addition of copper (cupric sulfate) results in the alkyne group on the dipeptide probe and the azide group on the fluorophore forming a stable triazole conjugate, thereby fluorescently labeling the PG in which the probe has been incorporated. Where indicated, chlamydial major outer membrane protein (MOMP) was labeled with anti-MOMP antibody (LifeSpan Biosciences, 1:500), chlamydial inclusions were labeled with anti-IncA antibody ([ 72 ], 1:500) and chlamydial MreB was labeled with anti-chlamydial MreB diluted 1:1,000. Alexa fluor-conjugated anti-mouse, anti-goat, and anti-rabbit secondary antibodies (Invitrogen) were diluted 1:2,000. Pulse chase experiments L2 cells were infected with C . trachomatis serovar L2 strain 434/Bu for 16 hours. Infection medium was then removed, cells were washed once with pre-warmed DMEM, and new infection medium was added containing 4 mM EDA—DA (pulse). After one hour, medium was removed, cells were washed twice with pre-warmed DMEM, and new medium was added containing a second probe, small molecule inhibitor, or neither (chase). Cells were fixed, permeabilized at indicated time points, and labeling of chlamydial PG and MOMP was conducted, as described previously. For the pulse-chase experiment conducted in Fig 8 , a similar principle was followed, but with the following differences. After a 2 h EDA—DA (4 mM) pulse, cells were washed and incubated in fresh medium containing MP265 (125 μM) for an additional 1 h (1 st Chase). At this point the cells were washed again and new medium (that lacked both EDA—DA or MP265) was added containing either antibiotics, D-Ala—D-Ala, or neither (2 nd Chase).
Imaging and analysis
All confocal imaging was conducted with a Zeiss 710 laser scanning microscope utilizing Zen 2012 (Carl Zeiss) software and all epifluorescence imaging was conducted by a Nikon Ti-E inverted fluorescence microscope equipped with a Plan Apo 60x/1.40 Oil Ph3 DM objective and a DAPI/GFP/Cy3/Cy5 filter cube and an Andor DU885 EMCCD camera. Settings were fixed at the beginning of image acquisition and for experiments in which different samples/time points were to be compared, the same parameters were applied for collecting and post processing all images taken. Deconvolution and maximum intensity projection (when used) was conducted utilizing AxioVision (Carl Zeiss) software employing the inverse filter setting or ImageJ, respectively. ImageJ was used for all subsequent image analysis. For generating the data presented for the kinetic analysis of the average fluorescence of chlamydial inclusions, confocal Z-stacks were taken using the 40x objective and maximum intensity projections were generated from those stacks and pixels assigned a brightness level between 0 and 255. Basic intensity quantification was conducted by using the MOMP-labeling (red) channel to define the area which encompassed individual inclusions, and this was then used as an overlay to subsequently quantify the level of fluorescence present within each inclusion area present within the EDA—DA (green) channel. 3D SIM super-resolution microscopy was performed on a Delta Vision OMX microscope equipped with an Olympus 100X/1.40 Oil PSF objective and a Photometrics Cascade II EMCCD camera. The samples were excited with lasers at 405 nm, 488 nm, 561 nm, 642 nm and the emission was detected through 419 nm -465 nm, 500 nm -550 nm, 609 nm -654 nm, 665 nm -705 nm emission filters. The image processing was conducted by SoftWorx imaging software. Further image analysis was conducted via ImageJ including the measurements of PG ring widths. For PG width measurements, rings that were aligned perpendicular to the x,y axis (for the maximum resolution) were used.
SIM imaging
Z stacks of chlamydial inclusions were obtained via a Zeiss ELYRA PS.1 utilizing Zen 2012 (Carl Zeiss) software for image processing.
Chlamydial muropeptide isolation
Muropeptide fragments of PG were isolated from Chlamydia -infected cells as previously described [ 50 ]. Two 175 cm 2 flasks of confluent HeLa cells were either infected with C . trachomatis L2/434 at an MOI of 1 or mock infected and incubated for two hours at 37°C in 5% CO 2 with rocking. Infection medium was then removed and replaced with DMEM with heat inactivated fetal bovine serum (10%), and cells incubated for an additional 16 hours. Medium was then removed and replaced with fresh DMEM (10% FBS) with or without 75 μM compound A22 and cells were then allowed to incubate an additional two hours. Medium was removed, cells were washed once with warm DMEM (to remove any residual A22) and then cells were harvested using glass beads, resuspended in DMEM, and sonicated at 40 amps with one-minute pulses, repeated five times. Supernatants were centrifuged at 4,000 g for five minutes to remove cellular debris, lysates were passed through a 0.22 μm filter, and then 3 kDa centrifugal filters (Amicon UFC900324) at 4000 x g for one hour at 37°C. Flow-through fractions from the 3 kDa centrifugal filters were then heat inactivated at 95°C for six minutes and assayed for activity in an HEK NOD reporter cell line (see below). NOD1 / NOD2 NF-κB reporter assay The NOD signaling assay was conducted on lysates of Chlamydia -infected cells as previously described. Briefly, HEK cells overexpressing either the NOD1 or NOD2 receptors, as well as the NF-κB-SEAP reporter gene (Invivogen, CA), were used to quantify the immunostimulatory potential from cell lysate fractions taken from a reverse phase C18 HPLC column. Twenty μl of cell lysate fractions from mock-infected and Chlamydia -infected cells (in the presence or absence of compound A22) were added to ~5 x 10 4 HEK-Blue NOD1 or NOD2 cells in 96 well plates (total reaction volume 200 μl/well) and incubated for 24 hrs at 37°C. Secreted alkaline phosphatase (SEAP) was measured by adding 20 μl of the supernatant from lysate fraction-treated wells to 180 μl of QUANTI-blue substrate (Invivogen) in a separate 96 well microtiter plate. Untreated or uninfected cell supernatants were used as negative controls. The reaction was incubated at 37°C for 30 min and SEAP activity was assessed by reading OD at 650 nm.
PG analysis
HPLC was carried out on filtered, Chlamydia -infected cell lysates (and controls) as previously described [ 50 ]. LCMS experiments were performed on an Agilent 1200 Series liquid chromatography system coupled to an AB Sciex Q-Trap 4000 mass spectrometer with a Turbo V electrospray ionization source, as previously described [ 50 ]. Data from control/experimental groups was analyzed and overlaid using Analyst Software (v1.5.1) with all experiments and subsequent analysis conducted at least twice.
Supporting Information S1 Fig Analysis of chlamydial inclusion fluorescence. Epifluorescence (EPI) images of exponential Staphylococcus aureus cells incubated for 2 h with 0.5 mM EDA—DA (shown as a control for labeling for PG-labeled Chlamydia in Figs 2 and 3 ). Scale bar = 1 μm. (TIF) Click here for additional data file. S2 Fig Single, 2D Z stacks are superior to 3D SIM projections in establishing individual cell boundaries of Chlamydia RBs closely packed within inclusions. Visualization of PG (green) and MOMP (red) for a chlamydial inclusion 18 hpi, as viewed by either individual 2D Z stacks or the rendered 3D projection. All stacks are visualized in S1 Video . (TIF) Click here for additional data file.
S3 Fig Individual imaging planes from SIM
Z stacks allow for visualization of defined cell boundaries and confirms chlamydial PG localized to the division septum in actively dividing RBs. Single imaging planes of C . trachomatis infected cells incubated with 4 mM EDA-DA at 2 hpi and fixed at 18 hpi. Arrows indicate areas of punctate PG staining or polar disk formation. Instances of multiple or asymmetric PG ring localization are marked with arrowheads. MOMP and PG labeling is the same as in Fig 2 . Images are representative of 30 inclusions analyzed. Scale bar = 1 μm. Panels d and f are separate imaging planes of the same inclusions. All stacks for panels d, f, and e and are visualized in S2 and S3 Videos. (TIF) Click here for additional data file. S4 Fig Analysis of chlamydial inclusion fluorescence. (a) Data from a quantitative analysis of average fluorescence pixel intensities (presented in Fig 5b and 5c ) were re-plotted against inclusion size (area) for both PG and MOMP labeling channels. (b) Inclusion area (as measured by MOMP-labeled surface area) is graphed for all groups presented in Fig 5b and 5c . (c) Comparison of the average inclusion pixel fluorescence intensity values from an untreated control group (no EDA—DA added) and inclusions grown in medium containing 4 mM EDA—DA for either one or five hours. Error bars represent standard deviation of the mean. (TIF) Click here for additional data file. S5 Fig Effects of polymerization inhibitors on MreB localization. (a) Chlamydial EBs were allowed to differentiate into RBs, mature for 18 hours in the presence or absence of D-cycloserine and then subjected to treatment with MreB polymerization inhibitor A22 for one hour. Scale bars = 1 and 3 μm, respectively. (b) SIM of MreB and PG labeling (EDA-DA) for EBs (arrowhead) and RBs (larger cells on the left) at 18 hpi. Scale bar = 1 μm. (TIF) Click here for additional data file. S6 Fig Short pulse EDA-DA labeling results in patchy PG localization that partially co-localizes to MreB patches. (a) Maximum intensity projection of EDA—DA signal within chlamydial inclusions (18 hpi) incubated five min with 4 mM EDA—DA. A RB with only a partially labeled PG ring is denoted by red arrowhead. Scale bar = 1 μm. (b) SIM of EDA—DA labeled PG (green) and MreB (red) within chlamydial inclusions (18 hpi) incubated with 4 mM EDA—DA for 5 minutes. Yellow arrowheads indicate areas of co-localization and white arrowheads denote the localization of MreB patches complementary to newly-forming PG arcs. Scale bars = 1 μm. (TIF) Click here for additional data file. S7 Fig Mass spec analysis of the effects of MreB inhibition on chlamydial PG muropeptide abundance. ( a ) NOD2 signaling analysis of Chlamydia -infected cell lysates grown in the presence/absence of MreB inhibitor A22 (75 μM) for two hours. Signaling assays were conducted in quadruplicate and results are representative of two independent experiments. Error bars represent standard deviation of the mean. (b) Comparison of extracted ion current (XIC) of 477.2 m/z (muramyl dipeptide fragment at Rt of 8.4 min) between infected, untreated (red line) and infected, A22-treated (blue line) NOD2-activating fractions. Image is representative of three separate analyses conducted on three separate biological replicates. The increase in the intensity of ion 477.2 m/z observed in A22-treated cell lysates over untreated infected lysates was quantitated by calculating the area under the respective peaks and is shown in the table (c). (c) The intensities of muropeptide ions 477.2m/z, 653.2 m/z, 494.2 m/z and 666.2 m/z (Rt 8.4, 9.4, 7.5 and 8.1 min respectively) were quantitated from the XIC of infected A22-treated and untreated lysates and the data are presented in the upper half of the table. The effects of DCS treatment on the intensity of the same four muropeptide ions are presented in the lower half of the table. (d) Breakdown products produced from the 477.2 m/z ion when subjected to MS/MS. The resulting spectra correspond to the known (partial) structure of muramyl dipeptide ( MDP) from C . trachomatis [ 50 ]. (TIF) Click here for additional data file. S8 Fig Chlamydial MreB is essential for the EB-RB transition, inclusion maturation and growth. (a) Inclusion sizes (at 24 hpi) as measured by MOMP-labeling subsequent to the addition of A22 at various time points post-infection. (b) Quantitative analysis of the distribution of size of all intracellular Chlamydia distinguished by MOMP labeling 24 hpi comparing cells either untreated or treated with MreB-inhibitors MP265 or A22 at 2 hpi, which were then either left on or removed 10 hpi. (c) Maximum intensity projection of MOMP (red) and DAPI (blue) of chlamydial inclusions (18 hpi) grown in the presence of A22 (added 2 hpi). (d) Recovered inclusion forming units (IFUs) representing viable EBs collected (at either 44 hpi or 52 hpi, as indicated) after treatment with MreB polymerization inhibitors. Inhibitors were added (and removed) at specific time points throughout the chlamydial developmental cycle for the indicated durations. Each toxicity assay was conducted in triplicate, error bars represent standard deviation of the mean, and data are representative of two independent biological replicates. UTD; untreated control. (e) Chlamydial inclusions (24 hpi) allowed to develop in the presence/absence of A22 or DCS and labeled with anti- CT IncA antibody (green), anti- CT MOMP (red), and DAPI (blue). All images are maximum intensity projections of confocal Z-stacks, and are representative of over 30 inclusions viewed by confocal microscopy (and >100 viewed by epifluorescence microscopy). Each study spanned two independent experiments. (f) Chlamydial inclusions 22 hpi. Cells were either left untreated (upper panel) or treated with the MreB inhibitor A22 at 2 hpi, which was then either left in (middle) or removed 10 hpi (lower panel). Labels are described in panel captions. Scale bar = 1 μm. (TIF) Click here for additional data file. S9 Fig Effects of β-lactams and D-cycloserine on chlamydial MreB and PG. Maximum intensity projections of chlamydial inclusions that have been incubated with ampicillin (a) or piperacillin (b) and labeled with EDA-DA for 1 hour. (c) EPI maximum intensity projections of ampicillin-induced aberrant bodies pulsed with EDA—DA for one hour prior to fixation and staining for EDA—DA (upper panel) and after additional 2 h treatment with 200 μg lysozyme ml −1 (lower panel). (d) Maximum intensity projections of chlamydial aberrant bodies (induced by adding ampicillin to the growth medium at 2 hpi) grown in the presence of 4 mM EDA—DA for one hour prior to fixation and staining for MreB. (e) Chlamydial aberrant bodies (induced by adding DCS to the medium at 2 hpi) labeled for MreB. Labels are described in panel captions. (e) Scale bars: a = 5 μm. b-f = 1 μm. (TIF) Click here for additional data file. S10 Fig Increase in inclusion size does not account for changes in PG labeling intensity. (a) Schematic representation of the homogenous vs. bidirectional removal of the older PG. In contrast to the homogeneous degradation of PG about the entire ring, the bidirectional model predicts splitting of the older ring (green) into two with new PG (pink) being inserted in the middle. (b-c) Inclusion area (as measured by MOMP labeling) graphed for all groups and PG (black) / MOMP (red) labeling re-plotted against inclusion size. Inclusion size was measured to ensure that changes in fluorescence intensity were not simply attributable to inclusion growth over time. The total inclusion size trended upward three hours after the initial DAAD pulse (two hours after the beginning of the chase portion of the experiment ( b )), however, this did not appear to affect average fluorescence intensities within any given experimental group ( c ). (TIF) Click here for additional data file. S11 Fig Limitations of clickable dipeptide probes for use in kinetic studies. (a) Pulse chase experiments in Chlamydia with competitive, native dipeptide (DA—DA) supplemented into fresh medium and added to clickable, EDA—DA labeled inclusions. The inclusions that are sequentially pulsed with EDA—DA and DA-DA in order to show the effect that lengthy exposures to native DA-DA pools has on the loss of EDA—DA signal over time. (b) The same pulse chase experiment presented in panel a , but carried out over one hour and comparing the effects of exogenously added ADA-DA on loss of EDA-DA fluorescence. The addition of ADA—DA results in a drastic decrease in EDA—DA signal, most likely because incorporated azide containing ADA—DA outcompetes the Alexa Fluor 488 azide during the click chemistry reaction, i.e. most of the EDA—DA labeled PG is captured by ADA—DA labeled PG instead of the Alexa Fluor 488 that is used for the read-out of the EDA—DA labeled PG. For both experiments, average fluorescence values were calculated for each treatment group at the indicated time points, subsequent to chases. Each bar represents the average fluorescent pixel intensities of ~150 chlamydial inclusions pooled from two independent experiments. Error bars represent the standard deviation of the mean for each sample group. Chlamydia PG and MOMP were labeled as described in Fig 2 . (TIF) Click here for additional data file.
S1 Video SIM
Z-stacks (presented as single imaging planes in S2 Fig ) of Chlamydia inclusions 18 hpi taken via Zeiss ELYRA PS.1. PG is labeled in green and MOMP in red. Movies begin with 3D-rendered projections of each Z stack rotated about the X or Y axis followed immediately by the presentation of each individual imaging plane successively through the Z stack of the inclusion. Single channels are presented first and followed by a merged compilation of the two. (WMV) Click here for additional data file.
S2 Video SIM
Z-stacks (presented as single imaging planes in S3d and S3f Fig ) of Chlamydia inclusions 18 hpi taken via Zeiss ELYRA PS.1. PG is labeled in green and MOMP in red. Movies begin with 3D-rendered projections of each Z stack rotated about the X or Y axis followed immediately by the presentation of each individual imaging plane successively through the Z stack of the inclusion. Single channels are presented first and followed by a merged compilation of the two. (WMV) Click here for additional data file.
S3 Video SIM
Z-stacks (presented as single imaging planes in S3e Fig ) of Chlamydia inclusions 18 hpi taken via Zeiss ELYRA PS.1. PG is labeled in green and MOMP in red. Individual imaging planes are presented successively through the Z stack of the inclusion. Single channels are presented first and followed by a merged compilation of the two. (WMV) Click here for additional data file.
S4 Video SIM
Z-stacks of Chlamydia inclusions 18 hpi taken via Zeiss ELYRA PS.1. PG is labeled in green and MOMP in red. Movies begin with 3D-rendered projections of each Z stack rotated about the X or Y axis followed immediately by the presentation of each individual imaging plane successively through the Z stack of the inclusion. Single channels are presented first and followed by a merged compilation of the two. (WMV) Click here for additional data file.
📊 Figures
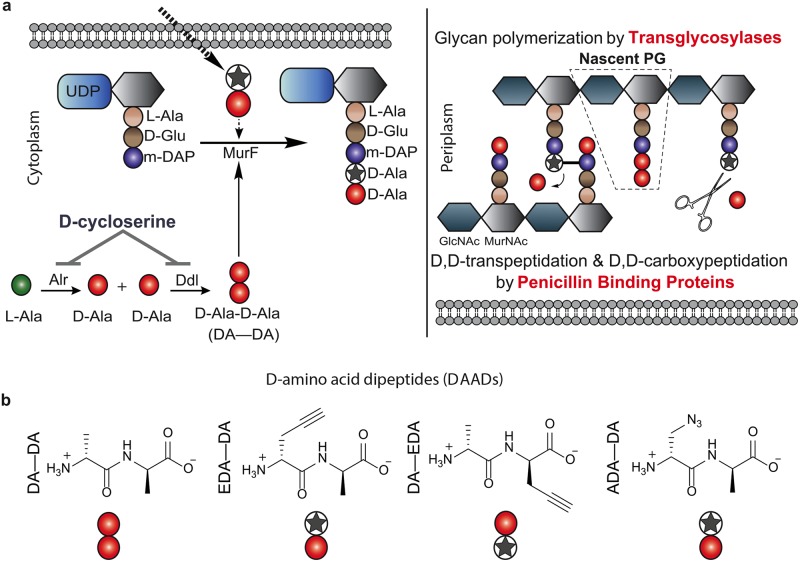
Fig 1
Relevant steps of PG biosynthesis and D-amino acid dipeptide (DAAD) probes used in this study.
( a ) DAADs are taken up by bacteria where they compete with endogenous D-Ala-D-Ala (DAu2014DA) for incorporation into PG. De novo synthesis of DAu2014DA is inhibited by D-cyloserine. The pentapeptide...
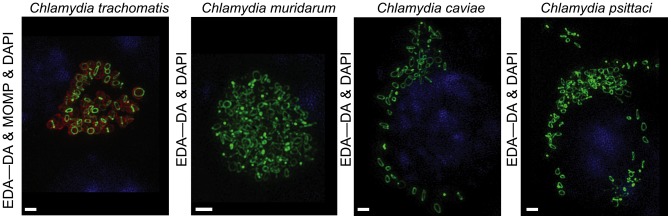
Fig 2
Structured illumination microscopy of DAAD PG labeling in pathogenic Chlamydia .
Structured illumination microscopy (SIM) was conducted on four pathogenic Chlamydia species. EDA-DA was added 2 hours post infection (hpi) and coverslips were fixed at 18 hpi. PG labeling (represented...
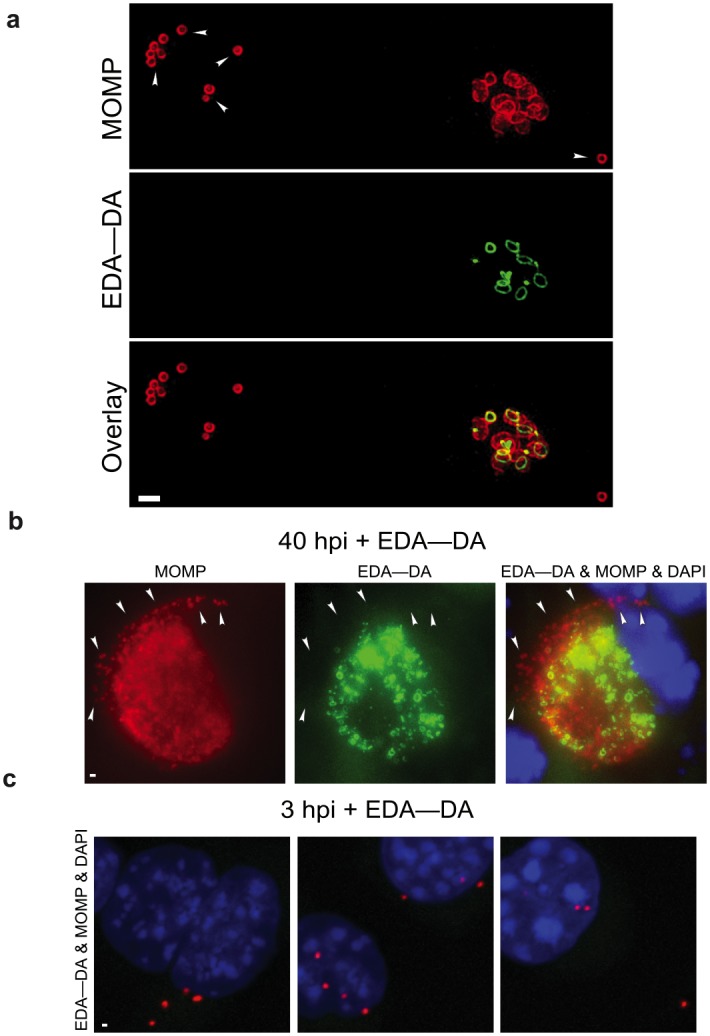
Fig 3
Chlamydial EBs do not retain PG labeling.
(a) SIM of EDAu2014DA labeled C . trachomatis inclusions at 22 hpi. Arrowheads indicate locations of EBs. Tissue culture cells were infected with C . trachomatis and placed on a rocker for 2 hours, en...
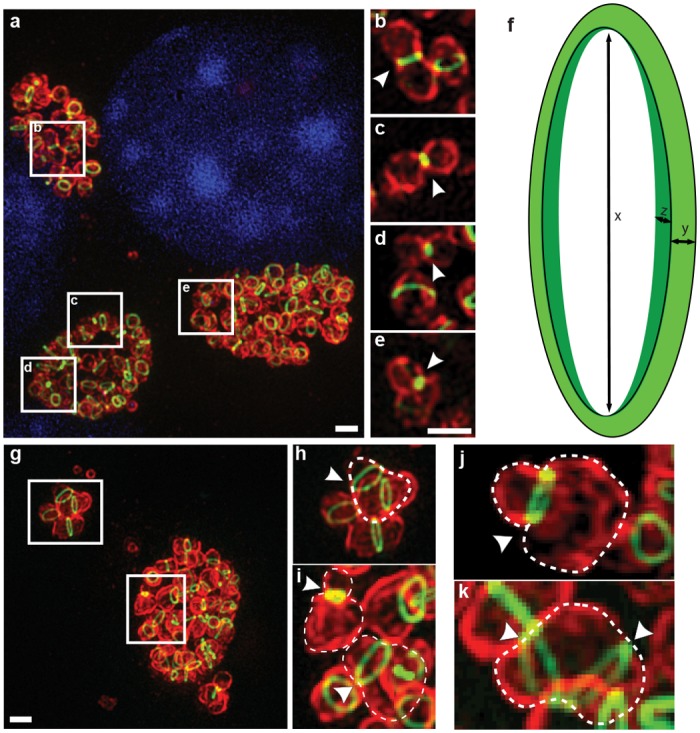
Fig 4
3D SIM visualization of labeled chlamydial PG.
(a-e) Maximum intensity projection (7 u03bcm thick Z stack) of C . trachomatis incubated with 4 mM EDA-DA at 2 hpi and fixed at 18 hpi. Panels ( b-e) are maximum intensity projections of 0.5 u03bcm th...
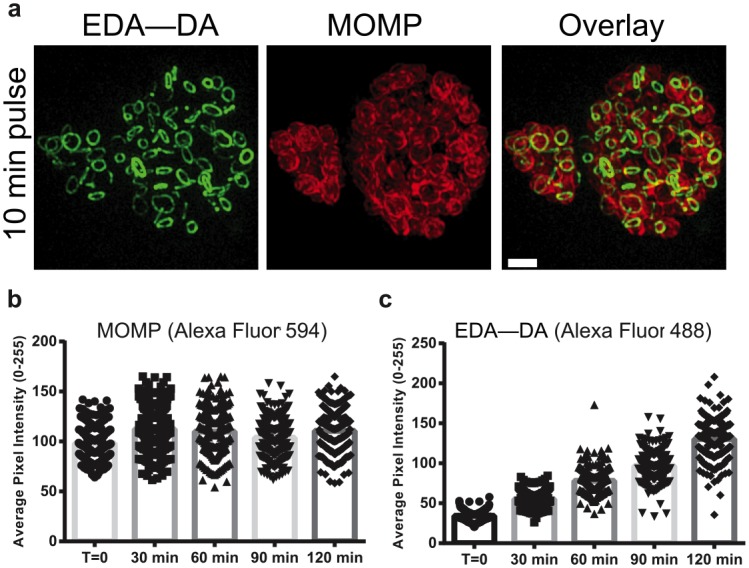
Fig 5
C . trachomatis incorporates DAADs rapidly during exponential growth.
(a) SIM of chlamydial inclusions (18 hpi) incubated for 10 min with 4 mM EDAu2014DA. Z-stacks from chlamydial inclusions (18 hpi) incubated with EDAu2014DA were collected, maximum intensity projection...
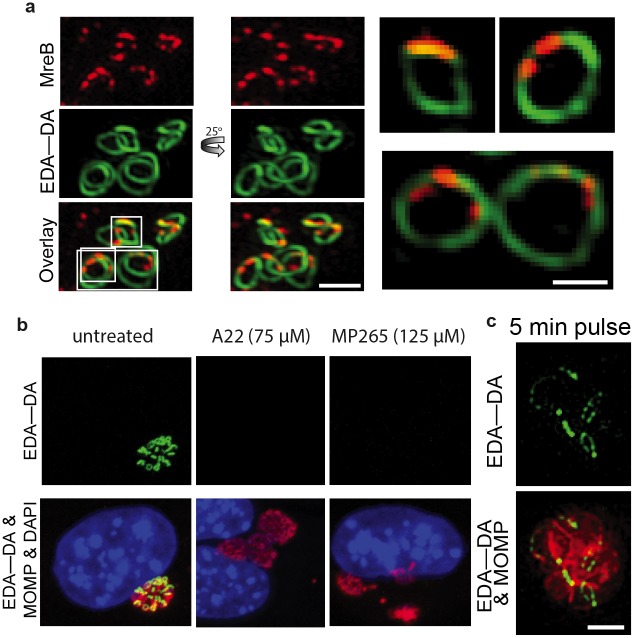
Fig 6
Chlamydial MreB is patchy, co-localizes to PG rings, and is required for chlamydial PG synthesis.
(a) SIM of chlamydial PG localization in relation to polymerized MreB in inclusions 18 hpi incubated with EDAu2014DA for one hour. Right-most panels are magnifications of single imaging planes from a ...
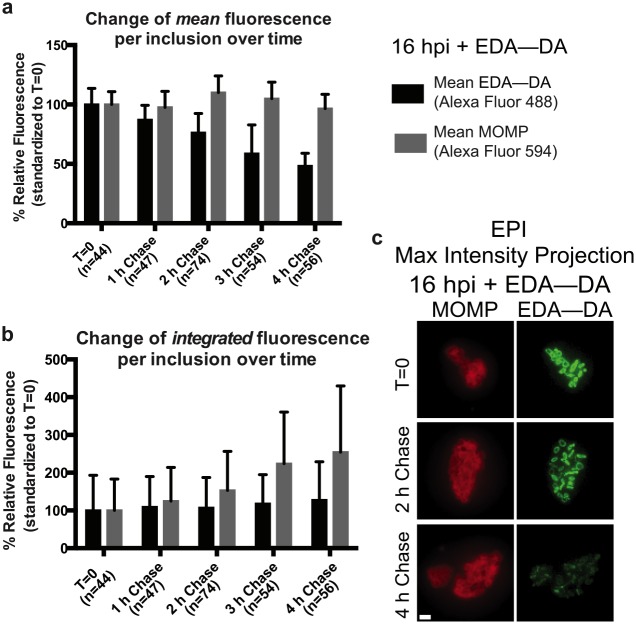
Fig 7
Pulse-chase experiments establish preliminary kinetics of PG disassembly in chlamydial RBs.
Change in mean fluorescence (a) and integrated fluorescence (b) per inclusion over time from chlamydial inclusions pulsed 1 h with EDAu2014DA after which the medium was removed and replaced with probe...
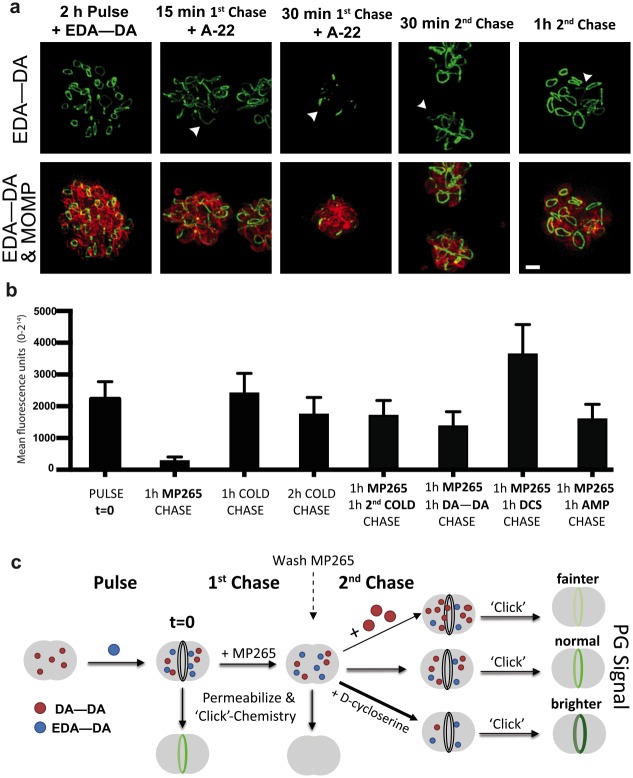
Fig 8
(a) SIM of chlamydial inclusions in which cells were pulsed for two hours with 4 mM EDAu2014DA, after which the MreB polymerization inhibitor A22 (75 u03bcM) was added to the medium. In the two far-ri...
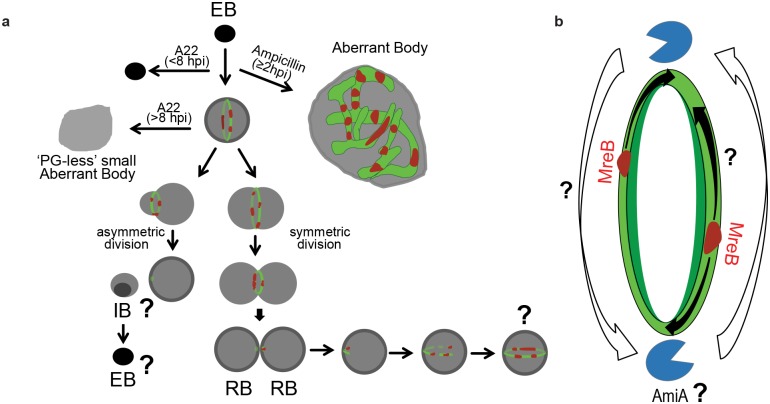
Fig 9
Proposed model for PG biosynthesis and maintenance in pathogenic Chlamydia .
(a) Upon invading a host cell, MreB facilitates mid-cell PG (green) ring formation 8 hpi and the first cell division occurs. Inhibition of MreB (red) prior to EB-RB transition prevents this first divi...
Figure images are served from the NIH/NLM PubMed Central Open Access Subset or Europe PMC; copyright remains with the publishers and authors.
💬 Discussion
0 commentsNo comments yet. Be the first to start a discussion!
Leave a Comment