Abstract
AbstractType IVa pili are ubiquitous and versatile bacterial cell surface filaments that undergo cycles of extension, adhesion and retraction powered by the cell-envelope spanning type IVa pilus machine (T4aPM). The overall architecture of the T4aPM and the location of 10 conserved core proteins within this architecture have been elucidated. Here, using genetics, cell biology, proteomics and cryo-electron tomography, we demonstrate that the PilY1 protein and four minor pilins, which are widely conserved in T4aP systems, are essential for pilus extension in Myxococcus xanthus and form a complex that is an integral part of the T4aPM. Moreover, these proteins are part of the extended pilus. Our data support a model whereby the PilY1/minor pilin complex functions as a priming complex in T4aPM for pilus extension, a tip complex in the extended pilus for adhesion, and a cork for terminating retraction to maintain a priming complex for the next round of extension.
🔬 Techniques
🔭 Microscopes
🧬 Organisms
💻 Software
✨ Fluorophores
🧪 Sample Preparation
🔬 Cell Lines
🏭 Microscope Brands
🧪 Reagent Suppliers
📷 Detectors
💻 Software Details
🏛️ Research Organizations (ROR)
Affiliated research institutions:
📋 Methods
Bacterial strains and growth media
Strains and plasmids used in this study are listed in Supplementary Table 1 . All M. xanthus strains are derivatives of DK1622 43 . In-frame deletion mutants were generated using g alK -containing plasmids for double homologous recombination 44 . Plasmids for ectopic expression of genes in M. xanthus were integrated by site-specific recombination at the attB site and the relevant genes expressed from the pilA promoter. All plasmids were verified by sequencing. All strains were confirmed by PCR. Oligonucleotides are listed in Supplementary Table 2 . M. xanthus strains were grown at 32 °C in 1% CTT medium (1% casitone, 10 mM Tris-HCl pH 7.6, 1 mM KPO 4 pH 7.6, 8 mM MgSO 4 ) or on 1% CTT 1.5% agar plates supplemented with kanamycin (40 µg ml −1 ) or oxytetracycline (10 µg ml −1 ) when required 45 . Escherichia coli strains were grown in LB broth 46 . Plasmids were propagated in E. coli Mach1.
T4aP-dependent motility assays
Cells from exponentially growing M. xanthus cultures were harvested and resuspended in 1% CTT to a calculated density of 7 × 10 9 cells ml −1 . Five microliters were spotted on soft agar CTT plates (0.5% casitone, 10 mM Tris-HCl pH 7.6, 1 mM KPO 4 pH 7.6, 8 mM MgSO 4 , 0.5% select agar (Invitrogen)) and incubated at 32 °C for 24 h. Colony edges were imaged using a Leica MZ75 stereomicroscope equipped with a Leica MC120 HD camera.
T4aP shearing assays
Pili were sheared of M. xanthus cells using a protocol based on the procedure of ref. 47 . Briefly, cells grown on 1% CTT and 1.5% agar plates for 2–3 days were gently scraped off the agar and resuspended in pili resuspension buffer (100 mM Tris-HCl pH 7.6, 150 mM NaCl) (1 ml per 60 mg cells). Cell suspensions were vortexed for 10 min at highest speed. Cells from a 100-µl aliquot were harvested, the pellet solved in 100 µl sodium dodecyl sulfate (SDS) lysis buffer (10% (v/v) glycerol, 50 mM Tris-HCl pH 6.8, 2 mM EDTA, 2% (w/v) SDS, 100 mM dithiothreitol, 0.01% bromphenol blue) and immediately denatured at 95 °C for 5 min. Total amount of protein was measured in cell extract samples using the detergent-compatible Bradford MX reagent (Expedion) and bovine serum albumin (BSA) standards in SDS lysis buffer. These samples were normalized to the same amount of protein and used to determine total cellular PilA amounts. The remaining suspension was centrifuged for 20 min at 13,000 × g at 4 °C. The supernatant was removed and centrifuged twice for 10 min at 13,000 × g at 4 °C to remove cell debris. T4aP in the cell-free supernatant were precipitated by adding 10× pili precipitation buffer (final concentrations: 100 mM MgCl 2 , 2% PEG 6000, 100 mM Tris-HCl pH 7.6, 150 mM NaCl) for at least 2 h at 4 °C. The solution was centrifuged for 30 min at 13,000 × g at 4 °C, and the pellet was suspended in SDS lysis buffer (1 µl per mg vortexed cells). T4aP sheared and purified from the same amount of cells (normalized by protein determination, see above) were loaded and separated by SDS-polyacrylamide gel electrophoresis (PAGE) for immunoblot analysis.
Show full methods section
Bacterial strains and growth media
Strains and plasmids used in this study are listed in Supplementary Table 1 . All M. xanthus strains are derivatives of DK1622 43 . In-frame deletion mutants were generated using g alK -containing plasmids for double homologous recombination 44 . Plasmids for ectopic expression of genes in M. xanthus were integrated by site-specific recombination at the attB site and the relevant genes expressed from the pilA promoter. All plasmids were verified by sequencing. All strains were confirmed by PCR. Oligonucleotides are listed in Supplementary Table 2 . M. xanthus strains were grown at 32 °C in 1% CTT medium (1% casitone, 10 mM Tris-HCl pH 7.6, 1 mM KPO 4 pH 7.6, 8 mM MgSO 4 ) or on 1% CTT 1.5% agar plates supplemented with kanamycin (40 µg ml −1 ) or oxytetracycline (10 µg ml −1 ) when required 45 . Escherichia coli strains were grown in LB broth 46 . Plasmids were propagated in E. coli Mach1.
T4aP-dependent motility assays
Cells from exponentially growing M. xanthus cultures were harvested and resuspended in 1% CTT to a calculated density of 7 × 10 9 cells ml −1 . Five microliters were spotted on soft agar CTT plates (0.5% casitone, 10 mM Tris-HCl pH 7.6, 1 mM KPO 4 pH 7.6, 8 mM MgSO 4 , 0.5% select agar (Invitrogen)) and incubated at 32 °C for 24 h. Colony edges were imaged using a Leica MZ75 stereomicroscope equipped with a Leica MC120 HD camera.
T4aP shearing assays
Pili were sheared of M. xanthus cells using a protocol based on the procedure of ref. 47 . Briefly, cells grown on 1% CTT and 1.5% agar plates for 2–3 days were gently scraped off the agar and resuspended in pili resuspension buffer (100 mM Tris-HCl pH 7.6, 150 mM NaCl) (1 ml per 60 mg cells). Cell suspensions were vortexed for 10 min at highest speed. Cells from a 100-µl aliquot were harvested, the pellet solved in 100 µl sodium dodecyl sulfate (SDS) lysis buffer (10% (v/v) glycerol, 50 mM Tris-HCl pH 6.8, 2 mM EDTA, 2% (w/v) SDS, 100 mM dithiothreitol, 0.01% bromphenol blue) and immediately denatured at 95 °C for 5 min. Total amount of protein was measured in cell extract samples using the detergent-compatible Bradford MX reagent (Expedion) and bovine serum albumin (BSA) standards in SDS lysis buffer. These samples were normalized to the same amount of protein and used to determine total cellular PilA amounts. The remaining suspension was centrifuged for 20 min at 13,000 × g at 4 °C. The supernatant was removed and centrifuged twice for 10 min at 13,000 × g at 4 °C to remove cell debris. T4aP in the cell-free supernatant were precipitated by adding 10× pili precipitation buffer (final concentrations: 100 mM MgCl 2 , 2% PEG 6000, 100 mM Tris-HCl pH 7.6, 150 mM NaCl) for at least 2 h at 4 °C. The solution was centrifuged for 30 min at 13,000 × g at 4 °C, and the pellet was suspended in SDS lysis buffer (1 µl per mg vortexed cells). T4aP sheared and purified from the same amount of cells (normalized by protein determination, see above) were loaded and separated by SDS-polyacrylamide gel electrophoresis (PAGE) for immunoblot analysis.
T4aP purification for SDS-PAGE and LFQ-MS analysis
Pili were sheared from 60 mg M. xanthus cells using the same protocol as above with the following modification. Precipitation of T4aP was repeated twice. After the last precipitation, the pellet was resuspended in 60 µl pili resuspension buffer. In all, 50% were boiled in SDS lysis buffer, loaded on an SDS-PAGE, and stained with Coomassie protein stain (InstantBlue, Expedeon). The remaining 50% were precipitated with acetone for LFQ-MS analysis.
Antibodies and immunoblot analysis
For immunoblot analysis, exponentially growing M. xanthus cells were harvested and resuspended in SDS lysis buffer. Immunoblotting was done with rabbit polyclonal α-PilB, α-PilT 48 , α-PilC, α-PilM, α-PilQ 24 , α-PilN, α-PilO, α-PilP 23 , α-TsaP 49 , α-PilA, and α-LonD antibodies.
Antibodies against PilA
(MXAN_5783) were generated by Eurogentec against a His 6 -Δ1-41-PilA protein purified from E. coli Rosetta 2 containing plasmid pMAT231 using affinity purification with a HiTrap Chelating column (GE Healthcare) loaded with CoCl 2 .
Antibodies against LonD
(MXAN_3993) were generated by Eurogentec against LonD-His 6 purified from E. coli Rosetta 2(DE3) containing plasmid pSM30 using native Ni-NTA affinity purification. Polyclonal rabbit antibodies were used to detect FLAG-tagged proteins (Rockland; 600-401-383) and mCherry-tagged proteins (BioVision; 5993-100). Monoclonal mouse antibodies were used to detect GFP-tagged proteins (Roche; 11814460001) and CyaA-tagged proteins (Santa Cruz, sc-13582). As secondary antibodies, goat anti-rabbit immunoglobulin G peroxidase conjugate (Sigma-Aldrich, A8275) and sheep anti-mouse immunoglobulin G peroxidase conjugate (Amersham, NXA931) were used. Antibodies and conjugates were used in the following dilutions: 1:500 α-CyaA; 1:2000 α-PilM, α-PilN, α-PilO, α-TsaP, α-GFP, and anti-mouse peroxidase conjugate; 1:2500 α-FLAG and α -mCherry; 1:3000 α-PilB, α-PilT, and α-PilC; 1:5000 α-PilQ and α-PilA; 1:6000 α-LonD; 1:10,000 anti-rabbit peroxidase conjugate. Blots were developed using Luminata™ Western HRP substrate (Millipore). Unless otherwise noted, protein from 3 × 10 8 cells were loaded per lane.
Fluorescence microscopy Five microliters of an exponentially growing
M. xanthus culture was spotted on 1.5% agarose pads supplemented with TPM (10 mM Tris-HCl pH 7.6, 1 mM KPO 4 pH 7.6, 8 mM MgSO 4 ). Agar pads were incubated for 30 min at 32 °C in a humid chamber before microscopy. Cells were observed using a Leica DMI6000B microscope with a Hamamatsu Flash 4.0 camera. Images were recorded with Leica MM AF software package and processed with Metamorph (Molecular Devices). For each strain, at least 100 cells were analyzed. Bacterial Two-Hybrid BACTH experiments were performed according to the manufacturer’s protocol (Euromedex). Briefly, DNA fragments encoding the sequences of the mature major and minor pilins as well as the AglQ control from M. xanthus were cloned into the vectors pKT25 and pUT18C to construct in-frame fusions at the C-terminal end of the T25 or T18 adenylate cyclase (CyaA) fragments. The AglR encoding sequence was cloned upstream of the N-terminal part of the T25 or T18 CyaA fragments using pKNT25 and pUT18 vectors. Subsequently, plasmids were transformed into E. coli BTH101 alone or in pairs. As a positive control, BTH101 co-transformed with the plasmids pKT25-zip and pUT18C-zip were used. In that control, the two leucine zippers dimerize giving rise to high β-galactosidase activity. cAMP production by reconstituted CyaA was qualitatively assessed by the formation of blue color as a read out for protein–protein interactions on LB agar supplemented with 40 µg ml −1 5-bromo-4-chloro-3-indolyl-β- d -galactopyranoside and 0.5 mM isopropyl-β- d -thiogalactopyranosid (IPTG) or quantitatively by measuring β-galactosidase activity using a 96-well microplate adapted protocol 50 with minor modifications. In brief, per transformation four randomly picked colonies were each transferred to 200 µl LB containing 50 µg ml −1 ampicillin and 50 µg ml −1 kanamycin per well and grown overnight at 32 °C. Cells (50 µl) were transferred to fresh 200 µl LB containing 50 µg ml −1 ampicillin, 50 µg ml −1 kanamycin, and 0.25 mM IPTG and grown for 4 h at 32 °C. Cells (50 µl) were diluted into 150 µl LB to measure optical density (OD 600 nm ) in a microplate reader (Infinite M200, Tecan). Another aliquot of cells (50 µl) were permeabilized by transfer into 200 µl permeabilization solution (100 ml Z-buffer (60 mM Na 2 HPO 4 , 40 mM NaH 2 PO 4 , 10 mM KCl, 1 mM MgSO 4 , 50 mM β-mercaptoethanol), 100 µl Lysonase (Merck, 71230), and 12.5 ml PopCulture reagent (Merck, 71092)) and further incubation for 15 min at room temperature (RT). Permeabilized cells (50 µl) were transferred into 150 µl Z-buffer. Per well, 40 µl ONPG ( O -nitrophenyl-β- d -galactoside, 40 mg ml −1 ) were added and OD 420nm recording was started immediately at 28 °C every 2 min for 20 min in total in the microplate reader. The relative β-galactosidase activity in each of the 96 samples was calculated (OD 420nm (t2) − OD 420 nm (t1)/t2 − t1 (min)/OD 600 nm ). The t2 and t1 time points were chosen from the linear part of the ONPG conversion curve for each of the 96 samples. To fractionate BTH101 cell extracts, cells were washed in phosphate-buffered saline (PBS) containing 2× protease inhibitor (see above), concentrated to 4 × 10 10 cells ml −1 and sonicated. After centrifugation to remove cell debris and aggregated proteins (30 min, 10,000 × g at 4 °C), the cleared cell lysates were fractionated in soluble and membrane fractions by ultracentrifugation (1 h, 4 °C, 28 psi, airfuge Beckman). Pull-down experiments Pull-down experiments were done using M. xanthus cells grown on 1% CTT and 1.5% agar plates. Cells (80 mg per replicate) were scraped from plates and washed in 1 ml PBS (137 mM NaCl, 2.7 mM KCl, 10 mM Na 2 HPO 4 , 1.8 mM KH 2 PO 4 , pH 7.5). Cells were suspended in 150 µl PBS, 150 µl detergent cocktail (8% CHAPS (3-[(3-cholamidopropyl)dimethylammonio]-1-propanesulfonate hydrate), 8% zwittergent 3–14 (3-[dimethyl(tetradecyl)azaniumyl]propane-1-sulfonate), 8% SLS (sodiumlauroylsarcosinate), 0.1% NP-40 (Nonidet P-40), 40% glycerol), and 33 µl protease inhibitor concentrate (1 tablet protease inhibitor completely dissolved in 1 ml PBS; Roche 11836145001) and lysis continued for 10 min at RT. The total volume was increased to 5 ml with PBS, up to 5 µl Benzonase (Merck, 101540001) were added, and the suspension was further incubated under rotation at 4 °C for 60 min. Cell debris was removed by centrifugation (15 min, 10,000 × g at 4 °C). To the cleared supernatants, 15 µl of magnetic α-FLAG M2 beads (M8823, Sigma) were added for 1 h to capture FLAG-tagged proteins. To capture GFP-tagged proteins, 15 µl of GFP-Trap agarose (GTA-20, Chromotek) was added to the cleared supernatants and incubated for 1 h at 4 °C on a rotary shaker.
Label-free quantitative mass spectrometry
To determine the proteome of M. xanthus cells growing on 1% CTT 1.5% agar plates, 35 mg of cells were washed twice in PBS containing 2× protease inhibitor (see above). The final pellet was frozen in liquid nitrogen. Every pellet was suspended in 150 µl 2% SLS and 100 mM ammonium bicarbonate and heated for 60 min at 95 °C. The amount of extracted protein was measured using a BCA protein assay (Thermo Scientific). Seventy micrograms of protein was reduced using 5 mM Tris(2-carboxyethyl)phosphin (TCEP; Thermo Fischer Scientific) at 90 °C for 10 min and alkylated with 10 mM iodoacetamide (Sigma Aldrich) for 30 min at 25 °C in the dark. Proteins were precipitated using 400 µl ice-cold acetone followed by overnight incubation at −20 °C. Protein pellets were collected by centrifugation, and the remaining acetone was evaporated. Proteins were dissolved in 0.5% SLS solution using sonication. One microgram of trypsin (Promega) was added to 50 µg protein solution and digest was performed overnight at 30 °C. Following digest, peptides were acidified with trifluoroacetic acid (TFA; Thermo Fischer Scientific) and desalted using solid-phase extraction (SPE) on C18-Microspin columns (Harvard Apparatus). SPE columns were prepared by adding acetonitrile (ACN), followed by column equilibration with 0.1% TFA. Peptides were loaded on equilibrated Microspin columns and washed twice with 5% ACN/0.1% TFA. After peptide elution using 50% ACN/0.1% TFA, peptides were dried in a rotating concentrator (Thermo Fischer Scientific), reconstituted in 0.1% TFA, and subjected to liquid chromatography-mass spectrometry (LC-MS) analysis. LC-MS analysis was carried out on a Q-Exactive Plus instrument connected to an Ultimate 3000 RSLC nano with a Prowflow upgrade and a nanospray flex ion source (all Thermo Scientific). Peptide separation was performed on a reverse-phase HPLC column (75 µm × 42 cm) packed in-house with C18 resin (2.4 µm, Dr. Maisch). The following separating gradient was used: 98% solvent A (0.15% formic acid) and 2% solvent B (99.85 acetonitrile, 0.15% formic acid) to 35% solvent B over 120 min at a flow rate of 300 nl min −1 . The data acquisition mode was set to obtain one high-resolution MS scan at a resolution of 70,000 full width at half maximum (at m / z 200) followed by MS/MS scans of the most intense ions. To increase the efficiency of MS/MS attempts, the charged state screening modus was enabled to exclude unassigned and singly charged ions. The dynamic exclusion duration was set to 30 s. The ion accumulation time was set to 50 ms for MS and 50 ms at 17,500 resolution for MS/MS. The automatic gain control was set to 3 × 10 6 for MS survey scans and 1 × 10 5 for MS/MS scans. In pull-down experiments, beads were washed twice with 700 µl PBS–detergent wash buffer (3 ml PBS + 100 µl detergent cocktail) and five times with 700 µl of 100 mM ammonium bicarbonate (Sigma-Aldrich) to remove detergents. For elution, 100 µl elution buffer 1 (100 mM ammonium bicarbonate, 1 µg trypsin (Promega)) was added to each sample. After 30 min incubation at 30 °C, the supernatant containing the digested proteins was collected. Beads were washed twice with elution buffer 2 (100 mM ammonium bicarbonate, 5 mM TCEP) and added to the first elution fraction. Digestion was allowed to proceed overnight at 30 °C. Following digestion, the peptides were incubated with 10 mM iodoacetamide for 30 min at 25 °C in the dark. Prior to LC-MS analysis, peptides samples were desalted using C18 SPE. LC-MS analysis was performed as above, except that gradient length was reduced to 60 min. For LC-MS analysis of sheared pili fractions, the dried pellets obtained by acetone precipitations were resuspended in 100 µl sodiumdeoxycholate buffer (2% sodiumdeoxycholate, 100 mM ammonium bicarbonate), heated for 15 min at 95 °C, reduced, and alkylated as described above. The detergent concentration was diluted to 0.5% and 30 µg pili was digested with 1 µg trypsin (Promega) overnight at 30 °C. Further SPE processing was carried out as described above. One microgram of total peptides were loaded onto the LC-MS system as described for the proteome samples. Settings for LC-MS analysis were also described earlier 51 , 52 . LFQ was performed using MaxQuant 53 and a M. xanthus protein database downloaded from UniProt. To calculate protein abundances and protein enrichment, iBAQ values 54 were calculated using MaxQuant. iBAQ values are calculated as the sum of all peptide intensities for a given protein divided by the number of theoretically MS observable peptides. Following MaxQuant analysis, the iBAQ values were normalized by the total iBAQ sum. The resulting MaxQuant output table was loaded into Perseus (v1.5.2.6) 55 . For calculation of enrichment factors in samples versus controls, only proteins with three or more peptides were considered; values for proteins not detected in the control were imputed using the imputation function from normal distribution implemented in Perseus in default settings (width, 0.3; down-shift, 1.8). Proteins with an absolute abundance difference of ≥2 (log2 ratio of ≥1) in the sample versus control and a p value ≤0.05 using two-tailed Student’s t test were considered as enriched. Volcano plots were generated in Perseus. For purified T4aP, log2 enrichments were calculated based on normalized iBAQ values independently of the highly abundant PilA.
Cryo-electron tomography
Cryo-ET was done as described 3 . Briefly, M. xanthus cells were grown to an OD 550nm of 0.8 in 1% CTT medium at 32 °C with 150 RPM of shaking. Ten-nanometer colloidal gold (Sigma-Aldrich, St. Louis, MO) pretreated with BSA was added to the cells to serve as fiducial markers during tomogram reconstruction. Three microliters of the resulting sample was pipetted onto a freshly glow-discharged Quantifoil copper R2/2 200 EM grid (Quantifoil Micro Tools GmbH, Jena, Germany) and plunge-frozen in a liquid ethane propane mixture using an FEI Vitrobot mark-III (FEI Company, Hillsboro, OR). The frozen grids were imaged in an FEI Tecnai G2 Polara 300 keV FEG transmission electron microscope (FEI Company, Hillsboro, OR) equipped with a Gatan energy filter (Gatan, Pleasanton, CA) and a Gatan K2 Summit direct detector (Gatan, Pleasanton, CA). Energy-filtered tilt-series of images of cell poles were collected automatically from −60° to +60° at 1° intervals using the UCSF Tomography data collection software 56 with total dosage of 150 e − Å −2 , a defocus of −6 µm, and a pixel size of 3.9 Å. The images were aligned and contrast transfer function corrected using the IMOD software package 57 . SIRT reconstructions were then produced using the TOMO3D program 58 . T4aPM were located by visual inspection. Subtomogram averages with twofold symmetrization along the particle Y -axis were produced using the PEET program 59 .
Immunogold labeling and transmission electron microscopy
To label T4aP attached to cells, exponentially growing M. xanthus cells in 1% CTT (OD 550 nm = 0.5) were diluted fivefold in 1% CTT, placed in 6-well polystyrene plates (TC-plate F, Sarstedt 83.392), and allowed to adhere to the bottom. After 18 h, culture supernatants were removed and the adhered cells washed twice in PBS and once in 50 mM Na-Cacodylate buffer (stock 0.2 M pH7.4; EMS 11053). The adhered cells were overlaid with fixation solution (2% formaldehyde, 0.5% glutaraldehyde, in 50 mM Na-Cacodylate pH 7.4) and fixed for 3–5 h. Then the fixation solution was removed, and fixed cells were washed twice in PBS and incubated for 1 h in PBS containing 0.2% BSA (Aurion 900.099). The primary antibody (α-FLAG or α-mCherry, 1:200) was added and incubation was continued at 4 °C for 18 h. Then the fixed cells were washed twice in PBS and incubated for 1 h in 1 ml PBS plus 100 µl blocking reagent (Aurion 905.002). The secondary antibody was added (1:200, goat α-rabbit IgG gold, 10 nm colloidal gold, Sigma G7402). After 2 h, fixed cells were washed twice in PBS and carefully removed from the bottom of the plates. An aliquot of these cells was applied on copper grids (Plano, S162-3, 300 mesh). To label sheared T4aP, the primary antibody (α-FLAG or α-mCherry, 1:200) was added to aliquots of T4aP in pili resuspension buffer (s.a.) and incubation continued at 4 °C for 18 h. Then T4aP were precipitated with pili precipitation solution (s.a.). T4aP were washed in pili resuspension buffer and precipitated again. After resuspension of T4aP in resuspension buffer, the secondary antibody was added (1:200, goat α-rabbit IgG gold, 10 nm colloidal gold, Sigma G7402) for 2 h at 4 °C. T4aP were precipitated, washed, and resuspended again before an aliquot of these T4aP solutions was applied on copper grids. After 30 min, grids were washed twice with water and negative staining was done with 2% uranyl acetate. Grids were inspected with a JEM-1400 electron microscope (JEOL) at 100 kV. Bioinformatics We previously identified fimU 1–3, pilV 1–3, pilW 1–3, and the pilX 1 gene 3 (Fig. 1b ). Using the KEGG SSDB database 60 , we identified a pilX gene in cluster_2. To identify PilY1-encoding gene(s) in M. xanthus , we used the PilY1 proteins from P. aeruginosa (PA_4554), N. gonorrhoeae ( Z50180 , Z49120 ), and N. meningitidis (NMV_0045 and NMV_2037) as queries in BlastP searches 61 . Using this approach, we identified two PilY1-encoding genes in the M. xanthus genome ( pilY1.2 and pilY1.3 ). Using the KEGG SSDB database 60 , we additionally identified PilY1.1. Each of the three pilY1 genes localize near the previously described three minor pilin gene clusters 3 (Fig. 1b ). All proteins from cluster_1–_3 were analyzed using the program hmmscan on the HMMER web server 62 . These analyses revealed that MXAN_1366 in cluster_3 encodes a protein (PilX3), which similarly to PilX1 and PilX2 contained the conserved Pfam domain PF14341 (PilX N-term). Therefore, all three gene clusters encode a PilY1 protein and four minor pilins FimU, PilV, PilW, and PilX (Fig. 1b ). Proteins were analyzed using SignalP v.4.1 63 to identify signal peptides with default gathering thresholds and the PHYRE2 protein fold recognition tool 64 to identify secondary structure elements and conserved domains and to construct homology models. To identify domains in proteins, Pfam and HMM searches were performed using the program hmmscan on the HMMER web server 62 . The I-TASSER server was used for structure-based protein function annotation and for the generation of homology models 65 . Alignments were generated using T-Coffee 66 and the ClustalW output format 67 . The alignments were shaded using the BoxShade Server.
Statistics and reproducibility
Statistics were performed using a two-tailed Student’s t test for samples with equal variances using Perseus. Analysis of mean and standard deviation were done in Excel 2016. Data shown for T4aP-dependent motility, T4aP shear off experiments, immunogold experiments, immunoblot experiments, and fluorescence microscopy were obtained in at least two independent experiments with similar results. Localization patterns from fluorescence microscopic data are representative from N > 100 cells per strain. For qualitative and quantitative determination of protein–protein interactions using the BACTH, for any given combination four distinct clones were analyzed. For LFQ-MS analysis of proteome, three biological replicates were analyzed. For pull-down experiments, two biological replicates and two negative controls were used. Purification of T4aP pili and SDS-PAGE analysis were repeated several times with similar results. For LFQ-MS analysis on T4aP, samples from two biological replicates and two negative controls were analyzed. Multiple cryotomograms were taken from each mutant. Multiple cryotomograms were taken to image pili tips. Reporting summary Further information on research design is available in the Nature Research Reporting Summary linked to this article.
Supplementary information Supplementary Information Peer Review File Reporting Summary
📊 Figures
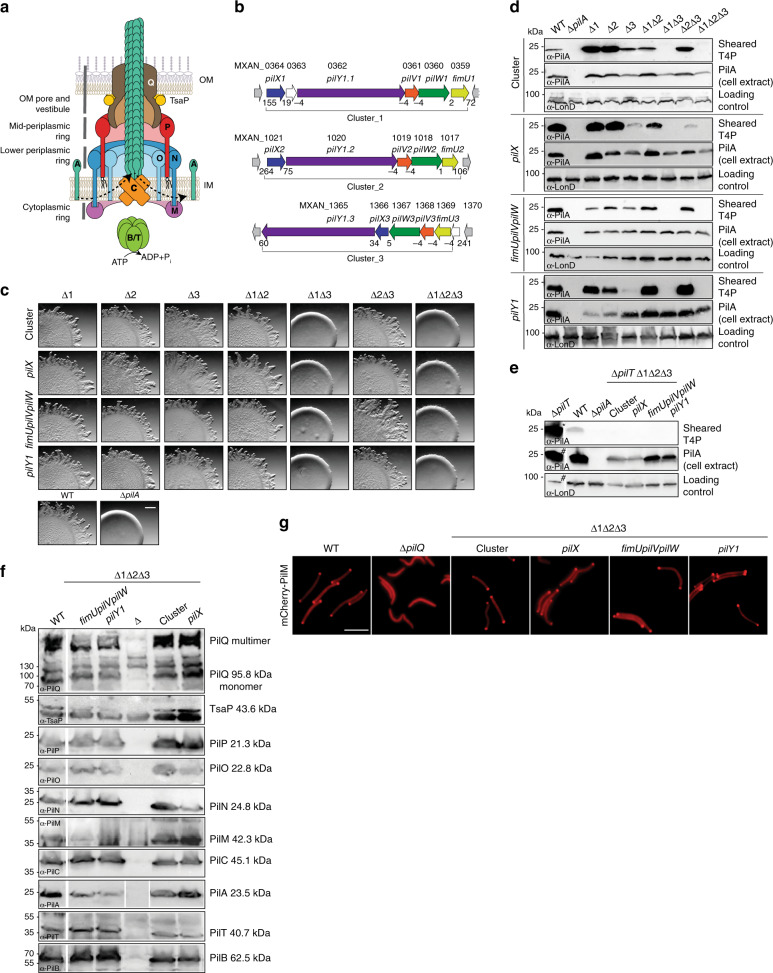
Fig. 1
PilY1 and minor pilins are essential for T4aP-dependent motility.
a Architectural model of T4aPM. The OM pore (PilQ secretin and TsaP) connect to PilP. PilP connect to a lower periplasmic ring (globular domains of PilN and PilO), which connect to a cytoplasmic ring ...
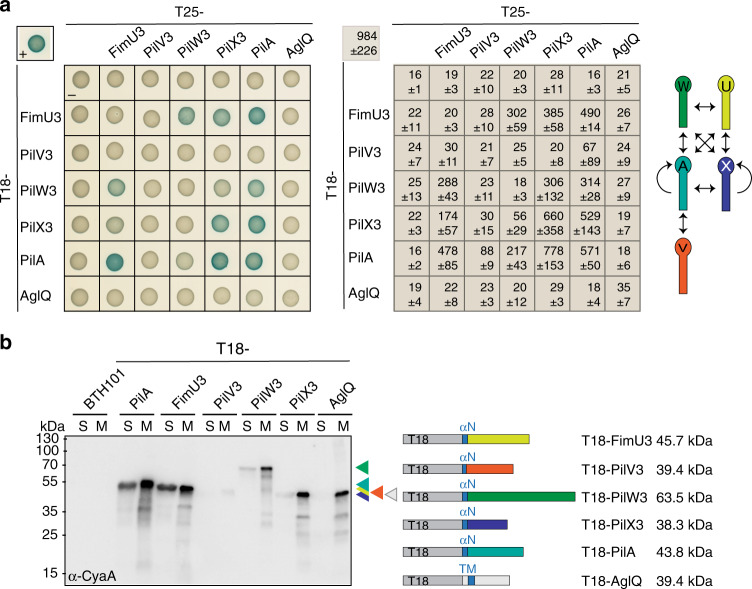
Fig. 2
PilA and cluster_3 minor pilins interact.
a BACTH analysis of PilA and cluster_3 minor pilin interactions. T25 and T18 were fused to the N-terminus of the indicated mature, full-length proteins. Positive control (plus) in upper left corner, T...
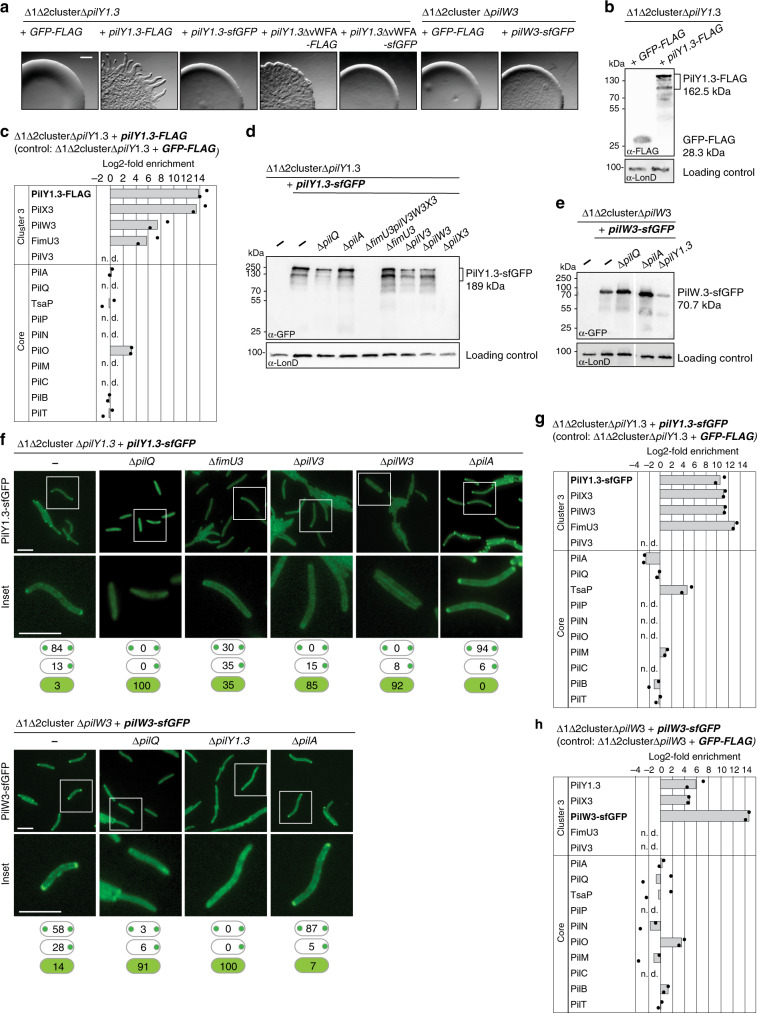
Fig. 3
Cluster_3 minor pilins and PilY1.3 interact.
a T4aP-dependent motility assays for strains with tagged PilY1.3 or PilW3. Strains of the indicated genotypes were incubated 24u2009h. Scale bar, 1u2009mm. b Accumulation levels of PilY1.3-FLAG and GF...
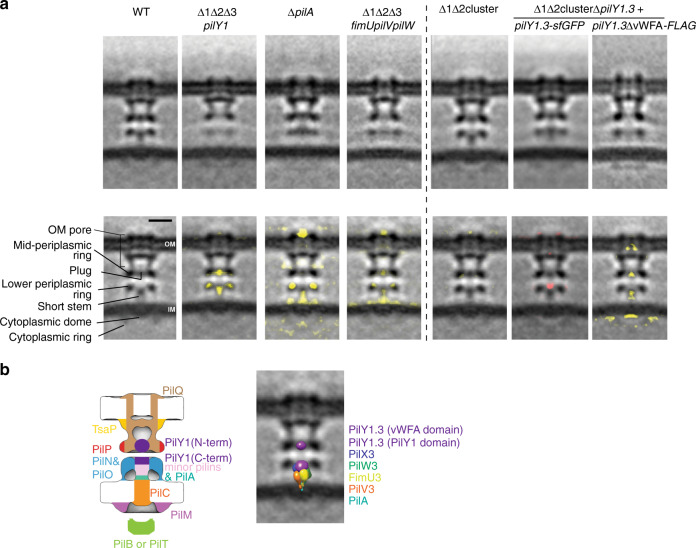
Fig. 4
PilA, minor pilins, and PilY1 make up the short stem and plug.
a Structures (subtomogram averages) of T4aPM in strains of the indicated genotypes. Top row, central slices through subtomogram averages of empty T4aPM. Lower row, first panel describes densities obse...
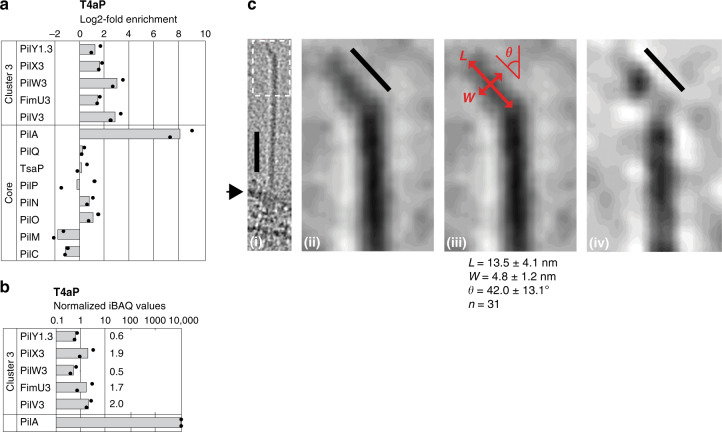
Fig. 5
Minor pilins and PilY1 are present in T4aP.
a Cluster_3 minor pilins and PilY1.3 are enriched in purified T4aP. T4aP were purified from the hyper-piliated u2206 pilT mutant and the non-piliated u2206 pilB u2206 pilT mutant (negative control). S...
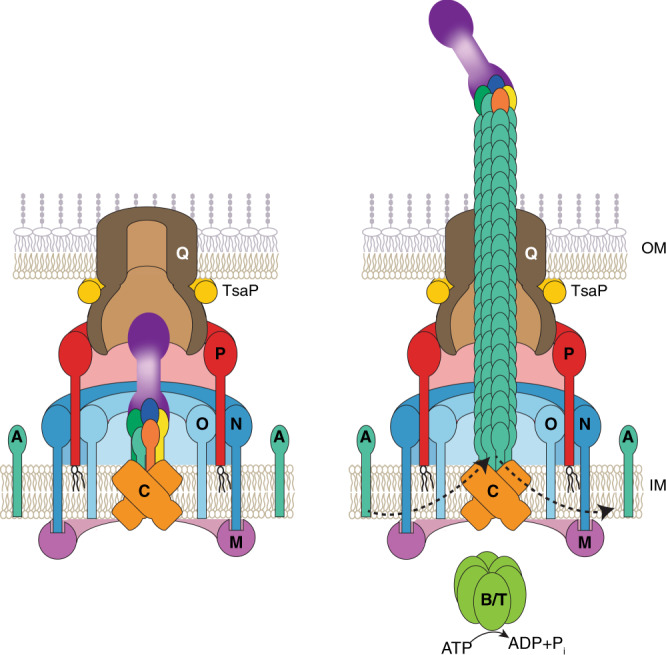
Fig. 6
Three functions of the PilY1/minor pilin complex.
Left panel, architectural model of non-piliated T4aPM with ten core proteins and the priming complex composed of PilY1, four minor pilins, and one PilA subunit. Right panel, architectural model of pil...
Figure images are served from the NIH/NLM PubMed Central Open Access Subset or Europe PMC; copyright remains with the publishers and authors.
💬 Discussion
0 commentsNo comments yet. Be the first to start a discussion!
Leave a Comment