Abstract
Abstract Background Heterochromatin in the nucleus of human embryonic cells plays an important role in the epigenetic regulation of gene expression. The architecture of heterochromatin and its dynamic organization remain elusive because of the lack of fast and high-resolution deep-cell imaging tools. We enable this task by advancing instrumental and algorithmic implementation of the localization-based super-resolution technique. Results We present light-sheet Bayesian super-resolution microscopy (LSBM). We adapt light-sheet illumination for super-resolution imaging by using a novel prism-coupled condenser design to illuminate a thin slice of the nucleus with high signal-to-noise ratio. Coupled with a Bayesian algorithm that resolves overlapping fluorophores from high-density areas, we show, for the first time, nanoscopic features of the heterochromatin structure in both fixed and live human embryonic stem cells. The enhanced temporal resolution allows capturing the dynamic change of heterochromatin with a lateral resolution of 50-60 nm on a time scale of 2.3 s. Conclusion Light-sheet Bayesian microscopy opens up broad new possibilities of probing nanometer-scale nuclear structures and real-time sub-cellular processes and other previously difficult-to-access intracellular regions of living cells at the single-molecule, and single cell level.
🔬 Techniques
🔭 Microscopes
✨ Fluorophores
🧪 Sample Preparation
🔬 Cell Lines
🏭 Microscope Brands
🧪 Reagent Suppliers
🔴 Lasers
📷 Detectors
🔎 Objectives
💻 Software Details
🏛️ Research Organizations (ROR)
Affiliated research institutions:
📋 Methods
Optical design for prism-coupled light-sheet illumination
To reject out-of-focus fluorescence background from thick samples, selective-plane illumination microscopy (SPIM), also known as light-sheet microscopy, has been recently introduced for single-molecule super-resolution imaging by Zanacchi et al ( Cella Zanacchi et al. 2011 ). The planar illumination is wide-field compatible and faster than scanning-based two-photon techniques for large areas ( Folling et al. 2007 ; York et al. 2011 ; Vaziri et al. 2008 ). To generate a light sheet, laser light passes through a cylindrical lens and focuses to a line onto the back aperture of an illumination objective, which delivers the planar sheet of light to an imaging sample ( Figure 1a ). For imaging the intact nucleus with high speeds, light-sheet illumination provides optical sectioning with ease. While the concept of SPIM for single-molecule imaging has been successfully demonstrated, the original light-sheet condenser design has essentially remained unchanged since its conception by Siedentpf and Zsigmondy in 1903 ( Siedentpf and Zsigmondy 1903 ). Considerable efforts have been devoted to searching for a method to induce light sheet illumination suitable for sectioning sub-cellular regions, while accommodating the use of a high-numerical-aperture (NA≥1.0) objective lens for high photon collection efficiency, and providing a large and flat field of view (FOV) to cover the entire region of interest. For example, the individual molecule localization SPIM (IML-SPIM) ( Cella Zanacchi et al. 2011 ) and inverted SPIM (iSPIM) ( Wu et al. 2011 ) ( Figure 1b–c ) impose a space constraint to simultaneously support a thin light sheet and a high-NA collection objective from the orthogonally oriented objectives. Alternatively, highly inclined and laminated optical sheet (HILO) uses a single high-NA objective; but its FOV is limited due to the oblique illumination ( Tokunaga et al. 2008 ) ( Figure 1d ). A recent design by Gebhardt et al. attempted to address this problem by using a polished AFM cantilever as a mirror, which was placed close to the sample ( Figure 1e ). The mirror deflects the light sheet from the vertically-oriented illumination objective to generate a horizontally-oriented illumination plane coupled to a high-NA imaging objective with a slight horizontal offset on an inverted microscope ( Gebhardt et al. 2013 ). This technique induces a 2-µm gap that cannot be imaged in the samples. To adapt the light sheet illumination for imaging single hESCs, we have developed a simple and effective prism-coupled light-sheet condenser design. Demonstrated in Figure 1f and Additional file 2: Figure S2 , light sheet was created by an f = 500 mm plano-convex cylindrical lens (Thorlabs LJ1144RM-A) and focused onto the back focal plane of an infinity-corrected Mitutoto M Plan APO 50× NA 0.55 condenser objective. A Pellin-Broca prism (Thorlabs ADBU-10) was placed after the condenser objective to redirect the light sheet horizontally onto a sample at the focal plane of an imaging objective, in our case, a Zeiss W Plan-Apochromat 63× NA 1.0 water immersion lens. The prism-coupled condenser design enjoys three major advantages for super-resolution imaging. First, the de-coupling between the imaging and condenser objective and increase of the angle between them from 90 to roughly 120 degrees relaxes the space constraint for sample placement. The design widens the choice of imaging objectives and allows the use of even higher NA (NA > 1.0) water-immersion lenses. Second, the horizontal overlap between light-sheet illumination and the imaging plane yields a flat and large FOV with high SNR. Large FOV is necessary in order to capture the entire cross-section of the nucleus of the hESC. Third, compared to the AFM cantilever system ( Gebhardt et al. 2013 ), the prism design is less prone to vibrations and simpler to implement in biology labs. In addition, the design is directly compatible with cell culture by accepting standard petri dishes. In our setup, we used a 35-mm glass-bottom petri dish (MatTek P35G-0-20-C) as the sample holder. For sample placement, we custom made an aluminum adaptor plate clamped onto a piezo translation stage (Thorlabs NanoMax-TS) and tilted at a horizontal angle of approximately 20 degrees ( Additional file 1: Figure S1 ). The adaptor held the glass bottom dish flush with the top surface of the prism with index-matching oil in between. The piezo stage (Thorlabs NanoMax-TS) translated the sample along the top surface of the prism and exposed different depths of the hESC to light-sheet illumination. The excitation lasers, a 150-mW 561-nm diode-pumped solid-state laser (Cobolt Jive) and a 160-mW 642-nm diode laser (Coherent Cube), were brought together before the cylindrical lens and the condenser lens. Sharing the illumination path was a 60 mW 405 nm (Omicron PhoxX) laser for activation. For fluorescence imaging, an emission filter (600/60 for mEos and 705/130 for Alexa 647) and a notch filter were placed in front of an EMCCD camera (Andor iXon DU-897E with a pixel size of 16 × 16 µm). For imaging fixed cells, we used a custom mounting for the camera with a 300-mm tube lens, bringing the effective magnification to 115× ( Additional file 2: Figure S2a ). For live cell imaging, we adapted the light sheet system to the framework of a Zeiss Examiner.D1 upright microscope with mechanical support (not shown).
Show full methods section
Optical design for prism-coupled light-sheet illumination
To reject out-of-focus fluorescence background from thick samples, selective-plane illumination microscopy (SPIM), also known as light-sheet microscopy, has been recently introduced for single-molecule super-resolution imaging by Zanacchi et al ( Cella Zanacchi et al. 2011 ). The planar illumination is wide-field compatible and faster than scanning-based two-photon techniques for large areas ( Folling et al. 2007 ; York et al. 2011 ; Vaziri et al. 2008 ). To generate a light sheet, laser light passes through a cylindrical lens and focuses to a line onto the back aperture of an illumination objective, which delivers the planar sheet of light to an imaging sample ( Figure 1a ). For imaging the intact nucleus with high speeds, light-sheet illumination provides optical sectioning with ease. While the concept of SPIM for single-molecule imaging has been successfully demonstrated, the original light-sheet condenser design has essentially remained unchanged since its conception by Siedentpf and Zsigmondy in 1903 ( Siedentpf and Zsigmondy 1903 ). Considerable efforts have been devoted to searching for a method to induce light sheet illumination suitable for sectioning sub-cellular regions, while accommodating the use of a high-numerical-aperture (NA≥1.0) objective lens for high photon collection efficiency, and providing a large and flat field of view (FOV) to cover the entire region of interest. For example, the individual molecule localization SPIM (IML-SPIM) ( Cella Zanacchi et al. 2011 ) and inverted SPIM (iSPIM) ( Wu et al. 2011 ) ( Figure 1b–c ) impose a space constraint to simultaneously support a thin light sheet and a high-NA collection objective from the orthogonally oriented objectives. Alternatively, highly inclined and laminated optical sheet (HILO) uses a single high-NA objective; but its FOV is limited due to the oblique illumination ( Tokunaga et al. 2008 ) ( Figure 1d ). A recent design by Gebhardt et al. attempted to address this problem by using a polished AFM cantilever as a mirror, which was placed close to the sample ( Figure 1e ). The mirror deflects the light sheet from the vertically-oriented illumination objective to generate a horizontally-oriented illumination plane coupled to a high-NA imaging objective with a slight horizontal offset on an inverted microscope ( Gebhardt et al. 2013 ). This technique induces a 2-µm gap that cannot be imaged in the samples. To adapt the light sheet illumination for imaging single hESCs, we have developed a simple and effective prism-coupled light-sheet condenser design. Demonstrated in Figure 1f and Additional file 2: Figure S2 , light sheet was created by an f = 500 mm plano-convex cylindrical lens (Thorlabs LJ1144RM-A) and focused onto the back focal plane of an infinity-corrected Mitutoto M Plan APO 50× NA 0.55 condenser objective. A Pellin-Broca prism (Thorlabs ADBU-10) was placed after the condenser objective to redirect the light sheet horizontally onto a sample at the focal plane of an imaging objective, in our case, a Zeiss W Plan-Apochromat 63× NA 1.0 water immersion lens. The prism-coupled condenser design enjoys three major advantages for super-resolution imaging. First, the de-coupling between the imaging and condenser objective and increase of the angle between them from 90 to roughly 120 degrees relaxes the space constraint for sample placement. The design widens the choice of imaging objectives and allows the use of even higher NA (NA > 1.0) water-immersion lenses. Second, the horizontal overlap between light-sheet illumination and the imaging plane yields a flat and large FOV with high SNR. Large FOV is necessary in order to capture the entire cross-section of the nucleus of the hESC. Third, compared to the AFM cantilever system ( Gebhardt et al. 2013 ), the prism design is less prone to vibrations and simpler to implement in biology labs. In addition, the design is directly compatible with cell culture by accepting standard petri dishes. In our setup, we used a 35-mm glass-bottom petri dish (MatTek P35G-0-20-C) as the sample holder. For sample placement, we custom made an aluminum adaptor plate clamped onto a piezo translation stage (Thorlabs NanoMax-TS) and tilted at a horizontal angle of approximately 20 degrees ( Additional file 1: Figure S1 ). The adaptor held the glass bottom dish flush with the top surface of the prism with index-matching oil in between. The piezo stage (Thorlabs NanoMax-TS) translated the sample along the top surface of the prism and exposed different depths of the hESC to light-sheet illumination. The excitation lasers, a 150-mW 561-nm diode-pumped solid-state laser (Cobolt Jive) and a 160-mW 642-nm diode laser (Coherent Cube), were brought together before the cylindrical lens and the condenser lens. Sharing the illumination path was a 60 mW 405 nm (Omicron PhoxX) laser for activation. For fluorescence imaging, an emission filter (600/60 for mEos and 705/130 for Alexa 647) and a notch filter were placed in front of an EMCCD camera (Andor iXon DU-897E with a pixel size of 16 × 16 µm). For imaging fixed cells, we used a custom mounting for the camera with a 300-mm tube lens, bringing the effective magnification to 115× ( Additional file 2: Figure S2a ). For live cell imaging, we adapted the light sheet system to the framework of a Zeiss Examiner.D1 upright microscope with mechanical support (not shown).
Characterization of the light sheet
We used the RF module in COMSOL Multiphysics™ to perform the full-wave electromagnetic simulation of the light sheet. The incident Gaussian beam was characterized in the form: E ( r , z ) = E 0 w 0 w ( z ) exp [ − r 2 w ( z ) 2 ] exp [ − i ( k z − tan − 1 z z R + k r 2 2 R ( z ) ) ] , where r is the radial distance from the center of the beam, z is the axial distance, w 0 is the beam waist and set to 2 µm, w ( z ) = w 0 1 + ( z π w 0 2 / λ ) 2 is the radius at which the intensity of the beam drops to, 1/ e 2 , R ( z ) = z [ 1 + ( π w 0 2 λ z ) 2 ] is the radius of the wave fronts. The Gaussian wave was launched from the bottom of the 2-D simulation domain with an excitation of the magnetic field in z . We plotted the intensity as the square of the normal E field. The FWHM from the line plot of the intensity profile characterized the width and length of the light sheet. For demonstration, we simulated the light sheet at 561 nm. The refractive index was 1.333 for water and 1.512 for glass. For visualizing and measuring the thickness of the light sheet, we used fluorescent bead solution (Invitrogen F-8794) with 10 6 × dilution. A glass bottom dish containing 3 ml diluted fluorescent bead solution was use for profiling. The thickness was determined from the image captured by the EMCCD camera and the image pixel size.
Sample preparation via transgenetic labeling or immunostaining
Human embryonic stem cells were cultured at the Stem Cell Core facility of the Salk Institute as previously described ( Woods et al. 2011 ). Two NIH-registered hESC cell lines were cultured: WA01 (H1) and (Hues6). Both cell lines were determined to be karyotypically normal by cytogenetic analysis and shown to be pluripotent by in vivo teratoma histological assays. Pluripotent cell lines were cultured and expanded using Matrigel (BD Biosciences, San Diego, CA) to maintain their pluripotency. To generate transgenic cell lines, we constructed lentiviral vectors, pBOB-CAG-mEos2 and pBOB-CAG-mEos3, to express fusion proteins of mEos2-HP1α/mEos3-HP1α or mEos2-Centrin2/mEos3-Centrin2. Human embryonic stem cells were passaged by TrypLE digest, split into single cells, and subsequently cultured in the presence of Rock Inhibitor on Matrigel. Lentivirus infection was performed at a multiplicity of infection of 1:20 to 50 by spinning infection at a speed of 800 g for 1 h. Transduced cells were further incubated in fresh media for 48 h and seeded onto glass bottom dishes. For immunostaining, we followed standard labeling procedures for STORM. Briefly, cells were fixed in 3% (v/v) paraformaldehyde (Alfa Aesar 43368) and 0.1% glutaraldehyde (Sigma G5882) (v/v) in PBS for 10 min and washed three times in filtered PBS. The remaining PFA and glutaraldehyde were reduced by incubating fixed cells in freshly prepared 0.1% (w/v) sodium borohydride (Sigma 213462) for 7 min, followed by permeabilization in the blocking buffer (5% (v/v) normal goat serum and 0.2% (v/v) Triton X100 (Sigma T8787) in PBS) for approximately one hour. The primary mouse anti-β-tubulin antibody (Invitrogen 1083461A) was diluted 200× in the blocking buffer with a 30-min incubation time. After washing five times in the washing buffer (0.2% (v/v) normal goat serum and 0.1% (v/v) Triton x100 in PBS), cells were incubated in the Alexa Fluor 647 conjugated goat anti-mouse IgG secondary antibody (Moleular Probes A21237) with 500× dilution in the blocking buffer for 30 min. The sample was protected from light and post-fixed with 3% (v/v) paraformaldehyde and 0.1% (v/v) glutaraldehyde in PBS for 10min after three-time wash.
Imaging fixed and live cells
The image frame size was cropped to smaller than 128×128 pixels in order to increase the frame rate. Low excitation power was used to first locate the nucleus or microtubules, followed by imaging with full excitation power. The initial quick bleaching and subsequent blinking process were typically captured within the first 1–2000 frames with an exposure time of 30–50 ms. Standard imaging buffer was used for STORM: 40 mM D-glucose, 0.5 mg ml −1 glucose oxidase (Sigma G6125), 40 µg ml −1 catalase (Sigma C1345), and 143 mM β-mercaptoethanol (Sigma M6250) at pH 8.0. For vertical sectioning, the sample was translated tangential to the top surface of the prism by the piezo stage. With a known tilt angle, vertical translates can be precisely determined from the tangential movement. The light-sheet microscope was adapted for short-duration live-cell imaging. Temperature was maintained by heating the imaging objective lens and glass prism using objective heaters (MTC-HLS-025/TC-HLS-025, Bioscience Tools, San Diego, CA). The imaging duration was less than 30 min. Transgenic Hues6 cells expressing mEos3-HP1α were seeded on glass bottom dishes with phenol-red free TeSR 30 min prior to imaging. For 250 ml of colorless TeSR, 500 µl of FGF-2, and 30 µl of TGFb1 were added to prevent cell differentiation. To minimize adverse phototoxicity, 1mW 405 nm laser was used to activate mEos3 for 5 s, followed by bleach-and-blink acquisition using the 561-nm laser at 40 mW for ~23 s with 4000 frames. Approximately 26 mW from the 561-nm laser and 200 µW from the 450-nm laser were delivered to the back aperture of the light sheet condenser objective. The exposure time was 50 ms and the frame size was 75×89 pixels. For imaging fixed cells, we used a custom-designed system and paired a 300- mm tube lens with a 63× Zeiss objective. The effective magnification was 114×, yielding a pixel size of 135 nm. For live cell imaging, we coupled light sheet into a commercial Ziess microscope with a 63× magnification, yielding a pixel size of 254 nm. A 2.5× magnifier can be used to further reduce the pixel size to 102 nm. Bayesian bleach-and-blink (3B) image reconstruction The Bayesian method developed by Cox et al. ( Cox et al. 2012 ; Rosten et al. 2013 ) globally analyzes sequential frames and applies a statistical model to infer the best possible distribution of molecules using their blinking and bleaching properties across different frames. Spatially overlapping fluorophores are allowed in any particular frames and molecules are resolved by a priori knowledge about the proceeding frames and a posteriori estimates of the bleaching and blinking of the molecules in the subsequent frames. Termed 3B for Bayesian bleaching and blinking analysis, the method harnesses single molecules from high-density areas and substantially shifts the burden from data acquisition to post-processing ( Lidke 2012 ). Thorough discussion of the Bayesian theory and models of the bleaching and blinking properties of the molecules can be found in the literature ( Cox et al. 2012 ; Rosten et al. 2013 ). Prior to Bayesian analysis, we collected a set of standard STORM data using light-sheet illumination and analyzed the brightness and size distribution of the single-molecule events. The Bayesian code assumes a log-normal distribution, which closely characterizes our identified brightness ( R 2 = 0.9982) and size ( R 2 = 0.9957) values of the single-molecule events ( Additional file 3: Figure S3 ). In comparison to the exponential distribution commonly used for single-molecule analysis, the observed log-normal distribution is attributed by the thresholding in localization analysis and the fact that brightness and lifetime measurements are frame-rate limited and typically do not cover the entire lifespan of the molecule. We ported the Bayesian bleach-and-blink code to a supercomputing cluster Hopper at the National Energy Research Scientific Computing (NERSC) Center at the Lawrence Berkeley National Laboratory. For image reconstruction, over-exposed images at the beginning of the acquisition were discarded and subsequent 400 images (saved as fits files) were selected for processing. The 3B analysis was parallelized by dividing the image into 10-by-10-pixel sub-masks, each with a 50% horizontal and vertical overlap with its neighbors to eliminate edge artifacts. A Python-MPI wrapper was used to distribute the Bayesian calculation to a number of processors equal to the number of sub- masks. For a 128-by-128-pixel image, approximately 2,500 CPU hours were consumed. Details of the Bayesian algorithm and its implementation are discussed in Additional file 4: Note S1 . We also provided an alternative computing resource openly distributed via Amazon and using its Elastic Cloud Computing (EC2) service for labs without the access to supercomputing resources ( Hu et al. 2013 ).
📊 Figures
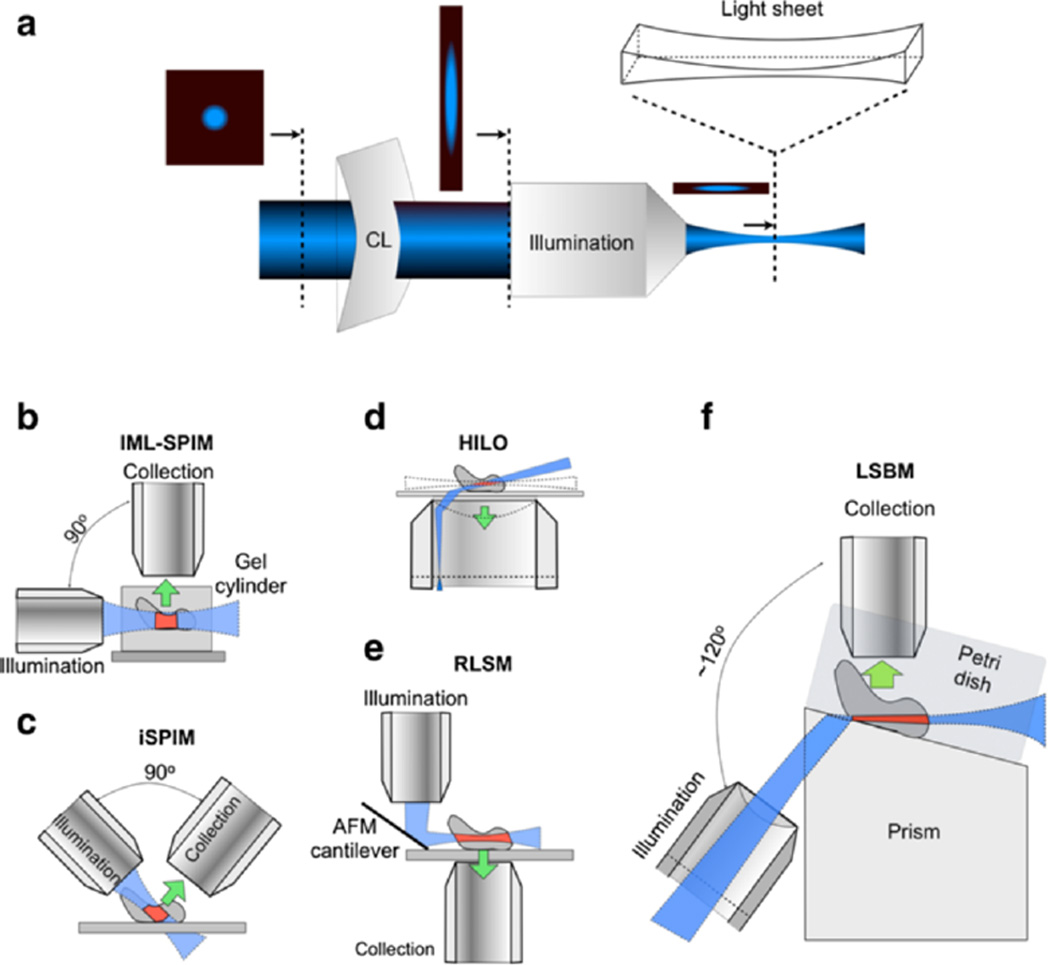
Figure 1
Illustration demonstrating (a) generation of the laser light sheet, and various light-sheet implementations including: (b) individual molecule localization-selective plane illumination microscopy (IML...
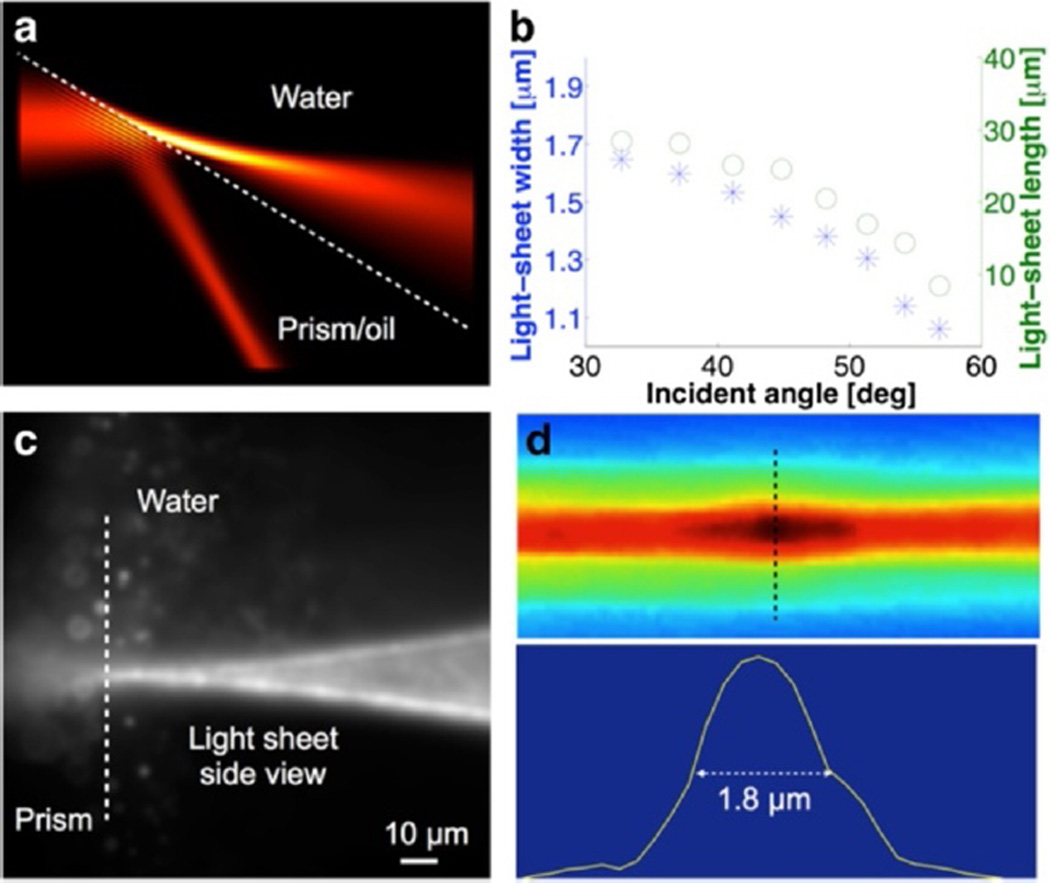
Figure 2
Characterization of the light sheet profile
(a) Electromagnetic simulation of the intensity of a focused Gaussian beam at the interface. (b) Width and length of the light sheet at various incident angles at the interface calculated from the int...
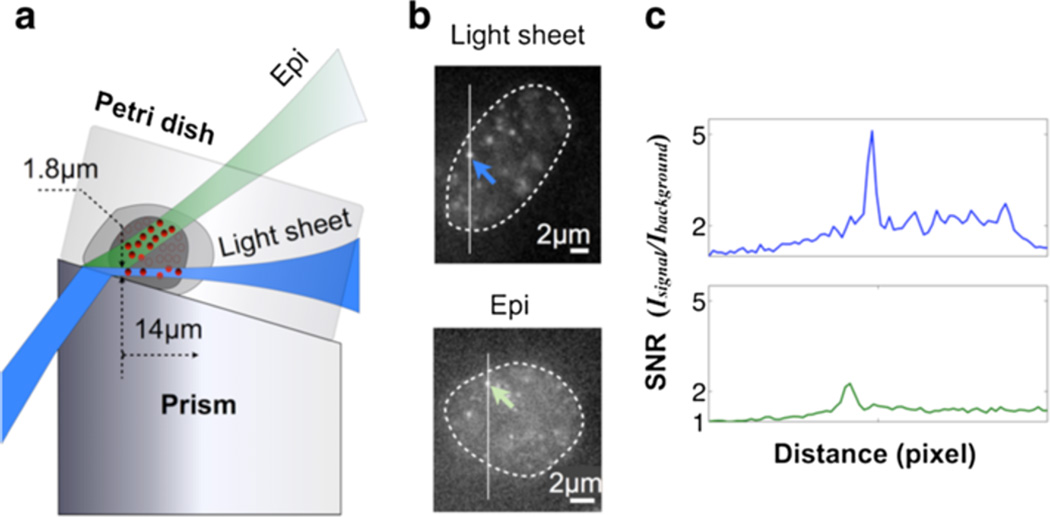
Figure 3
Light sheet illumination provides enhanced SNR for single-molecule imaging in the nucleus
(a) Schematic depiction of the light-sheet and epi-illumination. (b) Single-molecule images collected from light-sheet (top) and epi-illumination (bottom) of the nucleus of fixed Hues6 (hESC) cells ex...
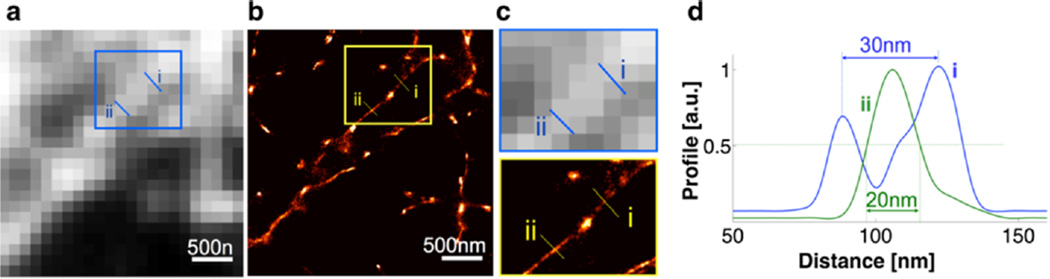
Figure 4
Bayesian reconstruction of microtubule fibers
(a) Conventional fluorescent image of the microtubules in a fixed U2OS cell. (b) Bayesian reconstruction of the superresolution image of (a) obtained from 642-nm light sheet illumination. (c) High-mag...
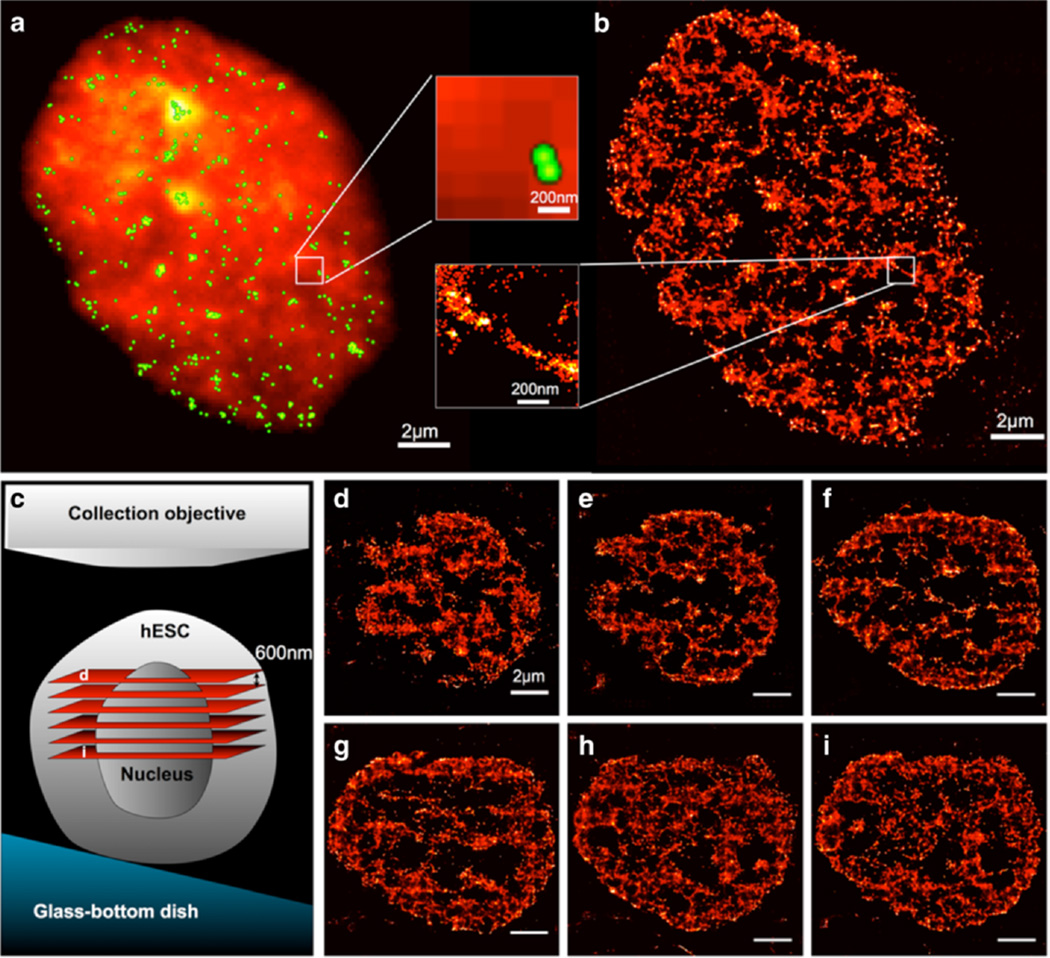
Figure 5
Light sheet Bayesian microscopy reveals the distribution of heterochromatin protein HP1u03b1 in an H1 cell
(a) Frame-averaged conventional fluorescent image of the distribution of mEos-tagged heterochromatic protein HP1u03b1 in a hESC (H1). Green dots are localizations generated by quickPALM using the same...
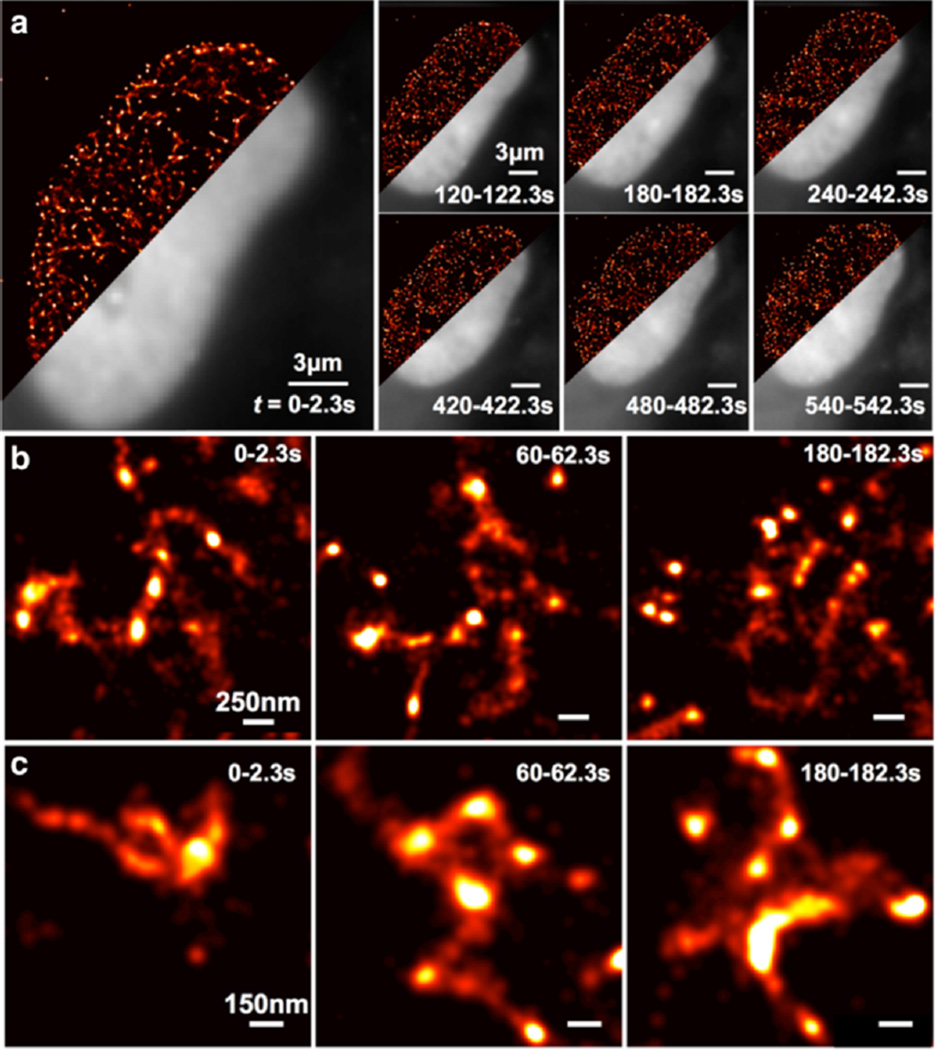
Figure 6
Super-resolution live cell imaging of the dynamics of HP1u03b1 in a Hues6 cell
(a) Light-sheet imaging of HP1u03b1 in a living Hues6 cell with 2.3-s data acquisitions. Grey areas denote the frame-average conventional fluorescent images and the red areas denote the superresolutio...
Figure images are served from the NIH/NLM PubMed Central Open Access Subset or Europe PMC; copyright remains with the publishers and authors.
💬 Discussion
0 commentsNo comments yet. Be the first to start a discussion!
Leave a Comment