Abstract
Abstract Soluble aggregates of the microtubule-associated protein tau have been challenging to assemble and characterize, despite their important role in the development of tauopathies. We found that sequential hyperphosphorylation by protein kinase A in conjugation with either glycogen synthase kinase 3β or stress activated protein kinase 4 enabled recombinant wild-type tau of isoform 0N4R to spontaneously polymerize into small amorphous aggregates in vitro. We employed tandem mass spectrometry to determine the phosphorylation sites, high-resolution native mass spectrometry to measure the degree of phosphorylation, and super-resolution microscopy and electron microscopy to characterize the morphology of aggregates formed. Functionally, compared with the unmodified aggregates, which require heparin induction to assemble, these self-assembled hyperphosphorylated tau aggregates more efficiently disrupt membrane bilayers and induce Toll-like receptor 4-dependent responses in human macrophages. Together, our results demonstrate that hyperphosphorylated tau aggregates are potentially damaging to cells, suggesting a mechanism for how hyperphosphorylation could drive neuroinflammation in tauopathies.
🔬 Techniques
🧬 Organisms
💻 Software
✨ Fluorophores
🧪 Sample Preparation
🔬 Cell Lines
🏭 Microscope Brands
🧪 Reagent Suppliers
🔴 Lasers
📷 Detectors
🔎 Objectives
🎨 Filters
💻 Software Details
💻 Code & Software
💾 Data Repositories
🏛️ Research Organizations (ROR)
Affiliated research institutions:
📋 Methods
Protein expression and purification Human 0N4R tau was expressed as previously described 26 . In brief, pRK172 plasmids (gift from Michel Goedert) expressing full-length tau (isoform 0N4R) wild-type were transformed in BL21(DE3) cells. Transformed E. coli BL21 cells were grown in Luria Broth media containing 100 μg/mL ampicillin at 37 °C under shaking conditions until OD 600 of 0.6 was reached, and tau expression was induced by the addition of 1 mM IPTG for 4 h. Cells were then harvested by centrifugation at 4000 × g (JA-20 rotor, Beckman Coulter) for 30 min at 4 °C, resuspended in lysis buffer (50 mM MES [pH 6.0] with 2,5 mM TCEP, 1 mM AEBSF), and lysed using a probe sonicator (1 × 1.5 min, 5 s on, 10 s off, 40% amplitude). The cell debris was subsequently removed by centrifugation for 30 min at 18,000 × g at 4 °C. RNase and DNase were added before the supernatant was filtered and loaded onto a Resource S ion exchange column (GE Healthcare). Protein was eluted over a linear NaCl gradient from 0 to 500 mM, and fractions containing tau protein (determined by SDS-PAGE) were pooled and precipitated with 20% ammonium sulfate at 4 °C for 1 h. The protein was pelleted at 15,000 × g for 20 min at 4 °C. After the pellet was resuspended in SSPE buffer with 2.5 mM TECP and 0.1 mM PMSF, the protein was further purified using size-exclusion chromatography with a Superdex 200 Increase 10/300 size-exclusion column (GE Healthcare Life Sciences). The fractions were collected and analyzed by SDS-PAGE, and those having the purest bands corresponding to tau were pooled. The protein concentration was then determined by measuring its absorbance at 280 nm on a Nanodrop 2000 using an extinction coefficient of 7450 M −1 cm −1 and by BCA assay (Thermo Fisher) following the manufacture protocol. Aliquots were flash-frozen in liquid nitrogen and stored at −80 °C. In vitro phosphorylation of recombinant tau Full-length recombinant tau (0N4R) was sequentially phosphorylated as described previously 10 . Monomeric tau was incubated at a final concentration of 50 μM in 25 mM Tris-HCl buffer [pH 7.4] (Sigma–Aldrich) with 0.1 mM ethylene glycol tetraacetic acid (EGTA, Sigma–Aldrich), 2 mM AEBSF protease inhibitor (Sigma–Aldrich), 10 mM magnesium acetate, 2 mM ATP (Sigma–Aldrich). U of the catalytic subunits of cAMP-dependent protein kinase A (PKA, BioVision) per nmol of tau was added and the reaction was incubated at 30 °C. After 24 h, the second kinase (GSK-3β or SAPK4 from Abcam, 0.018 U per nmol of tau) was added and the reaction proceeded for an additional 24 h. One unit of the kinase is defined as the amount of enzyme that will transfer one nmol phosphate from ATP to the corresponding substrate per min at pH 7.4 at 30 °C, tested and reported by individual manufacturers. Phosphorylation was confirmed in sodium dodecyl sulfate-polyacrylamide gel electrophoresis (SDS-PAGE). Residual LPS is also known as endotoxin derived from the outer cell membrane of gram-negative bacteria can elicit TLR4 signaling. To ensure that our results were not confounded by the residual LPS in our tau proteins purified from bacterial cultures, LPS contamination was effectively eliminated after phosphorylation reactions by using high-capacity endotoxin removal spin columns (Thermo Fisher). This column has been shown to effectively remove contaminating endotoxins (i.e., residual lipopolysaccharides) in protein samples purified from bacterial cultures without introducing other bioactive species. Our endotoxin quantification results subsequently indicated that at 2 μM WT tau contained 0.47 ± 0.05 EU/mL, g-tau, 0.37 ± 0.13 EU/mL, and s-tau 0.43 ± 0.25 EU/mL with PBS buffer control 0.13 ± 0.03 EU/mL. After endotoxin removal, the protein concentration was then determined by Nanodrop and by BCA assay as mentioned above. Aliquots at 40 μM were flash-frozen in liquid nitrogen and stored at −80 °C. Liquid chromatography-tandem mass spectrometry (LC-MS/MS) Detailed phosphorylation mapping was obtained from LC-MS/MS analysis conducted by Cambridge Center for Proteomics, and the measurements were repeated across three independent experiments for both g-tau and s- tau proteins to ensure reproducibility. Phosphorylation sites observed across three repeats were highlighted in Supplementary Table 1 for each species. Variations due to the behavior of the tryptic peptides in the instrument were minimal. Protein solutions were reduced (DTT), alkylated (iodoacetamide), and enzymatically digested in 50 mM ammonium bicarbonate [pH 8] with trypsin overnight at 37 °C. After digestion, the supernatant was pipetted into a sample vial and loaded onto an autosampler for automated LC-MS/MS analysis. All LC-MS/MS experiments were performed using a Dionex Ultimate 3000 RSLC nanoUPLC (Thermo Fisher Scientific Inc, Waltham, MA, USA) system and a QExactive Orbitrap mass spectrometer (Thermo Fisher Scientific Inc, Waltham, MA, USA). Separation of peptides was performed by reverse-phase chromatography at a flow rate of 300 nL/min and a Thermo Scientific reverse-phase nano Easy-spray column (Thermo Scientific PepMap C18, 2 μm particle size, 100 A pore size, 75 μm i.d. × 50 cm length). Peptides were loaded onto a pre-column (Thermo Scientific PepMap 100 C18, 5 μm particle size, 100 A pore size, 300 μm i.d. × 5 mm length) from the Ultimate 3000 autosampler with 0.1% formic acid for 3 min at a flow rate of 10 μL/min. After this period, the column valve was switched to allow the elution of peptides from the pre-column onto the analytical column. Solvent A was water + 0.1% formic acid and solvent B was 80% acetonitrile, 20% water + 0.1% formic acid. The linear gradient employed was 2–40% B in 30 min. The LC eluant was sprayed into the mass spectrometer by means of an Easy-Spray source (Thermo Fisher Scientific Inc.). All m/z values of eluting ions were measured in an Orbitrap mass analyzer, set at a resolution of 35,000, and was scanned between m/z 380 and 1500. Data-dependent scans (Top 20) were employed to automatically isolate and generate fragment ions by higher-energy collisional dissociation (HCD, NCE:25%) in the HCD collision cell and measurement of the resulting fragment ions was performed in the orbitrap analyzer, set at a resolution of 17,500. Singly charged ions and ions with unassigned charge states were excluded from being selected for MS/MS and a dynamic exclusion window of 20 s was employed. Post-run, all MS/MS data were converted to mgf files, and the files were then submitted to the Mascot search algorithm (Matrix Science, London UK) and searched against the UniProt Human database (93,609 sequences; 37,041,084 residues) and a common contaminant sequence containing non-specific proteins such as keratins and trypsin (125 sequences; 41,129 residues). Variable modifications of oxidation (M), deamidation (NQ), and phosphorylation (S,T,Y) were applied as well as fixed modification of carbamidomethyl (C). The peptide and fragment mass tolerances were set to 20 ppm and 0.1 Da. A significance threshold value of p < 0.05 and a peptide cutoff score of 20 were also applied.
Show full methods section
Protein expression and purification Human 0N4R tau was expressed as previously described 26 . In brief, pRK172 plasmids (gift from Michel Goedert) expressing full-length tau (isoform 0N4R) wild-type were transformed in BL21(DE3) cells. Transformed E. coli BL21 cells were grown in Luria Broth media containing 100 μg/mL ampicillin at 37 °C under shaking conditions until OD 600 of 0.6 was reached, and tau expression was induced by the addition of 1 mM IPTG for 4 h. Cells were then harvested by centrifugation at 4000 × g (JA-20 rotor, Beckman Coulter) for 30 min at 4 °C, resuspended in lysis buffer (50 mM MES [pH 6.0] with 2,5 mM TCEP, 1 mM AEBSF), and lysed using a probe sonicator (1 × 1.5 min, 5 s on, 10 s off, 40% amplitude). The cell debris was subsequently removed by centrifugation for 30 min at 18,000 × g at 4 °C. RNase and DNase were added before the supernatant was filtered and loaded onto a Resource S ion exchange column (GE Healthcare). Protein was eluted over a linear NaCl gradient from 0 to 500 mM, and fractions containing tau protein (determined by SDS-PAGE) were pooled and precipitated with 20% ammonium sulfate at 4 °C for 1 h. The protein was pelleted at 15,000 × g for 20 min at 4 °C. After the pellet was resuspended in SSPE buffer with 2.5 mM TECP and 0.1 mM PMSF, the protein was further purified using size-exclusion chromatography with a Superdex 200 Increase 10/300 size-exclusion column (GE Healthcare Life Sciences). The fractions were collected and analyzed by SDS-PAGE, and those having the purest bands corresponding to tau were pooled. The protein concentration was then determined by measuring its absorbance at 280 nm on a Nanodrop 2000 using an extinction coefficient of 7450 M −1 cm −1 and by BCA assay (Thermo Fisher) following the manufacture protocol. Aliquots were flash-frozen in liquid nitrogen and stored at −80 °C. In vitro phosphorylation of recombinant tau Full-length recombinant tau (0N4R) was sequentially phosphorylated as described previously 10 . Monomeric tau was incubated at a final concentration of 50 μM in 25 mM Tris-HCl buffer [pH 7.4] (Sigma–Aldrich) with 0.1 mM ethylene glycol tetraacetic acid (EGTA, Sigma–Aldrich), 2 mM AEBSF protease inhibitor (Sigma–Aldrich), 10 mM magnesium acetate, 2 mM ATP (Sigma–Aldrich). U of the catalytic subunits of cAMP-dependent protein kinase A (PKA, BioVision) per nmol of tau was added and the reaction was incubated at 30 °C. After 24 h, the second kinase (GSK-3β or SAPK4 from Abcam, 0.018 U per nmol of tau) was added and the reaction proceeded for an additional 24 h. One unit of the kinase is defined as the amount of enzyme that will transfer one nmol phosphate from ATP to the corresponding substrate per min at pH 7.4 at 30 °C, tested and reported by individual manufacturers. Phosphorylation was confirmed in sodium dodecyl sulfate-polyacrylamide gel electrophoresis (SDS-PAGE). Residual LPS is also known as endotoxin derived from the outer cell membrane of gram-negative bacteria can elicit TLR4 signaling. To ensure that our results were not confounded by the residual LPS in our tau proteins purified from bacterial cultures, LPS contamination was effectively eliminated after phosphorylation reactions by using high-capacity endotoxin removal spin columns (Thermo Fisher). This column has been shown to effectively remove contaminating endotoxins (i.e., residual lipopolysaccharides) in protein samples purified from bacterial cultures without introducing other bioactive species. Our endotoxin quantification results subsequently indicated that at 2 μM WT tau contained 0.47 ± 0.05 EU/mL, g-tau, 0.37 ± 0.13 EU/mL, and s-tau 0.43 ± 0.25 EU/mL with PBS buffer control 0.13 ± 0.03 EU/mL. After endotoxin removal, the protein concentration was then determined by Nanodrop and by BCA assay as mentioned above. Aliquots at 40 μM were flash-frozen in liquid nitrogen and stored at −80 °C. Liquid chromatography-tandem mass spectrometry (LC-MS/MS) Detailed phosphorylation mapping was obtained from LC-MS/MS analysis conducted by Cambridge Center for Proteomics, and the measurements were repeated across three independent experiments for both g-tau and s- tau proteins to ensure reproducibility. Phosphorylation sites observed across three repeats were highlighted in Supplementary Table 1 for each species. Variations due to the behavior of the tryptic peptides in the instrument were minimal. Protein solutions were reduced (DTT), alkylated (iodoacetamide), and enzymatically digested in 50 mM ammonium bicarbonate [pH 8] with trypsin overnight at 37 °C. After digestion, the supernatant was pipetted into a sample vial and loaded onto an autosampler for automated LC-MS/MS analysis. All LC-MS/MS experiments were performed using a Dionex Ultimate 3000 RSLC nanoUPLC (Thermo Fisher Scientific Inc, Waltham, MA, USA) system and a QExactive Orbitrap mass spectrometer (Thermo Fisher Scientific Inc, Waltham, MA, USA). Separation of peptides was performed by reverse-phase chromatography at a flow rate of 300 nL/min and a Thermo Scientific reverse-phase nano Easy-spray column (Thermo Scientific PepMap C18, 2 μm particle size, 100 A pore size, 75 μm i.d. × 50 cm length). Peptides were loaded onto a pre-column (Thermo Scientific PepMap 100 C18, 5 μm particle size, 100 A pore size, 300 μm i.d. × 5 mm length) from the Ultimate 3000 autosampler with 0.1% formic acid for 3 min at a flow rate of 10 μL/min. After this period, the column valve was switched to allow the elution of peptides from the pre-column onto the analytical column. Solvent A was water + 0.1% formic acid and solvent B was 80% acetonitrile, 20% water + 0.1% formic acid. The linear gradient employed was 2–40% B in 30 min. The LC eluant was sprayed into the mass spectrometer by means of an Easy-Spray source (Thermo Fisher Scientific Inc.). All m/z values of eluting ions were measured in an Orbitrap mass analyzer, set at a resolution of 35,000, and was scanned between m/z 380 and 1500. Data-dependent scans (Top 20) were employed to automatically isolate and generate fragment ions by higher-energy collisional dissociation (HCD, NCE:25%) in the HCD collision cell and measurement of the resulting fragment ions was performed in the orbitrap analyzer, set at a resolution of 17,500. Singly charged ions and ions with unassigned charge states were excluded from being selected for MS/MS and a dynamic exclusion window of 20 s was employed. Post-run, all MS/MS data were converted to mgf files, and the files were then submitted to the Mascot search algorithm (Matrix Science, London UK) and searched against the UniProt Human database (93,609 sequences; 37,041,084 residues) and a common contaminant sequence containing non-specific proteins such as keratins and trypsin (125 sequences; 41,129 residues). Variable modifications of oxidation (M), deamidation (NQ), and phosphorylation (S,T,Y) were applied as well as fixed modification of carbamidomethyl (C). The peptide and fragment mass tolerances were set to 20 ppm and 0.1 Da. A significance threshold value of p < 0.05 and a peptide cutoff score of 20 were also applied.
High-resolution native mass spectrometry
The protein samples were stored in phosphorylation reaction buffer at −80 °C before being buffer exchanged into 200 mM ammonium acetate [pH 6.8] by multiple rounds of concentration and dilution using the Pierce TM protein concentrators (Thermo Fisher). Finally, the samples were diluted to a monomer equivalent concentration of 1 mM before the measurements. The data was collected using in-house gold-plated capillaries on a Q Exactive TM mass spectrometer in positive ion mode with a source temperature of 70 °C and a capillary voltage of 1.2 kV. In-source trapping was set to −120 V to help with the dissociation of small ion adducts. Ion transfer optics and voltage gradient throughout the instruments were optimized for ideal transmission. Spectra were acquired with 10 microscans to increase the signal-to-noise ratio with transient times of 64 ms, corresponding to the resolution of 17,500 at m/z = 200, and AGC target of 1.0 × 10 6 . The noise threshold parameter was set to 3 and the scan ranges used were 346–14,147 and 1000–10,000 m/z for g- and s-tau, respectively. The measurements were repeated across three independent experiments for both g-tau and s- tau proteins to ensure reproducibility. Mass deconvolution was achieved using the UniDec software as previously described 73 . Before deconvolution, the data were pre-processed by setting the curved subtraction to ten, which resulted in significantly more baseline-resolved peaks. Further, the fitted peak FWHM was optimized for each spectrum (generally within 0.5 and 1 Th). All other UniDec parameters were left at their default values. The deconvolution was performed in the mass range of 40–44 kDa. The estimation of the degree of phosphorylation was complicated by small ion adducts present in the deconvoluted mass spectra, which extend the range of masses associated with any particular phosphorylation state, as well as possibly cause some mass overlap. To find the optimal distribution of phosphate groups that explained the deconvoluted mass spectrum, as well as the uncertainty of this assignment, a Markov Chain Monte Carlo assignment method was employed. This was done using the emcee python package as previously described 74 ([1202.3665] emcee: The MCMC Hammer (arxiv.org)). The masses of one phosphate group and one small ion adduct were set to 80 and 23 Da, respectively. The mass of the small ion adduct was chosen so that it is within the integration window of 10 Da. Two most probable adducts were the ammonium and sodium cations. The priors used for fitting were the number of the phosphate groups and small ion adducts which were kept below 50, independently. The limits were chosen for time efficiency and to keep make sure the combined mass of the phosphate groups was not likely to go above the 44 kDa limit of the deconvolved mass spectrum. Six chains were run for 3000 steps each: the first 800 steps were discarded as a burn-in, and the rest was thinned by a factor of 100 to reduce any autocorrelation. The thinned chains were then used to estimate the extent of phosphorylation by summing the area under the curve (to account for the inherent broadness of the deconvolved mass peaks, as well as the fact that there are two possible small adduct ions) in corresponding mass regions using a mass window of 10 Da.
Standard tau aggregation procedure
Unphosphorylated and phosphorylated tau protein was used. Monomers were incubated at 2 μM in PBS buffer (137 mM NaCl, 3 mM KCl, 8 mM Na 2 HPO 4 , 1.5 mM KH 2 PO 4 , pH 7.3) with 0.01% NaN 3 at 37 °C. Heparin (Fisher Scientific) was added at 10 μg/ mL (about 2 μM) to induce aggregation. Self-assembly reactions were rather carried out in the absence of heparin. SDS-PAGE Protein samples along with molecular weight marker (SeeBlue™ Plus 2 Pre-Stained Standard) were loaded into the wells of 4–12% gradient NuPAGE Bis-Tris precast gels or 10% self-cast SDS-PAGE gels and run in MOPS-based SDS running buffer for 55 min at 200 V. The proteins were visualized by Coomassie stain.
Single-molecule TIRF microscopy Instrumentation
The samples were imaged using a home-built total internal reflection fluorescence (TIRF) microscope. The total internal reflection mode limits the fluorescence field to 200 nm from the sample slide. For pFTAA imaging, a 488 nm diode laser (TOPTICA iBeam smart, 175 mW) was aligned and directed to the optical axis at the edge of a TIRF objective (Apo TIRF 100 × /NA1.49 oil objective, Nikon) mounted on an inverted microscope (Eclipse T i -S, Nikon). The emitted fluorescence was collected by the same objective, separated from the returning TIRF beam by a dichroic mirror (Di01-R405/488/532/635-25 × 36, Semrock), and passed through an emission filter (FF552-Di02-25 × 36, Semrock). For ThX super-res imaging, the same 488 nm laser was used, but a different set of emission filters (LP02-568RS-25, FF01-587/35-25, Semrock) was utilized to acquire the optimal super-resolution images. The control of the hardware was enabled by custom-written scripts for MicroManager (NIH). The signal was recorded on an Evolve Delta 512 EMCCD camera (Photometrics) Each pixel was 107.2 nm in length such that the dimensions of a single image taken were 54.8 by 54.8 μm 2 . The switch from TIRF to widefield mode was accomplished by altering the beam offset perpendicular to the optical axis. To simultaneously track calcium transients and ROS level changes, a 488 nm diode laser (TOPTICA iBeam smart, 175 mW) and a 638 nm laser (Cobolt 06-MLD, 180 mW) were aligned and directed to the optical axis of a ×20 objective (Nikon) mounted on an inverted microscope (Eclipse T i -S, Nikon). The emitted fluorescence was collected by the same objective, separated from the returning beam by a dichroic mirror (Di01-R405/488/532/635-25 × 36, Semrock), and passed through an emission filter (FF580-FDi01-25 × 36, Semrock for 488 nm excitation and BLP01-635R-25, Semrock for 638 nm excitation). Each channel was recorded alternatingly at a 1 s temporal resolution, and each frame had an exposure time of 100 ms.
Sample preparation for TIRF imaging
Prior to imaging, Borosilicate glass coverslips (Ø50 mm, VWR International) were cleaned using an argon plasma cleaner (PDC-002, Harrick Plasma) for 1 h to remove any autofluorescent residue. Multiwell slide chambers (CultureWell chambered cover glass 50 well, Grace Bio-Laboratories) were affixed onto the cleaned coverslips. To stain the aggregates for diffraction-limited imaging, samples were diluted in PBS buffer containing 30 nM pFTAA (gift from Michel Goedert) to a final monomer equivalent concentration of 67 nM tau. Then 15 μL of each sample was applied to each well on the coverslip for 15 min before imaging. Images were recorded for 100 frames, each with an exposure time of 50 ms. The image stacks were averaged using ImageJ (NIH) software for further analysis. To super-resolve the structures of tau aggregates, especially the early aggregate species whose lengths are under 100–200 nm, ThX, a synthetic variant of well-documented Thioflavin T (ThT), was used. After the coverslips being plasma cleaned, the surface was washed with PBS buffer and coated with poly-L-lysine (PLL, 1 mg/mL) for 15 min to reduce non-specific binding events. After gently removing the excess PLL coating, gold nanoparticles with 200 nm diameter size were applied onto the surface for 5 min, serving as fiducial markers to correct thermal drift during imaging. The surface was then incubated with protein aggregates for 20 min. Subsequently, samples were imaged in the presence of 1 μM ThX dye dissolved in PBS buffer. Note that one or two washes with PBS between each surface treatment procedure, i.e., PLL coating, gold nanoparticles application, and protein incubation, are recommended to obtain the optimal imaging condition. Images were recorded for 10,000 frames, each with an exposure time of 20 ms.
Diffraction-limited image analysis
For each sample, 16 fields of view were typically recorded. Individual image data were averaged overall the framed by ImageJ (NIH) software and then analyzed with a custom-written MATLAB script as previously described 75 (R2018b, MathWorks) to count the total number of fibrils and aggregates, the size, and fluorescence intensity. Since both the concentrations of protein and pFTAA were controlled in each experiment, the number and the intensity of fibrils and aggregates can be directly compared across different experiments. For particle identification, images were bandpass filtered to remove the modulated background and camera noise. To identify particle boundaries, the foreground was then blurred using a 2D-Gaussian filter with a threshold applied based on the pixel intensity with a criterion of 2% intensity above the background (median value of the whole image). The length of aggregates was measured by thinning boundaries of individual particles and then calculated with an image pixel size of 107.2 nm for our TIRF setup. To eliminate the background effect in our intensity calculation, signal-to-background ratio (SBR) was introduced to correct the intensity of pixels, where the SBR is defined as: 1 documentclass[12pt]{minimal} usepackage{amsmath} usepackage{wasysym} usepackage{amsfonts} usepackage{amssymb} usepackage{amsbsy} usepackage{mathrsfs} usepackage{upgreek} setlength{oddsidemargin}{-69pt} begin{document}$${{{{{{mathrm{SBR}}}}}}}=frac{{{{{{{mathrm{Intensity}}}}}}},{{{{{{mathrm{above}}}}}}},{{{{{{mathrm{the}}}}}}},{{{{{{mathrm{background}}}}}}}}{{{{{{{mathrm{Background}}}}}}}}$$end{document} SBR = Intensity above the background Background For a given particle, its corrected intensity is the sum of each pixel’s SBR values within its boundary.
Super-resolution image analysis
The raw image stacks were passed through a custom-written Python script as previously described 76 . We defined a localization as 2D-Gaussian fit of a fluorescence signal in one image frame. The localizations were determined using the ‘Peak Fit’ plugin within Fiji (ImageJ)/GDSC Single Molecule Light Microscopy package ( http://www.sussex.ac.uk/gdsc/intranet/microscopy/UserSupport/AnalysisProtocol/imagej/gdsc_plugins/ ). The adjustable parameters ‘signal strength’ and ‘precision’ were set to 3 and 30 nm, respectively. These values referred to the properties of the 2D-Gaussian fit and were set by visual inspection of the rendered localization images. The fiducial markers of the images were pinpointed as localizations that lasted more than 500 frames at the same location. Fiducial signals were first removed from the localization file from the subsequent analysis. Then image stacks went through temporal grouping, which sorted localizations into bursts. Temporal grouping was achieved by (1) using DBSCAN clustering function (scikit-learn) on the spatial domain (XY coordinates) of the localizations, with a detection radius (epsilon) of 15 nm and minimum point threshold of 3. (2) using DBSCAN again on the temporal domain (frame number) with an epsilon of 21 ms and a minimal frame number of 2 to recognize individual bursts and remove single frame localizations. The rationale of the settings here is that many non-specific binding events are characterized by short transient signals that last less than the exposure time of the camera. Finally, the burst information was processed through a final DBSCAN cluster analysis on the spatial domain using an epsilon of 200 nm and a minimal burst number of 20 to group the bursts into clusters, which were interpreted as detections of individual super-resolved protein aggregates. For each cluster analyzed, the number of bursts ranged from 34 to 3356. Subsequently, we structurally characterized the sizes of clusters by (1) scaling the spatial domain by eight times and rounding the coordinates to integers; (2) closing the morphological space between bursts using the scikit-image ‘closing’ function; (3) skeletonizing the closed shape to a width of a single pixel using the scikit-image ‘skeletonize_3d’ function; (4) calculating the lengths by traversing the skeleton and recording the 8-connectivity distances. Finally, the clusters were loaded into the ‘Results Manager’ plugin in Fiji/GDSC SMLM and rendered into super-resolution images with each cluster labeled and characterized.
Fourier ring correlation analysis
The resolution was determined by plotting a Fourier ring correlation curve with the FIRE plugin 77 for ImageJ/Fiji and the spatial frequency was determined at which the curve drops below 1/7. In vitro membrane permeabilization assay Liposomal penetration assay was conducted as described previously 30 . To prepare the lipid vesicles, 16:0–18:1 PC (10 mg/mL) and 18:1–12:0 Biotin PC (1 mg/mL) (Avanti Lipids) were mixed with 100:1 ratio. The lipid mixture was then hydrated in HEPES buffer (50 mM, pH 6.5) with 100 µM Cal-520 (Stratech). Five freeze-and-thaw cycles were performed using a water bath and dry ice to acquire the unilamellarity. The lipid solution was extruded at least 10 times through a membrane with a size cutoff of 200 nm, and the size of the vesicles was measured using a Zetasizer (Zetasizer Nano ZSP). Free dyes were removed using size-exclusion chromatography. To prepare the surface, glass coverslips (VWR International, product number 63 1-0122) were cleaned by sonicating in 2% (v/v) Hellmanex III (Hellma GmbH & Co. KG) in Milli-Q water for 10 min followed by sonicating twice in Milli-Q water and methanol for 10 min, respectively. Then the coverslips were dried under a stream of nitrogen gas, and plasma-etched using an argon plasma cleaner (PDC-002, Harrick Plasma) for 1 h to remove any fluorescent impurities. Each cover slide was fixed by frame-seal incubation chambers (Biorad, Hercules) and the surface was coated with 100:1 PLL-g-PEG and PLL-g-PEG biotin (SuSoS AG) (1 g/L) in 50 mM HEPES buffer. Then the coverslips were washed three times and 0.1 mg/mL neutravidin (Thermo Scientific) solution was added to the coverslips and incubated for 15 min and washed three times with reaction buffer. Then, a 50 µL aliquot of the solution of purified biotinylated vesicles was added to the surface and incubated for 30 min before washing carefully at least five times with reaction buffer. Single vesicles tethered to borosilicate glass cover slides via biotin neutravidin linkage were incubated with 50 µL Ca 2+ containing buffer solution Leibovitz’s L-15 (phenol red-free) and a background image was recorded (F background ). Fifty microliters of the sample was added, images were acquired (F sample ), and care was taken to avoid moving the glass coverslips during the addition of each sample. Next, 10 µL of a solution containing 1 mg/mL of ionomycin, an ionophore for Ca 2+ ion, and subsequently images of Ca 2+ saturated single vesicles in the same fields of view were acquired (F ionomycin ). For each field of view, 50 images were taken with an exposure time of 50 ms. The fields of view were chosen using an automated program via ImageJ Micromanager. The relative influx of Ca 2+ into an individual vesicle due to aggregates of tau was then determined as 2 documentclass[12pt]{minimal} usepackage{amsmath} usepackage{wasysym} usepackage{amsfonts} usepackage{amssymb} usepackage{amsbsy} usepackage{mathrsfs} usepackage{upgreek} setlength{oddsidemargin}{-69pt} begin{document}$${{{{{rm{Percent}}}}}},{{{{{rm{of}}}}}},{{{{{{rm{Ca}}}}}}}^{2+}{{{{{rm{influx}}}}}}=frac{{F}_{{{{{{mathrm{sample}}}}}}}-{F}_{{{{{{mathrm{background}}}}}}}}{{F}_{{{{{{mathrm{ionomycin}}}}}}}-{F}_{{{{{{mathrm{background}}}}}}}}$$end{document} Percent of Ca 2 + influx = F sample − F background F ionomycin − F background The average calcium influx was calculated by averaging the Ca 2+ influx into individual vesicles in each field of view. TEM To prepare samples for TEM experiments, protein solutions at an appropriate concentration (typically ~200 nM) were applied onto a carbon-coated 400-mesh copper grid (Agar Scientific) for 1 min, and then stained with 2% (v/v) uranyl acetate for another minute. The excess solution was removed from the grid by washing twice with Milli-Q water. After samples dried thoroughly, TEM images were acquired using Thermo Scientific (FEI) Talos F200X G2 microscope (Department of Chemistry, Cambridge) operated at 200 kV.
Live imaging of human macrophage THP-1 cells
Human monocytic THP-1 cells
(ATCC-TIB-202 from LGC Ltd, Middlesex, UK) were cultured in Roswell Park Memorial Institute medium (RPMI-1640, Invitrogen) culture medium supplemented with 10% of heat-inactivated fetal bovine serum (Invitrogen) in 5% CO 2 humidified atmosphere at 37 °C. THP-1 monocytes were first seeded at 200,000 cells/mL on sterilized glass coverslips. Then THP-1 cells were differentiated into macrophages in the presence of 20 ng/mL phorbol 12-myristate 13-acetate (PMA, Sigma–Aldrich) for 3 days continuously. This was followed by a recovery period of 24 h in serum-supplemented RPMI-1640 medium without PMA. Cell differentiation was verified by evaluating cell adhesion and spreading under an optical microscope. For Fluo-4 AM and ROX epifluorescence imaging, differentiated THP-1 cells are washed three times with OPTI-MEM and then incubated with 7.5 μM Fluo-4 AM and 6.25 μM CellROX Deep Red Reagent in OPTI-MEM for 30 min. To remove the free dye thoroughly, the cells are washed with OPTI-MEM three times before imaging. CellROX DeepRed reagent, weakly fluorescent while in a reduced state and exhibits photostable fluorescence upon oxidation by reactive oxygen species (ROS), is a proprietary reagent from Life Technologies. CellROX Deep Red has been reported to robustly detect a wide range of pro-oxidants, including superoxide anion, hydroxyl radical, peroxynitrite, and to a lesser extent, nitric oxide 78 , 79 .
Primary human macrophage cell culture
Blood samples were donated by healthy volunteers who had undertaken informed consent in accordance with local Research Ethics Committee approval. Peripheral blood mononuclear cells were isolated from citrated peripheral blood samples by density gradient separation using Lympholyte (Cedarlane Labs), and subsequent CD14+ positive selection using the MACS Miltenyi Biotec Human CD14 microbead protocol (Miltenyi Biotec). CD14+ cells (3 × 10 5 cells per well) were differentiated into macrophages using recombinant human granulocyte-macrophage colony-stimulating factor (200 ng/mL GM-CSF) and recombinant human interferon gamma (50 ng/ml IFNg) (Peprotech) in standard tissue culture DMEM media containing 10% fetal calf serum. The human primary monocytes were extracted from the blood from donors who gave their samples voluntarily without any compensation. They gave informed consent via a Good Clinical Practice registered member of staff from Royal Papworth Hospital NHS Foundation Trust Cambridge under local ethics committee approval (REC No. 12/WA/0148). No human-derived cells were stored after the experiments had been completed.
Macrophage calcium and ROS signal processing
Data were analyzed in MATLAB (MathWorks) using custom software. Cells were located by tracking local maxima and the intensity over time of a cell-sized disk surrounding the mean position of each cell was analyzed. The code is read in a single TIFF file representing a 3D time series. After background subtraction, flat-field correction, and Gaussian smoothing, local maxima in each frame were identified. Maxima from each frame were combined into tracks using a nearest-neighbor approach. If the standard deviation of the position was greater than half the cell radius, the track would be discarded. Otherwise, the mean position was assumed to be the location of a cell. The mean intensity of a cell-sized disk around each of these fixed positions was calculated, forming intensity traces for each cell. The noise was reduced by Gaussian smoothing. Sharp increases in calcium intensity were then identified from the first derivative and a user-defined threshold determined which of these were classified as calcium spikes. If a minimum spike intensity and/or minimum spike duration have been specified at the start, spikes not meeting these criteria were discarded. The percentage of ROS signals changed was calculated as: 3 documentclass[12pt]{minimal} usepackage{amsmath} usepackage{wasysym} usepackage{amsfonts} usepackage{amssymb} usepackage{amsbsy} usepackage{mathrsfs} usepackage{upgreek} setlength{oddsidemargin}{-69pt} begin{document}$${{{{{rm{Percent}}}}}}; {{{{{rm{of}}}}}}; {{{{{rm{ROS}}}}}}; {{{{{rm{signals}}}}}}; {{{{{rm{changed}}}}}}=frac{{F}_{{{{{{{mathrm{final}}}}}}}}-{F}_{{{{{{{mathrm{initial}}}}}}}}}{{F}_{{{{{{{mathrm{initial}}}}}}}}}$$end{document} Percent of ROS signals changed = F final − F initial F initial The initial intensity was defined by averaging the DeepRed fluorescence intensities across 50 frames prior to the addition of tau aggregates, and the final intensity was determined by averaging the DeepRed fluorescence intensities across 50 frames prior to the addition of ionomycin. Further details and the source code are available at https://github.com/janehumphrey/calciumStationaryCells .
Cell viability measurements
Cell viability was assessed using Live-or-Dye TM fixable viability staining kit (Biotium, Live-or-Dye TM 750/777), following manufacture protocol. Briefly, human monocytic THP-1 cells (ATCC) were cultured and differentiated into macrophages as described above. After being treated with different tau species of 500 nM monomeric equivalent concentration for 24 h, cells were harvested using TrypLE TM Express Enzyme (Thermo Fisher). Cells were subsequently pelleted by centrifugation at 350 × g for 5 min and the supernatants were discarded. Cells were washed once in PBS and then resuspended in PBS at 1 × 10 6 cells/mL, followed by incubation at room temperature with the viability stain (diluted 1:1000 in PBS) for 30 min. Afterward, cells were washed and resuspended in PBS and then analyzed by flow cytometry in the 633 nm channel.
LDH assay
Levels of lactate dehydrogenase (LDH) were measured by CyQUANT TM LDH cytotoxicity assay kit (Invitrogen) as an indicator of cytotoxicity, following manufacturing protocol. Briefly, human monocytic THP-1 cells (ATCC) were cultured and differentiated into macrophages as described above. After being treated with different tau species of 500 nM monomeric equivalent concentration for 24 h, 50 μL of conditioned media of each sample along with maximum LDH activity controls (generated using 10× lysis buffer) and spontaneous LDH activity controls (no treatment group) were incubated with 50 μL LDH reaction mixture in a 96-well flat-bottom plate at room temperature for 30 min. Afterward, 50 μL of stop solution was added to each sample well to quench the reaction. Absorbance was measured at 490 nm and 680 nm: before calculating the percentage of toxicity, the 680 nm absorbance value (background) must be subtracted from 490 nm absorbance, and then the percentage of cytotoxicity can be determined using the following formula: 4 documentclass[12pt]{minimal} usepackage{amsmath} usepackage{wasysym} usepackage{amsfonts} usepackage{amssymb} usepackage{amsbsy} usepackage{mathrsfs} usepackage{upgreek} setlength{oddsidemargin}{-69pt} begin{document}$${{{{{rm{Percent}}}}}}; {{{{{rm{of}}}}}}; {{{{{rm{cytotoxicity}}}}}}=frac{{{{{{{{mathrm{LDH}}}}}}}}_{{{{{{{mathrm{sample}}}}}}}}-{{{{{{{mathrm{LDH}}}}}}}}_{{{{{{{mathrm{spontaneous}}}}}}}}}{{{{{{{{mathrm{LDH}}}}}}}}_{{{{{{{mathrm{maximum}}}}}}}}-{{{{{{{mathrm{LDH}}}}}}}}_{{{{{{{mathrm{spontaneous}}}}}}}}}$$end{document} Percent of cytotoxicity = LDH sample − LDH spontaneous LDH maximum − LDH spontaneous Enzyme-linked immunosorbent assay (ELISA) The levels of TNF-α, IL-1β, and CCL5 secreted into the cell supernatant were measured by Abcam ELISA kits respectively (ab181421; ab214025; ab174446) following the manufacture protocol. Ultrapure LPS E. coli O111:B4 (Cayman Chemical, CAY-28872-10mg) was used as a positive control to elicit robust TLR4 activation, while small molecule inhibitors TAK-242 (Tocris Bioscience) and Ultrapure RsLA (InvivoGen) were employed to block TLR4 activation and therefore to validate the involvement of TLR4 receptor. Total protein concentrations were then determined by Pierce BCA assay following the manufacture protocol to ensure the total protein concentrations were uniform and controlled across different treatment groups. Reverse transcriptase quantitative PCR (RT-qPCR) Total RNA was isolated from differentiated THP-1 macrophages, using the Monarch ® total RNA miniprep kit (New England BioLabs). Two hundred nanograms of total RNA was used in the cDNA synthesis reaction with the High-Capacity RNA-to-CDNA kit (Thermo Fisher Scientific), and the resulting cDNA was subsequently used to analyze gene expression on a QuantStudio 5 qPCR System (Thermo Fisher Scientific) by TaqMan gene expression assays for TNFα (Hs00174128_m1), IL-6 (Hs00174131_m1), IL-1β (Hs01555410_m1), IFNb1 (Hs01077958_s1), and CCL5 (Hs99999048_m1). Amplification parameters were 50 °C for 2 min and then 95 °C for 10 min, followed by 40 cycles of 95 °C for 15 s alternating with 60 °C for 60 s. Relative Gene expression was determined based on the ΔC t values between the gene of interest and housekeeping genes GAPDH (Hs02786624_g1) and 18 S rRNA (Hs03003631_g1) compared with the mean ΔC t values for the PBS buffer control group. Reporting summary Further information on research design is available in the Nature Research Reporting Summary linked to this article.
Standard tau aggregation procedure
Unphosphorylated and phosphorylated tau protein was used. Monomers were incubated at 2 μM in PBS buffer (137 mM NaCl, 3 mM KCl, 8 mM Na 2 HPO 4 , 1.5 mM KH 2 PO 4 , pH 7.3) with 0.01% NaN 3 at 37 °C. Heparin (Fisher Scientific) was added at 10 μg/ mL (about 2 μM) to induce aggregation. Self-assembly reactions were rather carried out in the absence of heparin.
Supplementary information Supplementary Information Reporting Summary
📊 Figures
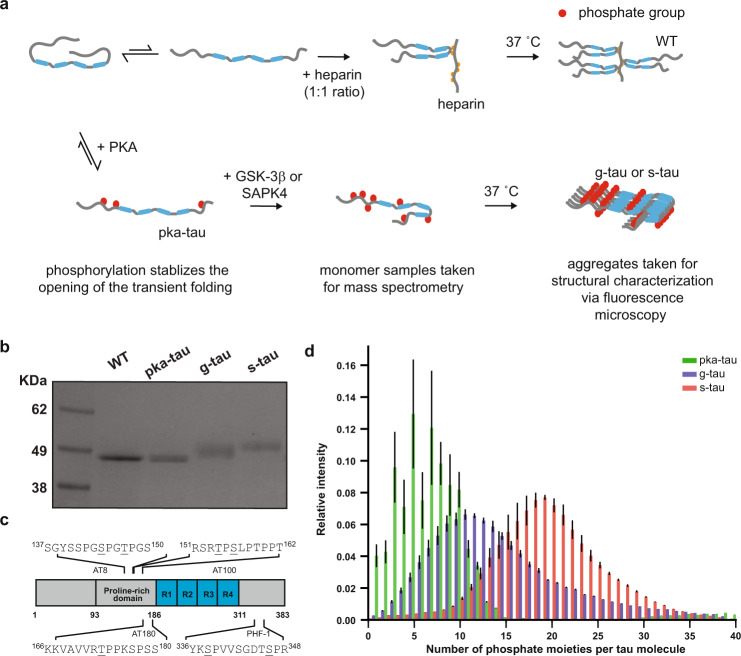
Fig. 1
Sequential hyperphosphorylation of tau in vitro generates AD-specific epitopes.
a A pictorial representation of the experimental design: WT tau was sequentially hyperphosphorylated, first by PKA and then by either GSK-3u03b2 or SAPK4 kinase. Hyperphosphorylation is shown to be ab...
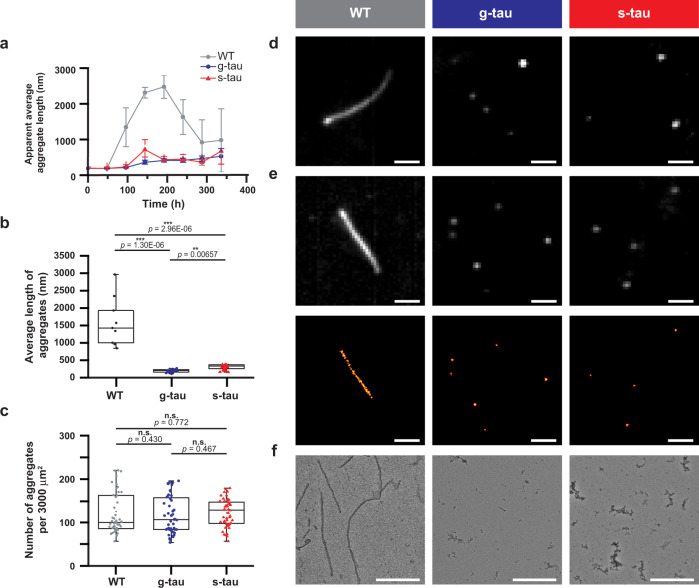
Fig. 2
Hyperphosphorylation enables WT tau to self-polymerize into small amorphous aggregates without external inducers.
a The apparent average length of tau aggregates, monitored by fluorescence microscopy, was analyzed, and plotted as a function of time (data are presented as mean valuesu2009u00b1u2009s.d. across thre...
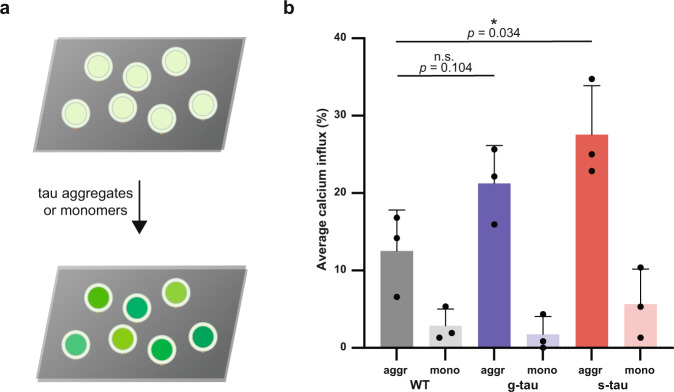
Fig. 3
Hyperphosphorylated tau amorphous aggregates disrupt membrane integrity more effectively than WT fibrillar aggregates.
a The ability to disrupt membrane integrity, an important aspect that explains the toxicity of protein aggregates, was quantified by calcium influx caused by each tau species. The percentage of Ca 2+ ...
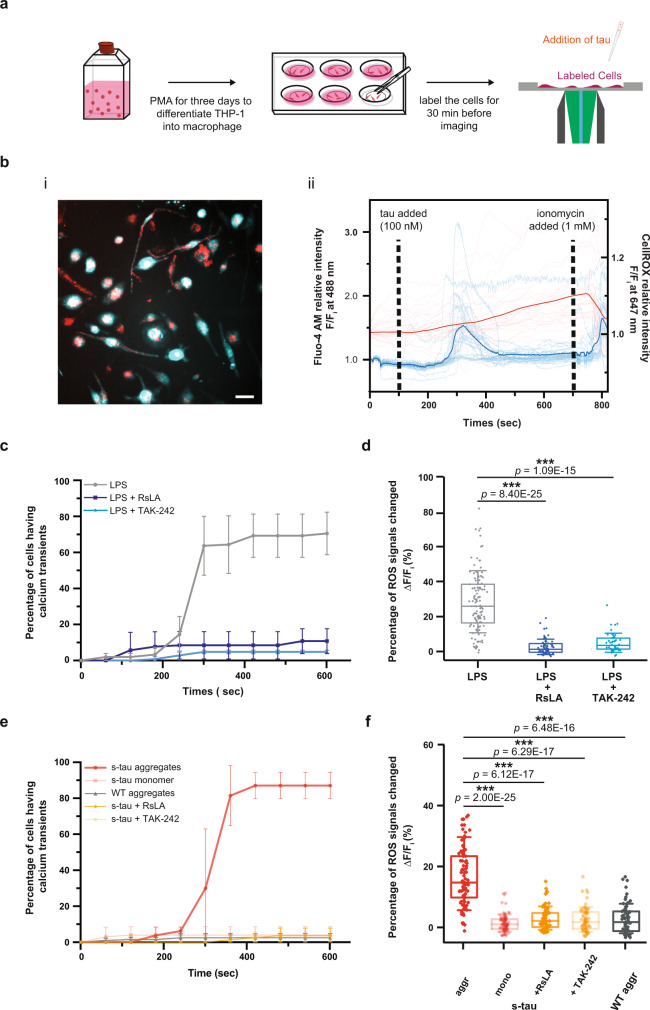
Fig. 4
Hyperphosphorylated tau aggregates elicited calcium transient and stimulated ROS production in human macrophages in a TLR4-dependent manner.
a A pictorial representation of the macrophage assay workflow. The cytosolic calcium and ROS level were simultaneously monitored as different tau aggregates were applied. b Representative image of dua...
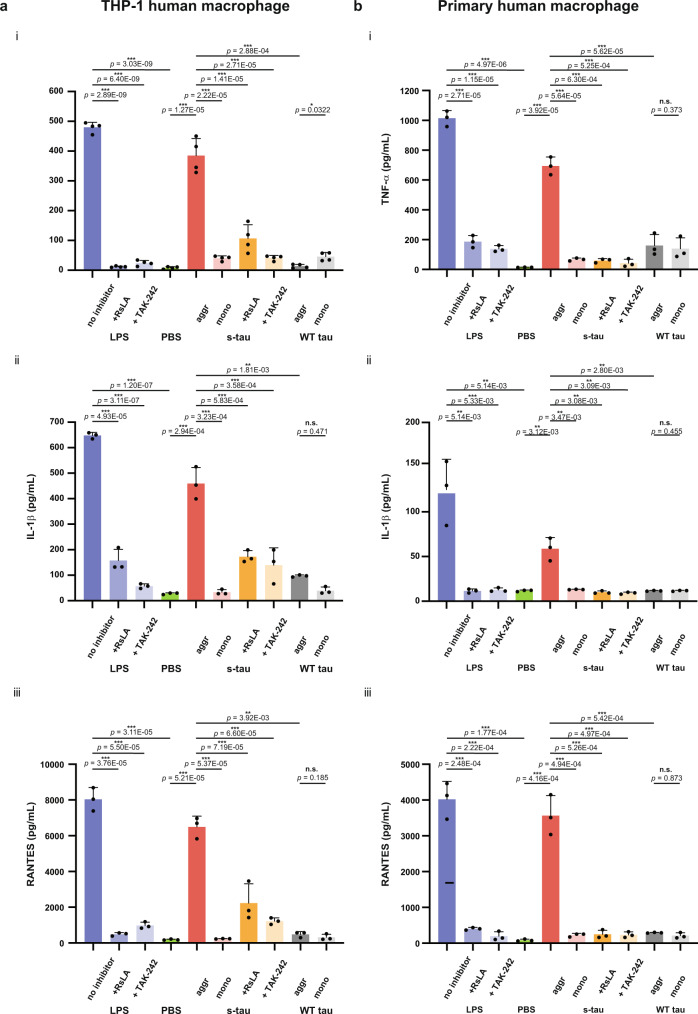
Fig. 5
Hyperphosphorylated tau aggregates induced significantly higher levels of all three pro-inflammatory cytokines than heparin-induced WT aggregates.
(i) TNF-a, (ii) IL-1u03b2, and (iii) CCL5 ELISA assays were conducted on both a THP-1 human macrophage cells and b primary human macrophage cells to determine the pro-inflammatory responses mediated t...
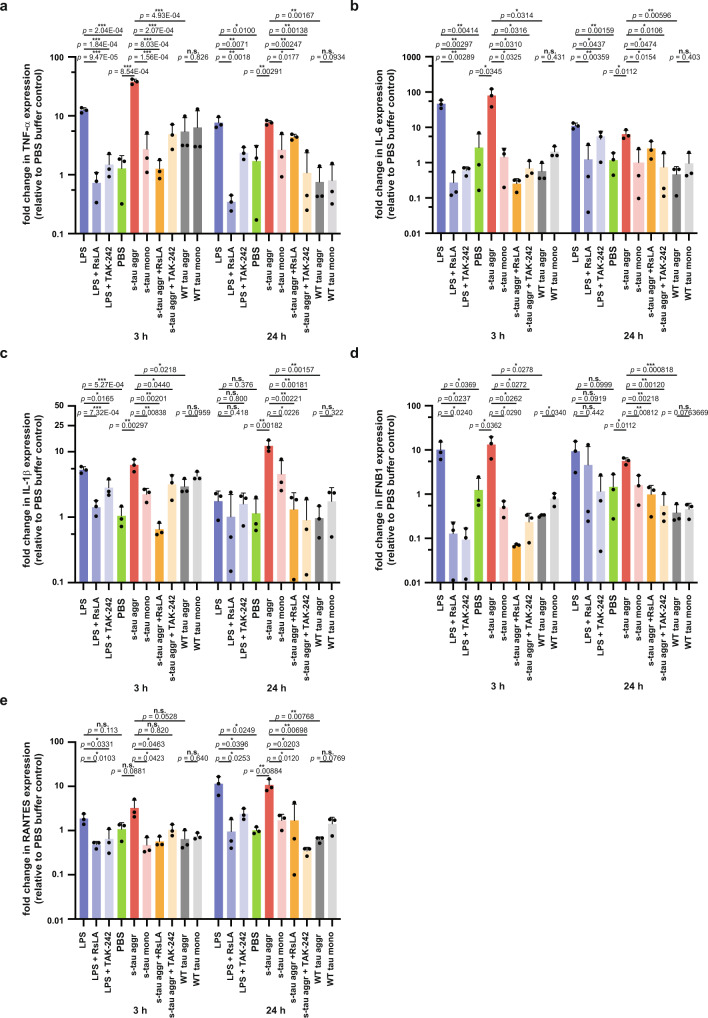
Fig. 6
The expression of inflammatory-related genes TNF- u03b1, IL-6 , IL-1 u03b2, IFN u03b2 1 , and CCL5 were upregulated by hyperphosphorylated tau aggregates in THP-1 human macrophage and can be attenuated by TLR4 inhibitors.
RT-qPCR measurements of the expression profile of inflammatory-related genes a TNF -u03b1, b IL-6 , c IL-1u03b2 , d IFNu03b21 , e CCL5 after 3u2009h and 24u2009h treatment by LPS, s-tau monomer or agg...
Figure images are served from the NIH/NLM PubMed Central Open Access Subset or Europe PMC; copyright remains with the publishers and authors.
💬 Discussion
0 commentsNo comments yet. Be the first to start a discussion!
Leave a Comment