Abstract
AbstractSynucleinopathies such as Parkinson's disease (PD) are hallmarked by α‐synuclein (α‐syn) pathology and neuroinflammation. This neuroinflammation involves activated microglia with increased secretion of interleukin‐1β (IL‐1β). The main driver of IL‐1β secretion from microglia is the NLRP3 inflammasome. A critical link between microglial NLRP3 inflammasome activation and the progression of both α‐syn pathology and dopaminergic neurodegeneration has been identified in various PD models in vivo. α‐Syn is known to activate the microglial NLRP3 inflammasome in murine models, but its relationship to this inflammasome in human microglia has not been established. In this study, IL‐1β secretion from primary mouse microglia induced by α‐syn fibrils was dependent on NLRP3 inflammasome assembly and caspase‐1 activity, as previously reported. We show that exposure of primary human microglia to α‐syn fibrils also resulted in significant IL‐1β secretion that was dependent on inflammasome assembly and involved the recruitment of caspase‐1 protein to inflammasome scaffolds as visualized with superresolution microscopy. While canonical IL‐1β secretion was clearly dependent on caspase‐1 enzymatic activity, this activity was less clearly involved for α‐syn‐induced IL‐1β secretion from human microglia. This work presents similarities between primary human and mouse microglia in the mechanisms of activation of the NLRP3 inflammasome by α‐syn, but also highlights evidence to suggest that there may be a difference in the requirement for caspase‐1 activity in IL‐1β output. The data represent a novel characterization of PD‐related NLRP3 inflammasome activation in primary human microglia and further implicate this mechanism in the pathology underlying PD.
🔬 Techniques
🔭 Microscopes
🧬 Organisms
✨ Fluorophores
🧪 Sample Preparation
🔬 Cell Lines
🏭 Microscope Brands
🧪 Reagent Suppliers
💻 Software Details
🏷️ Research Resource Identifiers (RRIDs)
Verified research resources used in this paper:
🏛️ Research Organizations (ROR)
Affiliated research institutions:
📋 Methods
Isolation and culture of primary microglia from human brain tissue
Adult primary human microglia were isolated from postmortem brain specimens by density gradient centrifugation essentially as previously described by de Groot, Hulshof, Hoozemans, and Veerhuis ( 2001 ). Corpus callosum or subventricular cortical white matter tissue specimens were acquired from rapid autopsy according to the standard protocols of the Netherlands Brain Bank (Ravid & Swaab, 1993 ), with informed donor consent having been obtained from either patients or next of kin during life. In addition, normal cortical tissue not needed for diagnostic purposes was acquired in cooperation with the VU University Medical Center Department of Neurosurgery from patients undergoing focal cortical resection for medication‐refractory epilepsy, also with informed donor consent. The use of primary human tissue for in vitro experiments was in compliance with the Declaration of Helsinki. All tissue was collected in Dulbecco's modified Eagle medium [DMEM] supplemented with 0.1% gentamycin. The isolated microglia were cultured in medium comprising DMEM and Ham F10 (1:1) supplemented with 10% v/v heat inactivated fetal bovine serum (Hyclone, Thermo Fisher Scientific), a mixture of 100 IU/ml penicillin and 50 μg/ml streptomycin (Gibco), and 0.5% l ‐glutamine. For experimentation, microglia were seeded in 24‐ or 48‐well uncoated culture plates (Corning Costar) and incubated at 37°with 5% CO 2 . Then, 24 hr after isolation, the microglia were treated with 25 ng/ml granulocyte macrophage colony stimulating factor (recombinant human GM‐CSF, Immunotools) to allow for better adherence and proliferation, after which the medium was replaced with fresh culture medium approximately every 72 hr. Microglia were utilized in experiments between days 6–10 postisolation, and the results of each experiment as indicated in figures represent an individual microglial culture from an individual patient.
Show full methods section
Isolation and culture of primary microglia from human brain tissue
Adult primary human microglia were isolated from postmortem brain specimens by density gradient centrifugation essentially as previously described by de Groot, Hulshof, Hoozemans, and Veerhuis ( 2001 ). Corpus callosum or subventricular cortical white matter tissue specimens were acquired from rapid autopsy according to the standard protocols of the Netherlands Brain Bank (Ravid & Swaab, 1993 ), with informed donor consent having been obtained from either patients or next of kin during life. In addition, normal cortical tissue not needed for diagnostic purposes was acquired in cooperation with the VU University Medical Center Department of Neurosurgery from patients undergoing focal cortical resection for medication‐refractory epilepsy, also with informed donor consent. The use of primary human tissue for in vitro experiments was in compliance with the Declaration of Helsinki. All tissue was collected in Dulbecco's modified Eagle medium [DMEM] supplemented with 0.1% gentamycin. The isolated microglia were cultured in medium comprising DMEM and Ham F10 (1:1) supplemented with 10% v/v heat inactivated fetal bovine serum (Hyclone, Thermo Fisher Scientific), a mixture of 100 IU/ml penicillin and 50 μg/ml streptomycin (Gibco), and 0.5% l ‐glutamine. For experimentation, microglia were seeded in 24‐ or 48‐well uncoated culture plates (Corning Costar) and incubated at 37°with 5% CO 2 . Then, 24 hr after isolation, the microglia were treated with 25 ng/ml granulocyte macrophage colony stimulating factor (recombinant human GM‐CSF, Immunotools) to allow for better adherence and proliferation, after which the medium was replaced with fresh culture medium approximately every 72 hr. Microglia were utilized in experiments between days 6–10 postisolation, and the results of each experiment as indicated in figures represent an individual microglial culture from an individual patient.
Isolation and culture of primary microglia from mouse brain tissue
Primary mouse microglia cells were derived from mixed gender cultures of C57BL/6J mouse brains (postnatal days P0–P2). Cerebral cortices were stripped of the meninges and mechanically dissociated as described by Russo et al. ( 2015 ). The cell suspension obtained from the two brains was plated on poly‐ l ‐lysine (0.1 mg/ml, Sigma‐Aldrich)‐coated T‐75 flask and cultivated in DMEM (Gibco by Thermo Fischer Scientific, Breda, the Netherlands), supplemented with 10% heat‐inactivated fetal bovine serum (FBS; Gibco) and 1% penicillin/ streptomycin (P/S; Gibco). The next day, the cells were washed three times with DPBS (Gibco) to remove cellular debris and cultured as reported by Scheiblich et al. ( 2017 ). After 8–10 days in culture, weakly attached mature microglia were shaken loose from the astrocytic monolayer with a repetition of the harvesting procedure every 2–3 days, up to three times.
Cell culture and reagents
The human monocyte‐like leukemia cell line THP‐1 was obtained from ATCC (Rockville, MD, CLS Cat# 300356/p804_THP‐1, RRID:CVCL_0006). The cells were cultured in Roswell Park Memorial Institute (RPMI) 1640 medium with GlutaMAX (Gibco) supplemented with 10% heat inactivated FBS (Hyclone, Thermo Fisher Scientific, Breda, the Netherlands) and a mixture of 100 IU/ml penicillin and 50 μg/ml streptomycin (Gibco). The THP‐1 cells were differentiated by the addition to culture medium upon seeding in 24‐ or 48‐well uncoated culture plates (Corning Costar, Amsterdam, the Netherlands) of 100 ng/ml phorbol 12‐myristate 13‐acetate (PMA, Sigma‐Aldrich, Mechelen, Belgium) for 72 hr prior to exposure. Lipopolysaccharide (LPS) from Escherichia coli O55:B5 was from Sigma‐Aldrich (catalog no. L‐2880). Recombinant human α‐syn was overexpressed and purified in monomeric form from E. coli and then aggregated into fibrils (250 mM nominal concentration of monomers to form 3615 μg/ml aqueous fibril stock solution) as previously reported (Codolo et al., 2013 ). No endotoxin contamination was detectable in the α‐Syn monomer and fibril preparations, as determined with a limulus amoebocyte lysate (LAL) assay. Fibrils were not sonicated prior to application in culture. α‐Syn monomers, upon thawing, were centrifuged through an Amicon 100 kDa filter (Sigma‐Aldrich, Mechelen, Belgium) to remove any spontaneously formed aggregates from solution. The NLRP3 inhibitor MCC950 (CP‐456773, CRID3) was from Sigma‐Aldrich (Mechelen, Belgium), and the caspase‐1 inhibitor Z‐YVAD‐FMK was from PromoCell GmbH (Heidelberg, Germany).
Exposure conditions PMA‐differentiated
THP‐1 cells in 24‐ (450,000 cells/well) or 48‐well (225,000 cells/well) culture plates were washed once with PBS to remove serum proteins left over from culture medium. Cells were exposed to LPS (50 ng/ml) as a time‐matched NLRP3 inflammasome activation control stimulus or to various concentrations of α‐syn fibrils or filtered monomers up to 289.2 μg/ml (nominal concentration) in serum‐free medium for 18–24 hr. For canonical activation, THP‐1 cells were exposed to LPS (50 ng/ml) for 3.5 hr followed by the addition of nigericin (10 μM, Adipogen, Epalinges, Switzerland) for 30 min. GM‐CSF‐treated primary human microglia in 24‐ or 48‐well plates after 6–10 days in culture were also washed once with PBS and were exposed to LPS (20 ng/ml) or the same concentration ranges of α‐syn fibrils or filtered monomers in serum‐free medium for 18–24 hr. For canonical activation, primary human microglia were exposed to LPS (20 ng/ml) for 3.5 hr followed by the addition of nigericin (10 μM) for 30 min. In inhibition experiments, MCC950 (1 μM) or Z‐YVAD‐FMK (10 μM) were administered at the time of addition of the initial stimulus (priming) and left in the system for the duration of the exposure. After cell exposure, supernatants were collected immediately and centrifuged at 0.8× g for 5 min at room temperature to remove any cell debris. Cell lysates were collected by scraping with a pipet tip in lysis buffer (0.5% NP‐40 in PBS with protease inhibitor cocktail [cOmplete mini, EDTA‐free, Roche, Woerden, the Netherlands]) on ice, and cell debris was removed via centrifugation at 21,000× g for 10 min at 4°C. Cleared supernatants and cell lysates were stored at −20°C until testing.
ELISA analysis
The concentration of IL‐1β in culture supernatants was determined with a sandwich enzyme‐linked immunosorbent assay (ELISA) specific for the detection of human IL‐1β (PeliKine compact kit, Sanquin, Amsterdam, the Netherlands).
Thioflavin
T aggregation assay Then, 20, 10, and 5 μl aqueous stock α‐syn fibrils (3,615 μg/ml) and 20 μl filtered monomers (250 μM, 3,615 μg/ml) were added to 10 μl 2 mM thioflavin T in HEPES buffer (20 mM HEPES, 150 mM NaCl, pH 7.2), in each well of a 96‐well black fluorescence plate. HEPES buffer was added to a final volume of 100 μl per well, the plate was shaken, and the fluorescence was measured at 37°C with a Tecan Spark plate reader (Tecan GmbH, Grödig, Austria) at an excitation wavelength of 440 nm and an emission wavelength of 485 nm.
Western blot analysis
Supernatants and lysates were collected as described for ELISA. For western blotting, samples were denatured with heating in lithium dodecyl sulfate (LDS)‐containing loading buffer and reducing agent containing 500 mM dithiothreitol (DTT) for 5 min @ 95°C (except for native α‐syn aggregates, which were subjected to electrophoresis without heating or denaturation to maintain aggregate structure) and separated by polyacrylamide gel electrophoresis (PAGE) on a 4–12% Bis‐Tris gel in MES running buffer (NuPAGE, Thermo Fisher Scientific, Breda, the Netherlands). After PAGE, proteins were transferred to polyvinylidene fluoride (PVDF) membranes which were then blocked with 5% milk and 0.5% Tween in PBS and then immunolabeled. Detection was performed using enhanced chemiluminescence (ECL Western Blotting Substrate, Pierce, Breda, the Netherlands) with a ChemiDoc imaging system (Biorad). β‐actin was used as a loading control for cell lysate western blots. Primary antibodies included: anti‐α‐syn polyclonal antibody (MJFR1, 1:1,000 dilution, Abcam, Cambridge, United Kingdom), anti‐IL‐1β polyclonal antibody (anti‐human IL‐1β/IL‐1F2, R and D Systems Cat# AF‐201‐NA, RRID:AB_354387, 1:2,000 dilution), and anti‐β‐actin (Sigma‐Aldrich Cat# A3853, RRID:AB_262137, 1:10,000 dilution, Sigma‐Aldrich, Mechelen, Belgium). Secondary antibodies included goat anti‐mouse polyclonal antibody with horseradish peroxidase (HRP) conjugate (Agilent Cat# P0447, RRID:AB_2617137, 1:1,500 dilution) and rabbit anti‐goat polyclonal antibody with HRP conjugate (Agilent Cat# P0449, RRID:AB_2617143, 1:2,000 dilution).
Viability assays
The lactate dehydrogenase leakage assay (LDH, Pierce, Breda, the Netherlands), to assess membrane integrity, and the methyl tetrazolium assay (MTT, Sigma M‐2128, Mechelen, Belgium), to assess mitochondrial function, were performed according to manufacturer's protocols. For the MTT assay, the supernatants were first removed from the cell culture and 0.25 mg/ml MTT in complete cell culture medium was added. After 2 hr at 37°C, the MTT solution was removed and 100 μl DMSO was added to each well. The plate was shaken for 1 min and absorbance was measured at a wavelength of 540 nm.
Confocal and STED superresolution microscopy
Postisolation primary human microglia or PMA‐treated THP‐1‐derived macrophage‐like cells were allowed to adhere to 12 mm round borosilicate glass coverslips (Menzel #1.5, Thermo Fisher Scientific, Breda, the Netherlands) in separate wells of a 24‐well culture plate. No coating or treatment of the coverslips was required. After exposure of the cells, supernatants were collected for ELISA analysis of IL‐1β to confirm inflammasome activation and the cells were washed 3× with PBS, fixed for 10 min at room temperature with 4% paraformaldehyde in PBS with gentle shaking, and washed another 3× with PBS. Nonspecific binding sites were blocked with 10% goat serum/0.1% Triton X‐100 with azide (Life Technologies) diluted 1:1 (to 5%/0.05%) in PBS for at least 30 min with gentle shaking. After blocking, cells were incubated without washing with primary antibodies in dilution buffer (PBS with 1% bovine serum albumin [BSA]) either at room temperature for 1 hr or at 4°C overnight, then washed 3× with PBS and incubated with secondary antibodies in dilution buffer. As a final labeling step, cells were incubated with labeled primary antibody for caspase‐1 in dilution buffer. Cells were washed 3× with PBS after each antibody incubation. Primary antibodies included: anti‐NLRP3/NALP3 monoclonal antibody (Cryo‐2, AdipoGen Cat# AG‐20B‐0014, RRID:AB_2490202, 1:200 dilution), anti‐ASC polyclonal antibody (AL 177, AdipoGen Cat# AG‐25B‐0006, RRID:AB_2490440, 1:200 dilution), anti‐α‐syn polyclonal antibody (MJFR1, Abcam Cat# ab138501, RRID:AB_2537217, 1:200 dilution), anti‐p20‐caspase‐1 (AA 145‐170) (Alexa Fluor 488) polyclonal antibody (Bioss Primary Conjugated Antibodies, 1:100 dilution). Secondary antibodies included: Abberior STAR 580 [Abberior Cat# 2‐0002‐005‐1, RRID:AB_2620153] and Abberior STAR 635p (Abberior GmbH, 1:100 dilution). Nuclear counterstaining was performed with DAPI dihydrochloride (Thermo Fisher Scientific Cat# D1306, RRID:AB_2629482), diluted to 300 nM in PBS and f‐actin counterstaining with Alexa Fluor 546 phalloidin diluted 1:1,000 in PBS. Images were acquired with a Leica TCS SP8 STED 3× confocal scanning laser microscope equipped with 3 STED lasers (confocal 40×, STED 100× objective; NA 1.4; immersion in oil) and analyzed with the ImageJ software (Fiji, RRID:SCR_002285). Three dimensional (3D) rendering of ImageJ‐generated Z‐stacks was acquired using the Imaris software (Imaris, RRID:SCR_007370). Transmission electron microscopy α‐Syn fibrils : α‐Syn fibrils resuspended in PBS were adsorbed onto a carbon‐coated copper grid and were then negative‐stained with 0.05% uranyl acetate solution.
Transmission electron microscopy
(TEM) micrographs were taken with a Tecnai‐12 electron microscope (Philips‐FEI) at the EM Facility of University of Padua.
Mouse primary microglia
Cells were fixed and processed for electron microscopy 24 hr after treatment with α‐syn fibrils. Mouse primary microglia cells were fixed for 1 hr at room temperature with freshly prepared 2.5% (v/v) glutaraldehyde in 0.1 M sodium cacodylate (pH 7.4). After washing with 0.1 M sodium cacodylate, cells were postfixed in 1% OsO4, 1.5% K4Fe(CN)6 in 0.1 M sodium cacodylate pH 7.4, stained with 0.5% uranyl acetate, dehydrated in ethanol and embedded in Embed 812. Thin sections were imaged on a Tecnai‐12 electron microscope (Philips‐FEI) at the EM Facility of University of Padua.
Atomic force microscopy
Atomic force microscopy
(AFM) imaging of α‐syn fibrils was performed as previously described (Plotegher, Greggio, Bisaglia, & Bubacco, 2014 ) in a “PeakForce tapping” mode with Scanasyst‐Air probes (Bruker, Mannheim, Germany) on a Nanoscope V system equipped with a Multimode head and a type‐E piezoelectric scanner (Bruker, Mannheim, Germany). Ten microliters of sample were deposited on freshly cleaved mica (RubyRed Mica Sheets, Electron Microscopy Sciences, Fort Washington, USA) and left to adsorb for 5 min at room temperature (∼20°C). The mica surface was then rinsed with ∼500 μl of MilliQ H 2 O (Millipore Simplicity) at the same temperature and dried with dry nitrogen.
Statistical analysis Two‐way
ANOVA with Bonferroni multiple testing correction was performed with individual experimental replicates in GraphPad Prism v.7. Graphs presented as means and standard deviations per experiment (unless otherwise indicated in figure legend) with experiments differentiated by color.
Supporting information Figure S1 Supporting information Click here for additional data file. Figure S2 Supporting information Click here for additional data file. Figure S3 Supporting information Click here for additional data file.
📊 Figures
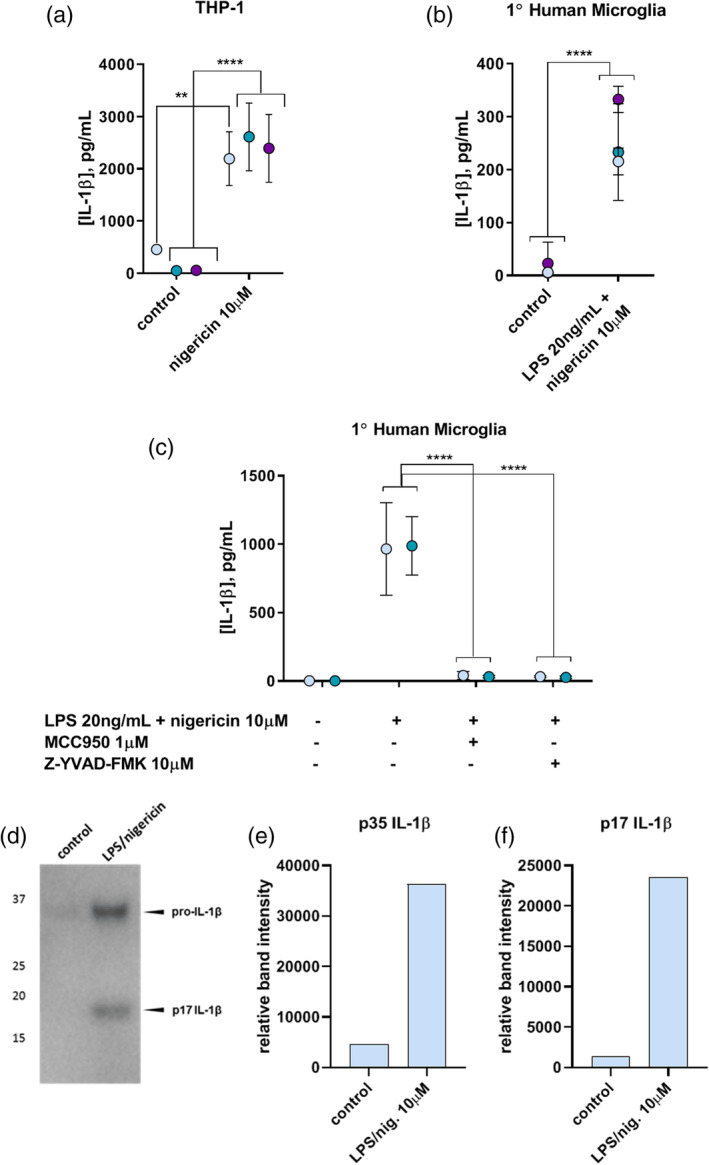
FIGURE 1
(a) ILu20101u03b2 in culture supernatants of PMAu2010differentiated THPu20101 cells upon canonical inflammasome activation with nigericin alone (10 u03bcM, 30u2009min) in the absence of LPS priming, a...
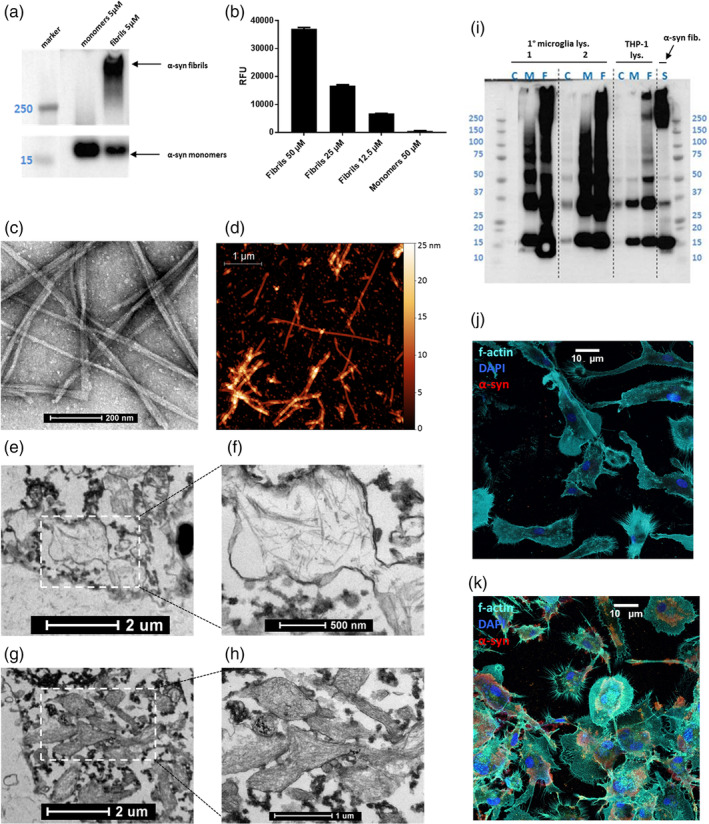
FIGURE 2
(a) u03b1u2010Syn fibrils and monomers as characterized by western blot with MJFR1 antiu2010u03b1u2010syn antibody. Spliced for clarity to juxtapose lanes of interest. (b) Thioflavin T assay of u03b1u...
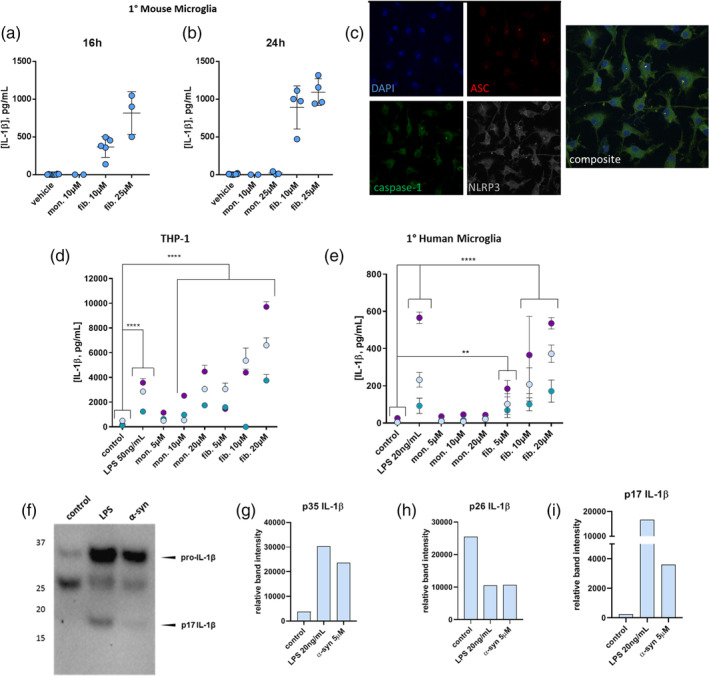
FIGURE 3
(a) 16u2009hr or (b) 24u2009hr exposure of primary mouse microglia to u03b1u2010syn fibrils and monomers (144.6 or 361.5 u03bcg/ml nominal concentration). Fibrils induce ILu20101u03b2 secretion from t...
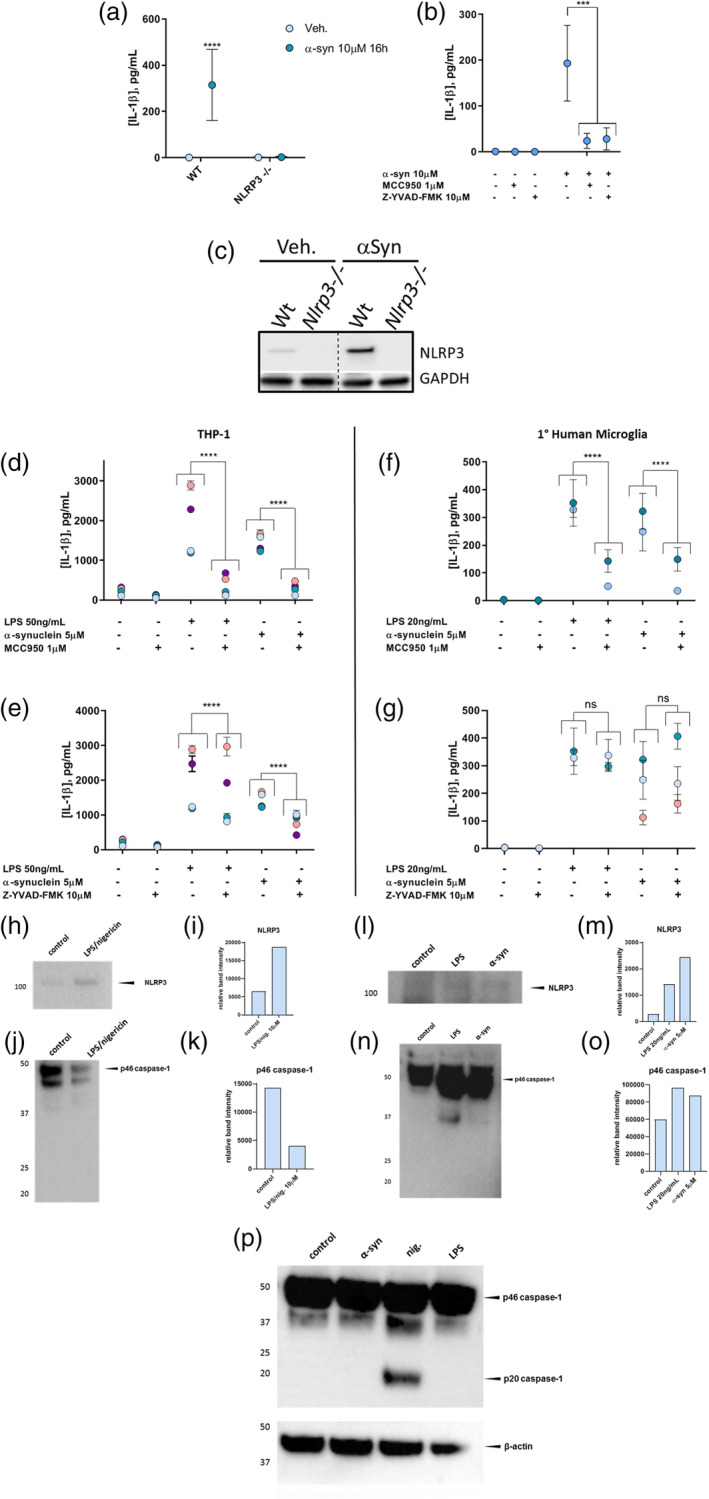
FIGURE 4
(a) Primary microglia from WT mice show an ILu20101u03b2 secretion response to 16u2009hr exposure to 144.6 u03bcg/ml u03b1u2010syn, while microglia from NLRP3 u2212/u2212 mice do not. (b) Ilu20101u03b...
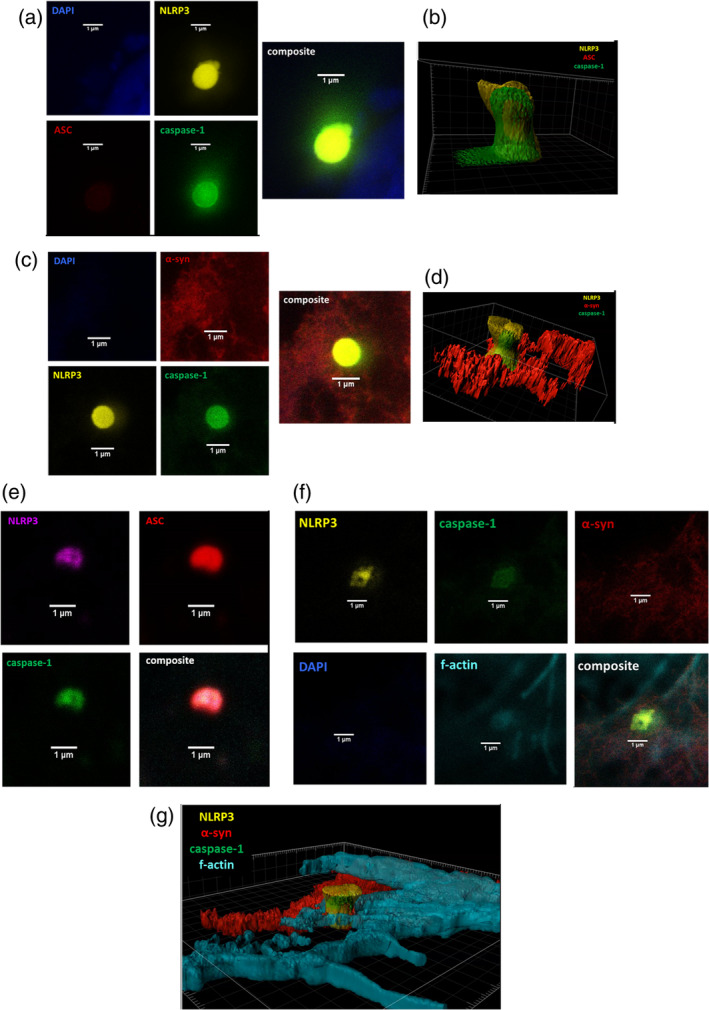
FIGURE 5
(a) STED zoom of u03b1u2010synu2010induced inflammasome complex showing canonical inflammasome components NLRP3, ASC, and caspaseu20101 in the THPu20101 model. (b) 3D surface rendering of the composit...
Figure images are served from the NIH/NLM PubMed Central Open Access Subset or Europe PMC; copyright remains with the publishers and authors.
💬 Discussion
0 commentsNo comments yet. Be the first to start a discussion!
Leave a Comment