Abstract
Imaging of biological matter across resolution scales entails the challenge of preserving the direct and unambiguous correlation of subject features from the macroscopic to the microscopic level. Here, we present a correlative imaging platform developed specifically for imaging cells in 3D under cryogenic conditions by using X-rays and visible light. Rapid cryo-preservation of biological specimens is the current gold standard in sample preparation for ultrastructural analysis in X-ray imaging. However, cryogenic fluorescence localization methods are, in their majority, diffraction-limited and fail to deliver matching resolution. We addressed this technological gap by developing an integrated, user-friendly platform for 3D correlative imaging of cells in vitreous ice by using super-resolution structured illumination microscopy in conjunction with soft X-ray tomography. The power of this approach is demonstrated by studying the process of reovirus release from intracellular vesicles during the early stages of infection and identifying intracellular virus-induced structures.
🔬 Techniques
🔭 Microscopes
💻 Software
✨ Fluorophores
🧪 Sample Preparation
🔬 Cell Lines
🏭 Microscope Brands
🧪 Reagent Suppliers
🔴 Lasers
📷 Detectors
🎨 Filters
💻 Software Details
💻 Code & Software
Image correction software for chromatic shifts in fluorescence microscopic images
SIMcheck: ImageJ tools for assessing Structured Illumination Microscopy (SIM) data quality and reliability
Cockpit is a microscope graphical user interface. It is a flexible and easy to extend platform aimed at life scientists...
💾 Data Repositories
🏛️ Research Organizations (ROR)
Affiliated research institutions:
📋 Methods
Experimental workflow of correlative imaging using Cryo-SXT and Cryo-SIM
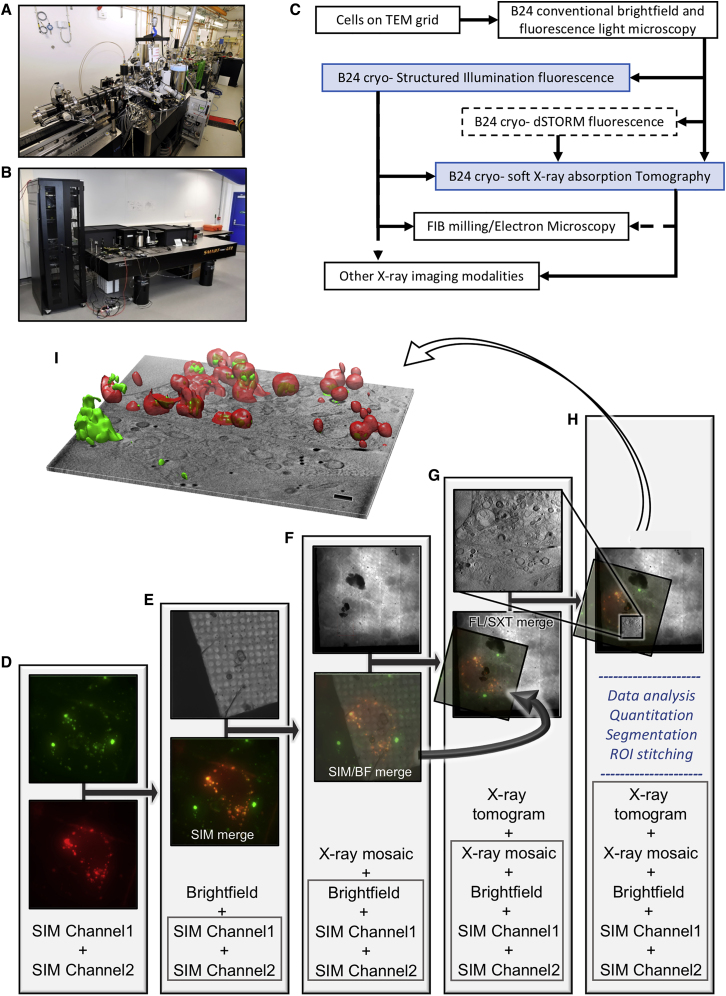
Cryopreservation lies at the heart of our workflow because it allows not only the immobilization and preservation of native cellular structures but also confers resistance to prolonged exposure to intense light during imaging. Cells to be imaged are typically grown as adherent monolayers, multilayers, or in suspension. Adherent cells are cultured on carbon films on gold EM grids ( Agarwal et al., 1989 ) ideally with positional markers (finder grids). At this stage, fluorescent markers can be endogenously expressed or added to the culture media for uptake into the cells. Attachment, growth, confluency, and distribution of live cells in the media can be established via any number of conventional light and fluorescence microscopy methods prior to addition of fiducial markers (usually gold nanobeads), blotting (to remove excess media), and vitrification via plunge freezing in liquid nitrogen-cooled liquid ethane. Post-vitrification, grids are once again imaged in both bright field and fluorescence and mapped at the beamline on a cryostage-equipped light microscope with fluorescence detection capabilities, to examine cell morphology and to confirm absence of non-vitreous contaminants (Linkam Scientific CMS196M; Carl Zeiss AG Axio Imager 2; DIC 50×, 0.55 NA). At this point, the selected cells are ideally intact, with thin vitreous ice around them, and ROIs have been identified. Grids can now either be used as they are or clipped in autogrid holders (ThermoFisher) for greater stability. The cryoSIM is thereafter the first stop for high-resolution 3D imaging, followed by cryo-SXT on the same ROIs ( Figure 4 ; STAR Methods ). Because exposure to soft X-rays leads to atomic bond damage within fluorescence centers, X-ray imaging can never precede fluorescence imaging. Figure 4 Correlative imaging tools and workflow at beamline B24 with stepwise protocol for in silico correlation of data collected by using the different microscopes (A and B) Images of the TXM (A) and the cryoSIM (B) on site at the Diamond Light Source beamline B24 ( https://www.diamond.ac.uk/Instruments/Biological-Cryo-Imaging/B24.html ). (C) A schematic of the operational workflow that incorporates cryoSIM and cryoSXT as well as other imaging applications and potential imaging partnerships (hashed lines denote methods and correlative paths currently under development). (D) Correlation of fluorescence signals on the same ROI. (E) Superposition of all fluorescence signals (bottom) with corresponding brightfield data (top). (F) Positioning of combined image stacks from previous step (SIM/FM merge; bottom of column) in 2D X-ray mosaic (top). (G) 3D superposition of previous (bottom of column) with X-ray tomogram at ROI (top; lateral resolution of imaging beyond 60 nm; measured resolution at the B24 transmission X-ray microscope with the 40 nm objective). (H) The combined 3D stacks can now be further analyzed with image analyses packages such as Fiji ( Schindelin et al., 2012 ) or segmentation algorithms such as SurVoS ( Luengo et al., 2017 ) to extract statistical data on cellular structures or further combined with tomograms from adjacent ROIs to increase the 3D space imaged or segmented. (I) The resulting multi-channel stack has all imaging data correlated in 3D. A single slice from the middle of the tomograms is shown with the correlated 3D fluorescence volumes (in red for intracellular vesicles that contain molecules of interest and in green for reovirus; the scale bar is 1 μm). Superpositions in steps (D) and (E) were done with Chromagnon ( Matsuda et al., 2018 ) and (F)–(H) with eC-CLEM ( Paul-Gilloteaux et al., 2017 ); visualization and rendering were done with Fiji ( Schindelin et al., 2012 ) and Chimera ( Pettersen et al., 2004 ). Samples are placed in standard Linkam cryoholders at the cryoSIM that is initially used to generate a brightfield transmission 2D mosaic of the grid holder structure, and ROIs are annotated on this mosaic as data collection takes places. 3D-SIM data are collected through the sample and along the z axis (4–12 μm depending on cell thickness). We have not observed any thawing of vitreous samples during data collection under the above-mentioned standard conditions and samples that have been used in cryoSIM imaging do not appear structurally different from other samples at the TXM. After SIM imaging, samples could also be used for cryo-electron tomography through a focused ion beam milling step ( Medeiros et al., 2018 ), however, we have yet to fully explore this potential. After cryoSIM data collection, grids are recovered from the Linkam holders and stored until they can be loaded into TXM holders (either conventional cryo-holders or autogrid TXM holders, the design for which was a kind gift by the Mistral beamline at the Spanish synchrotron, ALBA [ https://intranet.cells.es/Beamlines/XM ]). Once at the TXM, grids are examined and mapped with visible light to produce a new mosaic at the sample orientation (moving from one holder to the other results in random sample rotation for each microscope). The mosaics are then aligned with a semi-automated plugin at the beamline and the established ROIs from SIM data collection are recovered to allow X-ray data collection in the same regions. The samples are initially evaluated for susceptibility to radiation damage and uniformity of vitrification (semi-crystalline ice areas can be readily identified in X-ray projections). Next, a data collection strategy is devised on the basis of trial exposures in areas away from established ROIs in conjunction with the imaging requirements of each project. 2D X-ray mosaics are acquired at all ROIs covering single grid squares (imaging of 7 × 7 adjacent FOV at 16 × 16 μm will image a whole grid square in a standard EM grid) and these are used to decide on data collection areas. 3D X-ray data are collected as a tilt series and relayed in real-time to an automated pipeline by using IMOD Batchruntomo ( Mastronarde and Held, 2017 ), and provided a sample has good contrast and fiducials (ideally >3 and well dispersed in the FOV), the data are reconstructed to tomograms by using IMOD’s weighted back projection, serial iterative reconstruction, and patch tracking options. The tomograms can then be used to further refine data collection strategy.
Show full methods section
Experimental workflow of correlative imaging using Cryo-SXT and Cryo-SIM
Cryopreservation lies at the heart of our workflow because it allows not only the immobilization and preservation of native cellular structures but also confers resistance to prolonged exposure to intense light during imaging. Cells to be imaged are typically grown as adherent monolayers, multilayers, or in suspension. Adherent cells are cultured on carbon films on gold EM grids ( Agarwal et al., 1989 ) ideally with positional markers (finder grids). At this stage, fluorescent markers can be endogenously expressed or added to the culture media for uptake into the cells. Attachment, growth, confluency, and distribution of live cells in the media can be established via any number of conventional light and fluorescence microscopy methods prior to addition of fiducial markers (usually gold nanobeads), blotting (to remove excess media), and vitrification via plunge freezing in liquid nitrogen-cooled liquid ethane. Post-vitrification, grids are once again imaged in both bright field and fluorescence and mapped at the beamline on a cryostage-equipped light microscope with fluorescence detection capabilities, to examine cell morphology and to confirm absence of non-vitreous contaminants (Linkam Scientific CMS196M; Carl Zeiss AG Axio Imager 2; DIC 50×, 0.55 NA). At this point, the selected cells are ideally intact, with thin vitreous ice around them, and ROIs have been identified. Grids can now either be used as they are or clipped in autogrid holders (ThermoFisher) for greater stability. The cryoSIM is thereafter the first stop for high-resolution 3D imaging, followed by cryo-SXT on the same ROIs ( Figure 4 ; STAR Methods ). Because exposure to soft X-rays leads to atomic bond damage within fluorescence centers, X-ray imaging can never precede fluorescence imaging. Figure 4 Correlative imaging tools and workflow at beamline B24 with stepwise protocol for in silico correlation of data collected by using the different microscopes (A and B) Images of the TXM (A) and the cryoSIM (B) on site at the Diamond Light Source beamline B24 ( https://www.diamond.ac.uk/Instruments/Biological-Cryo-Imaging/B24.html ). (C) A schematic of the operational workflow that incorporates cryoSIM and cryoSXT as well as other imaging applications and potential imaging partnerships (hashed lines denote methods and correlative paths currently under development). (D) Correlation of fluorescence signals on the same ROI. (E) Superposition of all fluorescence signals (bottom) with corresponding brightfield data (top). (F) Positioning of combined image stacks from previous step (SIM/FM merge; bottom of column) in 2D X-ray mosaic (top). (G) 3D superposition of previous (bottom of column) with X-ray tomogram at ROI (top; lateral resolution of imaging beyond 60 nm; measured resolution at the B24 transmission X-ray microscope with the 40 nm objective). (H) The combined 3D stacks can now be further analyzed with image analyses packages such as Fiji ( Schindelin et al., 2012 ) or segmentation algorithms such as SurVoS ( Luengo et al., 2017 ) to extract statistical data on cellular structures or further combined with tomograms from adjacent ROIs to increase the 3D space imaged or segmented. (I) The resulting multi-channel stack has all imaging data correlated in 3D. A single slice from the middle of the tomograms is shown with the correlated 3D fluorescence volumes (in red for intracellular vesicles that contain molecules of interest and in green for reovirus; the scale bar is 1 μm). Superpositions in steps (D) and (E) were done with Chromagnon ( Matsuda et al., 2018 ) and (F)–(H) with eC-CLEM ( Paul-Gilloteaux et al., 2017 ); visualization and rendering were done with Fiji ( Schindelin et al., 2012 ) and Chimera ( Pettersen et al., 2004 ). Samples are placed in standard Linkam cryoholders at the cryoSIM that is initially used to generate a brightfield transmission 2D mosaic of the grid holder structure, and ROIs are annotated on this mosaic as data collection takes places. 3D-SIM data are collected through the sample and along the z axis (4–12 μm depending on cell thickness). We have not observed any thawing of vitreous samples during data collection under the above-mentioned standard conditions and samples that have been used in cryoSIM imaging do not appear structurally different from other samples at the TXM. After SIM imaging, samples could also be used for cryo-electron tomography through a focused ion beam milling step ( Medeiros et al., 2018 ), however, we have yet to fully explore this potential. After cryoSIM data collection, grids are recovered from the Linkam holders and stored until they can be loaded into TXM holders (either conventional cryo-holders or autogrid TXM holders, the design for which was a kind gift by the Mistral beamline at the Spanish synchrotron, ALBA [ https://intranet.cells.es/Beamlines/XM ]). Once at the TXM, grids are examined and mapped with visible light to produce a new mosaic at the sample orientation (moving from one holder to the other results in random sample rotation for each microscope). The mosaics are then aligned with a semi-automated plugin at the beamline and the established ROIs from SIM data collection are recovered to allow X-ray data collection in the same regions. The samples are initially evaluated for susceptibility to radiation damage and uniformity of vitrification (semi-crystalline ice areas can be readily identified in X-ray projections). Next, a data collection strategy is devised on the basis of trial exposures in areas away from established ROIs in conjunction with the imaging requirements of each project. 2D X-ray mosaics are acquired at all ROIs covering single grid squares (imaging of 7 × 7 adjacent FOV at 16 × 16 μm will image a whole grid square in a standard EM grid) and these are used to decide on data collection areas. 3D X-ray data are collected as a tilt series and relayed in real-time to an automated pipeline by using IMOD Batchruntomo ( Mastronarde and Held, 2017 ), and provided a sample has good contrast and fiducials (ideally >3 and well dispersed in the FOV), the data are reconstructed to tomograms by using IMOD’s weighted back projection, serial iterative reconstruction, and patch tracking options. The tomograms can then be used to further refine data collection strategy.
STAR★Methods Key Resources Table
REAGENT or RESOURCE SOURCE IDENTIFIER Antibodies Alexa488 NHS Ester Thermo Fisher Scientific Cat#A20000 Alexa647 NHS Ester Thermo Fisher Scientific Cat#A20106 Bacterial and Virus Strains Reovirus type 3 (strain Dearing) (T3D) Ramig et al., 1977 https://doi.org/10.1128/JVI.22.3.726-733.1977 Chemicals, Peptides, and Recombinant Proteins Trichlorofluoromethane Sigma-Aldrich Cat#48541 Cesium chloride Sigma-Aldrich Cat#C4036 Dulbeccos’ modified Eagle medium (DMEM) Thermo Fischer Scientific Cat#41966029 Fetal Bovine Serum (FBS) Capricorn Cat#FBS-11A Penicillin/streptomycin Thermo Fischer Scientific Cat#15070063 Joklik MEM medium Sigma-Aldrich Cat#M0518 L-Glutamine Thermo Fischer Scientific Cat#25030081 Neonatal calf serum Thermo Fischer Scientific Cat#26010-74 Mitotracker Red FM Thermo Fischer Scientific Cat# M22425 Critical Commercial Assays Zeba Spin Desalting Columns, 7K MWCO Thermo Fischer Scientific Cat#89882 Deposited Data U2OS- reovirus mock Infected (Area 1) EMPIAR: EMPIAR-10412 BioImage Archive: S-BIAD17 U2OS- reovirus mock Infected (Area 2) EMPIAR: EMPIAR-10413 BioImage Archive: S-BIAD17 U2OS- reovirus 1hafter infection (Area 1) EMPIAR: EMPIAR-10414 BioImage Archive: S-BIAD18 U2OS- reovirus 1hafter infection (Area 2) EMPIAR: EMPIAR-10415 BioImage Archive: S-BIAD18 U2OS- reovirus 2hafter infection (Area 1) EMPIAR: EMPIAR-10416 BioImage Archive: S-BIAD19 U2OS- reovirus 2hafter infection (Area 2) EMPIAR: EMPIAR-10417 BioImage Archive: S-BIAD19 U2OS- reovirus 4hafter infection (Area 1) EMPIAR: EMPIAR-10418 BioImage Archive: S-BIAD20 U2OS- reovirus 4hafter infection (Area 2) EMPIAR: EMPIAR-10419 BioImage Archive: S-BIAD20 Experimental Models: Cell Lines L-cells ATCC Cat#CRL-6364 U2OS cells ATCC ATCC HTB-96 U2OS cells expressing galectin3-mCherry Maier et al., 2012 https://doi.org/10.1128/JVI.01428-12 BSC-1 cells ATCC ATCC CCL-26 Recombinant DNA eGFP-Rab7 plasmid Choudhury et al., 2002 Addgene; Cat#12605 Software and Algorithms SoftWoRX 6.5.2 GE Healthcare N/A Chromagnon Matsuda et al., 2018 https://github.com/macronucleus/chromagnon Fiji Schindelin et al., 2012 https://imagej.net/Fiji SIMcheck Ball et al., 2015 https://github.com/MicronOxford/SIMcheck IMOD package (version 4.9.2) Kremer et al., 1996 https://bio3d.colorado.edu/imod/ eC-CLEM Paul-Gilloteaux et al., 2017 http://icy.bioimageanalysis.org/plugin/ec-CLEM Chimera Pettersen et al., 2004 http://www.cgl.ucsf.edu/chimera/ SurVoS Luengo et al., 2017 https://diamondlightsource.github.io/SuRVoS/ Linkam’s LINK software Linkam Scientific https://www.linkam.co.uk/link-controlsoftware Cockpit Micron, Oxford University https://github.com/MicronOxford/cockpit Python Microscope Micron, Oxford University https://www.python-microscope.org/ Other TEM grids Quantifoil Cat#AU G200F1 finder Grid holders Thermo Fisher Scientific Model#AutoGrid 250 nm gold nanoparticle fiducials BBI Solutions Cat#SKU EM.GC250 150 nm gold nanoparticles coated with red Alexa 488 Creative Diagnostics Cat#GFL-150 PS-Speck Microscope Point Source Kit Thermo Fisher Scientific Cat#P7220 CryoSIM 405 nm laser Omicron-Laserage Cat#Bluephoton® TA Cat#Deepstar® Series – 375 nm – 488 nm CryoSIM 488 nm laser Omicron-Laserage Cat#Bluephoton® TA Deepstar® Series – 375 nm – 488 nm CryoSIM 647 nm laser Omicron-Laserage Cat#Redphoton® TA Deepstar® Series – 635 nm – 1060 nm CryoSIM 561 nm laser Cobolt Model#Sapphire laser CryoSIM 520/35 nm filter Semrock Cat#BrightLine® single-band bandpass filter, FF01-520/35-25 CryoSIM nematic liquid crystal Meadowlark Optics Cat#PDM512 CryoSIM polarization rotator Meadowlark Optics Cat#LPR-100-λ CryoSIM multi band dichroic Chroma Cat#ZT405-488-561-647-22.5deg (this paper) CryoSIM 100X air objective Nikon Model#CFI TU Plan Apo EPI 100X, 0.9 NA CryoSIM cameras Oxford Instruments Cat#Andor iXon Ultra 897 CryoSIM & Axioimager Linkam cryostages Linkam Scientific Cat#CMS196M LED Cryo Correlative Stage Axioimager microscope Carl Zeiss AG Model#Axio Imager 2 Axioimager 50x objective Carl Zeiss AG Model#50x / 0,55 DIC Confocal microscope PerkinElmer N/A Confocal 60x objective Nikon Model#1.49 NA, Apo TIRF Confocal 100x objective Nikon Model#1.4 NA, Plan Apo VC Confocal camera Hamamatsu Cat#CMOS, Orca Flash 4 TXRM microscope Carl Zeiss X-ray Microscopy, Inc. Cat#UltraXRM-S220C TXRM photon detector Princeton Instruments Cat#Pixis1024B CCD TXRM camera Teledyne Cat#Retiga 4000R Resource Availability Lead Contact Further information and requests for resources and reagents should be directed to and will be fulfilled by the Lead Contact, Maria Harkiolaki ( maria.harkiolaki@diamond.ac.uk ).
Materials Availability
This study did not generate new unique reagents Data and Code Availability Original imaging data referenced in the manuscript is deposited at the BioImage Archive ( https://www.ebi.ac.uk/biostudies/BioImages ) and EMPIAR ( https://www.ebi.ac.uk/pdbe/emdb/empiar/ ) is. The accession numbers for the data are EMPIAR: EMPIAR-10412, EMPIAR-10413, EMPIAR-10414, EMPIAR-10415, EMPIAR-10416, EMPIAR-10417, EMPIAR-10418, EMPIAR-10419 and BioImage Archive: S-BIAD17, S-BIAD18, S-BIAD19 and S-BIAD20.
Experimental Model and Subject Details Cell lines and culture conditions
Cell culture and cell lines U2OS cells (ATCC), or U2OS cells expressing galectin3-mCherry (a kind gift from Harold Wodrich, Bordeaux) were kept in Dulbeccos’ modified Eagle medium (DMEM) (Thermo Fischer Scientific) containing 10% Fetal Bovine Serum (FBS) (Capricorn) and 1% vol/vol of penicillin/streptomycin (Thermo Fischer Scientific) at 37 °C and 5% CO 2 . Within the U2OS population presented in this work, only a proportion of the cells expressed endogenously fluorescent Gal3 (designed to be selected under antibiotic control; no antibiotics were used in this case leading to a mixed population). Suspensions of L-cells (ATCC) for virus production were maintained in Joklik MEM medium (Sigma-Aldrich) supplemented with 1% L-Glutamine (Thermo Fischer Scientific), 2% FBS, 2% Neonatal calf serum (Thermo Fischer Scientific) and 1% penicillin/streptomycin at 35°C.
BSC-1 cells
(ATCC) were cultured and maintained in DMEM supplemented with 10% FBS and 1% penicillin/streptomycin.
Method Details CryoSIM optical setup
Excitation path: The illumination path consists of dichroics and mirrors to combine 4 linearly vertically polarized illumination beams (405 nm, 488 nm, and 647 nm Omicron Deepstar lasers; 561 nm Cobolt Sapphire laser; the polarization angles are carefully matched using half-wave plates). The combined light is then passed into a telescope section with a pinhole at the focus to act as a spatial filter. This infinity focused beam is delivered to the main beam height (200 mm) and passed through a square aperture onto a variable phase delay nematic liquid crystal on silicon SLM (Meadowlark Optics, 512×512 SLM, PDM512) used as a phase grating to produce structured illumination patterns. The light reflected from the SLM is refocused by a lens (all lenses are achromatic doublets) to produce an array of diffraction spots. An aperture at the focus of this lens blocks light from higher order diffraction spots, allowing orders 0 and ± 1 through. These pass through a half waveplate and then an LCD based polarization rotator (Meadowlark Optics, LPR-100λ) to maintain radially linearly polarized spots (necessary to ensure good structured illumination pattern contrast in the image plane). Another telescope transfers the spot images on to a silver coated mirror, passing through a primary dichroic (Chroma ZT 405-488-561-647-22.5deg). This dichroic transmits the excitation light and reflects the emitted fluorescence. The reflected beam passes through another telescope and reimages the focused diffraction spots in the back focal plane of the objective. A 45° mirror reflects the beam down onto the sample through an 100X air objective (Nikon, CFI TU Plan Apo EPI 100X, 0.9 NA, 2 mm working distance). Emission path: Fluorescence signal from the sample is collected by the objective and transmitted back from the 45° mirror, through a 1:1 telescope and reflected by the silver-coated mirror upstream then separated from the excitation light by the primary dichroic. The emitted light is then reflected toward the cameras (Oxford Instuments, Andor iXon Ultra 897) by a broadband dielectric mirror and a final telescope which magnifies the image to optimize the camera pixel size to the optical resolution. There is a secondary dichroic, that splits the light before the detectors. Each detector has a dedicated filter wheel to allow selection of different emission channels. All hardware is controlled by two open source software packages, Cockpit and Python Microscope. These packages allow control of complex microscope systems in real time and provide a simple, user-friendly interface. SIM resolution doubling is achieved by the structured illumination encoding the whole image content around each of the 5 spots, in the Fourier representation of the image, induced by the structured illumination. This information is separated and the copies of the image information are then all moved to the origin. If the highest frequency stripes are right at the edge of the observable region in the microscope, shifting these data to the origin moves the corresponding data on the opposite side of the Fourier transform to double its original frequency, hence doubling the highest detectable spatial frequency, and hence the resolution. Using lower frequencies stripes will mean these data are moved less far in Fourier space and produces a reduced resolution increase. In order to ensure adequate signal to noise in the high frequency information, we set the stripe width to larger than the finest possible, as this significantly increases the amplitude of the high frequency information returned ( Figure S1 ). As a compromise between the achievable resolution increase in SIM and the reduction of signal with progressively finer stripe widths, we chose a stripe width of 396 nm with 488 nm excitation. This relatively coarse stripe width moves the information from the Moiré fringes in the SIM Fourier images away from the edge of the observable region, toward the center. Given that during reconstruction, the information is moved less far in Fourier space, a smaller resolution increase can be achieved. The 396 nm stripes we use with 488 nm excitation produce a maximal possible resolution in the SIM reconstructions of 190 nm, as opposed to the theoretical maximum of 180 nm with 525 nm emission light. However, with this small resolution reduction we roughly double the intensity of this shifted information content dramatically increasing the signal to noise ratio in the highest resolution information in the reconstructions. With a theoretical resolution of 190 nm, we reliably produce real images with resolutions of 200 nm. A full list of theoretical and achieved resolutions is given in Table S1 . CryoSIM layout, optics, hardware and software can be found at Dobbie et al. (2020) DOII). SXT setup The TXM is illuminated by synchrotron radiation supplied by a bending magnet, focused by a toroidal mirror and conditioned with a plane grating monochromator and exit slit module that can deliver highly monochromatic beam at 500 eV ( Figures 2 A–2C). This beam forms a secondary light source which is delivered to the microscope and focused by a glass capillary condenser lens onto the sample. A zone plate objective focuses the resulting projections onto a highly sensitive photon detector (Princeton Instruments, Pixis1024B CCD). Samples on standard cryo-EM grids are placed into the X-ray microscope using a transfer chamber that facilitates transition from liquid nitrogen storage under atmospheric pressure to active cooling via conduction in high vacuum (10 −6 to 10 −8 mbar, essential as soft X-rays have poor penetration at atmospheric pressure). Because of the divergence of synchrotron bending magnet sources, the size of the focused X-ray beam at the sample position is approximately 1.2 μm. To illuminate the maximum field of view (FOV) possible, the condenser oscillates following a Lissajous pattern, matching the acceptance of the 40 nm zone plate objective while illuminating an augmented 16x16 μm 2 area at the sample plane (10x10 μm 2 for the 25 nm objective) ( Figure 2 D). Samples at the imaging position are close to both the capillary condenser and the zone plate objective, circa 6 mm and 5 mm from each ( Figure 2 E), limiting specimen tilt to a maximum of ±70°, which leads to missing wedge artifacts. This may be mitigated in part by tilting around two orthogonal axes ( Mastronarde, 1997 ) and SXT data collection at beamline B24 can be done using one or two axes depending on project and sample requirements. The zone plate objectives of the system are designed to focus soft X-rays; they are made of a series of concentric metal rings of radially decreasing width that are installed approximately 5 mm after the sample (beam divergence of 1.7 mrad; zone plate diameter of 150 μm). The resolution, δ , of this microscope depends on its optics and specifically the width of the outer most zone of its objective ( δ = 1.22 Δ r n for incoherent imaging).
Virus production and purification Reovirus
T3D strain was produced by infecting suspension of L-cells with a T3D stock originally obtained from B. N. Fields. Virus particles were pre-purified from L-929 cells (ATCC) by sonication and freon (1,1,2-trichloro-1,2,2-trifluoroethane; Sigma-Aldrich) extraction; virus particles were then purified through ultracentrifugation on Cesium Chloride (CsCl) (Sigma-Aldrich) gradient and stored in virus buffer (150 mM NaCl, 10 mM MgCl2, and 10 mM Tris-HCl, ph7.5) as previously described ( Fratini et al., 2018 ). Virus labeling 100 μL of reovirus particles (from 10 13 particles/ml stock) were mixed with 0.4 μL of Alexa488 or Alexa647 NHS Ester (Thermo Fisher Scientific) or Alexa647 NHS Ester (8mM starting concentration) for 1h at room temperature (RT). To remove unbound fluorophores, virus particles were then purified by gel filtration (Zeba Spin Desalting Columns, 7K MWCO, Thermo Fischer Scientific).
Live-cell imaging of virus infection
U2OS wild-type or stably expressing mCherry-Gal3 were transfected with an eGFP-Rab7 (Addgene) expressing plasmid 16 h prior to imaging. MRV labeled with Alexa647 was added to cells and then imaging was started. Live-cell imaging was performed with an inverted spinning-disk confocal microscope (PerkinElmer) using oil immersion objectives (60x, 1.49 NA, Apo TIRF, Nikon or 100x, 1.4 NA, Plan Apo VC, Nikon) and a CMOS camera (Orca Flash 4, Hamamatsu). Cells, objectives and microscope stage were kept at 37°C and 5% CO 2 through the presence of an environment-control chamber. Cells were imaged in 0.5 μM stacks 5min apart for 180 min.
Virus infection for X-ray imaging
U2OS cells stably expressing mCherry-Gal3 were seeded onto TEM grids (Quantifoil AU G200F1 finder) 16 h prior to infection. MRV labeled with Alexa488 was added to cells along with 250 nm gold nanoparticle fiducials (BBI Solutions) and grids were frozen in liquid nitrogen-cooled liquid ethane using Leica EM GP2 plunge freezer with a 2 s blotting time at 1h intervals. BSC-1 cells were also seeded on TEM grids 16 h prior to infection. Cells were infected with MRV at an MOI of 100 and 16 h after infection grids were frozen in liquid nitrogen-cooled liquid ethane using a Leica EM GP2 plunge freezer with a 2 s blotting time. Monitoring infection status Infection prevalence was confirmed via confocal microscopy (presence of green fluorescence virus components intracellularly) before sample vitrification but also with inspection of the same signal once vitrified using a Linkam cryo-stage on a conventional microscope (AxioImager2) using a 50x objective (0,55 DIC). The latter allowed us to map grids (using the Linkam’s LINK software) and assess their quality with respect to population density, vitrification, presence of fluorophores and grid integrity.
Cryo-SIM imaging and high-resolution data reconstruction
Vitrified samples on grids were transferred to the cryoSIM and brightfield imaging was first employed to generate mosaics, where individual cells were evaluated based on cell location (likely to allow data collection on both this instrument and the TXM) and overall state (no obvious grid surface or cell sample disruption). Samples were then imaged in both green and red fluorescence to identify individual cells within the population that both expressed fluorescent Gal3 and were infected with fluorescent virus. 3D-SIM data were collected on a number of these representative cells (4 mock-infected controls, 8 at 1h after infection, 11 at 2 h after infection, 11 at 3 h after infection and 5 at 4 h after infection). Data were reconstructed with SoftWoRX 6.5.2 (GE Healthcare) using real optical transfer functions generated from 3D-SIM images of 175 nm single-color fluorescent beads (PS-Speck, Thermo Fisher Scientific) to produce super-resolution image stacks. Multi-channel images were aligned with Chromagnon ( Matsuda et al., 2018 ). The raw and reconstructed data were analyzed in Fiji ( Schindelin et al., 2012 ) using SIMcheck ( Ball et al., 2015 ) to ensure the results were realistic and contained no artifacts.
Cryo-soft X-ray Tomography and X-ray data reconstruction
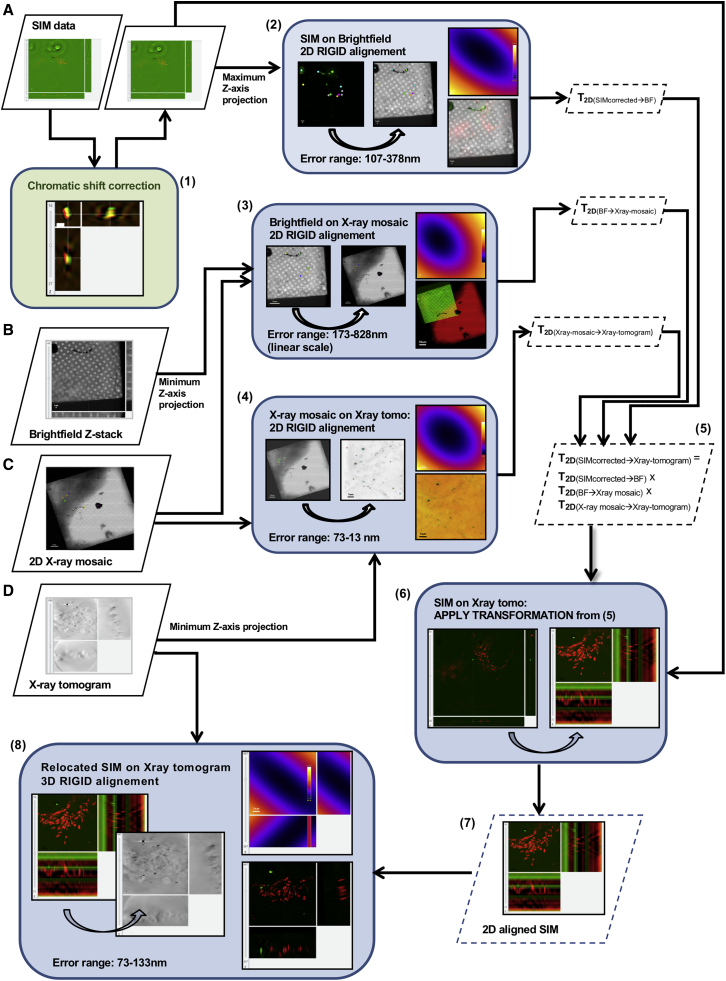
X-ray data were collected with an UltraXRM-S/L220c X-ray microscope (Carl Zeiss X-ray Microscopy, Inc.) at beamline B24 (DLS) using 500 eV X-rays. This instrument is fitted with a capillary condenser, a 40nm zone plate objective (25 nm for the BSC-1 work) and a 1024B Pixis CCD camera (Princeton instruments). Samples were loaded into the microscope chamber in batches of four and were assessed for structural integrity and alignment potential, inspecting them first with the in-line visible light 20x objective to give an overall map of the grid using visible light (images recorded on a Retiga 4000R camera; Teledyne). X-rays were then used to generate X-ray 2D mosaic maps of grid boxes that contained ROIs. The visible light microscopy setup benefits from a variable visible light LED which was used to confirm fluorophore presence and agreement with the fluorescence signal recorded in the cryoSIM. Tilt series were collected from –65° to +65° at increments of 0.5° on 3 mock-infected cells, 4 cells at 1h after infection, 8 cells at 2 h after infection, 4 cells at 3h after infection and 5 cells at 4h after infection (all previously imaged at the cryoSIM). All data were aligned and reconstructed automatically to tomograms using the in-house pipeline which employs Batchruntomo ( Mastronarde and Held, 2017 ) via a number of scripts to allow parallel and near real-time processing. Specifically, three protocols for alignment and reconstruction are currently provided: weighted back projection (WBP), simultaneous iterative reconstruction techniques (SIRT) and automatic patch tracking. Batchruntomo ( Mastronarde and Held, 2017 ) is part of the IMOD package (version 4.9.2) ( Kremer et al., 1996 ). Where necessary, multiple adjacent sites were used for data collection for subsequent stitching and FOV expansion. Correlative cryo-SXT / cryo-SIM imaging Equivalent cryo-SIM and cryo-SXT datasets were overlaid with the multidimensional registration software eC-CLEM ( Paul-Gilloteaux et al., 2017 ) ( Figure S4 ). Initially, cryo-SXT tomograms and chromatic drift-corrected multichannel SIM images were relocated. For this the 2D dimensional transformation between SIM data and X-ray tomograms was computed using the 2D rigid registration mode of eC-CLEM (coarse alignment) ( Paul-Gilloteaux et al., 2017 ). This transformation was computed as a combination of 2D independent paired relocations; (a) SIM data on brightfield image stacks, (b) brightfield data on 2D X-ray mosaics and (c) X-ray mosaics on X-ray tomogram positions. Note that accuracy is not the main target in this step, in particular because volumes were processed as 2D data. The 2D transformation from SIM to X-ray tomogram was then applied to align in 2D the 3D SIM and X-ray ROI data, as initialisation for the complete 3D alignment step. Features used for alignment purposes included both the nanoparticles added on samples just before vitrification as well as grid patterns (grid bars, carbon substrate holes and sample imperfections) and cellular features that displayed good contrast in both X-ray and fluorescence microscopy (fluorescent endosomes in this case). The next phase involved the accurate 3D registration of the 3D chromatic drift-corrected cryo-SIM data to the respective 3D cryo-SXT data, using the 3D rigid mode of eC-CLEM ( Paul-Gilloteaux et al., 2017 ). We note that no deformation was used to align data; the only allowed degrees of freedom in this process were 3D rotation, translation and isotropic scaling of data (which was found to be negligible at about 2%). Quantification and Statistical Analysis In Figure 6 C, error bars indicate standard deviation of n = 8 in b and n = 9 in (B) and (C).
Materials Availability
This study did not generate new unique reagents
Experimental Model and Subject Details Cell lines and culture conditions
Cell culture and cell lines U2OS cells (ATCC), or U2OS cells expressing galectin3-mCherry (a kind gift from Harold Wodrich, Bordeaux) were kept in Dulbeccos’ modified Eagle medium (DMEM) (Thermo Fischer Scientific) containing 10% Fetal Bovine Serum (FBS) (Capricorn) and 1% vol/vol of penicillin/streptomycin (Thermo Fischer Scientific) at 37 °C and 5% CO 2 . Within the U2OS population presented in this work, only a proportion of the cells expressed endogenously fluorescent Gal3 (designed to be selected under antibiotic control; no antibiotics were used in this case leading to a mixed population). Suspensions of L-cells (ATCC) for virus production were maintained in Joklik MEM medium (Sigma-Aldrich) supplemented with 1% L-Glutamine (Thermo Fischer Scientific), 2% FBS, 2% Neonatal calf serum (Thermo Fischer Scientific) and 1% penicillin/streptomycin at 35°C.
BSC-1 cells
(ATCC) were cultured and maintained in DMEM supplemented with 10% FBS and 1% penicillin/streptomycin.
Method Details CryoSIM optical setup
Excitation path: The illumination path consists of dichroics and mirrors to combine 4 linearly vertically polarized illumination beams (405 nm, 488 nm, and 647 nm Omicron Deepstar lasers; 561 nm Cobolt Sapphire laser; the polarization angles are carefully matched using half-wave plates). The combined light is then passed into a telescope section with a pinhole at the focus to act as a spatial filter. This infinity focused beam is delivered to the main beam height (200 mm) and passed through a square aperture onto a variable phase delay nematic liquid crystal on silicon SLM (Meadowlark Optics, 512×512 SLM, PDM512) used as a phase grating to produce structured illumination patterns. The light reflected from the SLM is refocused by a lens (all lenses are achromatic doublets) to produce an array of diffraction spots. An aperture at the focus of this lens blocks light from higher order diffraction spots, allowing orders 0 and ± 1 through. These pass through a half waveplate and then an LCD based polarization rotator (Meadowlark Optics, LPR-100λ) to maintain radially linearly polarized spots (necessary to ensure good structured illumination pattern contrast in the image plane). Another telescope transfers the spot images on to a silver coated mirror, passing through a primary dichroic (Chroma ZT 405-488-561-647-22.5deg). This dichroic transmits the excitation light and reflects the emitted fluorescence. The reflected beam passes through another telescope and reimages the focused diffraction spots in the back focal plane of the objective. A 45° mirror reflects the beam down onto the sample through an 100X air objective (Nikon, CFI TU Plan Apo EPI 100X, 0.9 NA, 2 mm working distance). Emission path: Fluorescence signal from the sample is collected by the objective and transmitted back from the 45° mirror, through a 1:1 telescope and reflected by the silver-coated mirror upstream then separated from the excitation light by the primary dichroic. The emitted light is then reflected toward the cameras (Oxford Instuments, Andor iXon Ultra 897) by a broadband dielectric mirror and a final telescope which magnifies the image to optimize the camera pixel size to the optical resolution. There is a secondary dichroic, that splits the light before the detectors. Each detector has a dedicated filter wheel to allow selection of different emission channels. All hardware is controlled by two open source software packages, Cockpit and Python Microscope. These packages allow control of complex microscope systems in real time and provide a simple, user-friendly interface. SIM resolution doubling is achieved by the structured illumination encoding the whole image content around each of the 5 spots, in the Fourier representation of the image, induced by the structured illumination. This information is separated and the copies of the image information are then all moved to the origin. If the highest frequency stripes are right at the edge of the observable region in the microscope, shifting these data to the origin moves the corresponding data on the opposite side of the Fourier transform to double its original frequency, hence doubling the highest detectable spatial frequency, and hence the resolution. Using lower frequencies stripes will mean these data are moved less far in Fourier space and produces a reduced resolution increase. In order to ensure adequate signal to noise in the high frequency information, we set the stripe width to larger than the finest possible, as this significantly increases the amplitude of the high frequency information returned ( Figure S1 ). As a compromise between the achievable resolution increase in SIM and the reduction of signal with progressively finer stripe widths, we chose a stripe width of 396 nm with 488 nm excitation. This relatively coarse stripe width moves the information from the Moiré fringes in the SIM Fourier images away from the edge of the observable region, toward the center. Given that during reconstruction, the information is moved less far in Fourier space, a smaller resolution increase can be achieved. The 396 nm stripes we use with 488 nm excitation produce a maximal possible resolution in the SIM reconstructions of 190 nm, as opposed to the theoretical maximum of 180 nm with 525 nm emission light. However, with this small resolution reduction we roughly double the intensity of this shifted information content dramatically increasing the signal to noise ratio in the highest resolution information in the reconstructions. With a theoretical resolution of 190 nm, we reliably produce real images with resolutions of 200 nm. A full list of theoretical and achieved resolutions is given in Table S1 . CryoSIM layout, optics, hardware and software can be found at Dobbie et al. (2020) DOII). SXT setup The TXM is illuminated by synchrotron radiation supplied by a bending magnet, focused by a toroidal mirror and conditioned with a plane grating monochromator and exit slit module that can deliver highly monochromatic beam at 500 eV ( Figures 2 A–2C). This beam forms a secondary light source which is delivered to the microscope and focused by a glass capillary condenser lens onto the sample. A zone plate objective focuses the resulting projections onto a highly sensitive photon detector (Princeton Instruments, Pixis1024B CCD). Samples on standard cryo-EM grids are placed into the X-ray microscope using a transfer chamber that facilitates transition from liquid nitrogen storage under atmospheric pressure to active cooling via conduction in high vacuum (10 −6 to 10 −8 mbar, essential as soft X-rays have poor penetration at atmospheric pressure). Because of the divergence of synchrotron bending magnet sources, the size of the focused X-ray beam at the sample position is approximately 1.2 μm. To illuminate the maximum field of view (FOV) possible, the condenser oscillates following a Lissajous pattern, matching the acceptance of the 40 nm zone plate objective while illuminating an augmented 16x16 μm 2 area at the sample plane (10x10 μm 2 for the 25 nm objective) ( Figure 2 D). Samples at the imaging position are close to both the capillary condenser and the zone plate objective, circa 6 mm and 5 mm from each ( Figure 2 E), limiting specimen tilt to a maximum of ±70°, which leads to missing wedge artifacts. This may be mitigated in part by tilting around two orthogonal axes ( Mastronarde, 1997 ) and SXT data collection at beamline B24 can be done using one or two axes depending on project and sample requirements. The zone plate objectives of the system are designed to focus soft X-rays; they are made of a series of concentric metal rings of radially decreasing width that are installed approximately 5 mm after the sample (beam divergence of 1.7 mrad; zone plate diameter of 150 μm). The resolution, δ , of this microscope depends on its optics and specifically the width of the outer most zone of its objective ( δ = 1.22 Δ r n for incoherent imaging).
Virus production and purification Reovirus
T3D strain was produced by infecting suspension of L-cells with a T3D stock originally obtained from B. N. Fields. Virus particles were pre-purified from L-929 cells (ATCC) by sonication and freon (1,1,2-trichloro-1,2,2-trifluoroethane; Sigma-Aldrich) extraction; virus particles were then purified through ultracentrifugation on Cesium Chloride (CsCl) (Sigma-Aldrich) gradient and stored in virus buffer (150 mM NaCl, 10 mM MgCl2, and 10 mM Tris-HCl, ph7.5) as previously described ( Fratini et al., 2018 ). Virus labeling 100 μL of reovirus particles (from 10 13 particles/ml stock) were mixed with 0.4 μL of Alexa488 or Alexa647 NHS Ester (Thermo Fisher Scientific) or Alexa647 NHS Ester (8mM starting concentration) for 1h at room temperature (RT). To remove unbound fluorophores, virus particles were then purified by gel filtration (Zeba Spin Desalting Columns, 7K MWCO, Thermo Fischer Scientific).
Live-cell imaging of virus infection
U2OS wild-type or stably expressing mCherry-Gal3 were transfected with an eGFP-Rab7 (Addgene) expressing plasmid 16 h prior to imaging. MRV labeled with Alexa647 was added to cells and then imaging was started. Live-cell imaging was performed with an inverted spinning-disk confocal microscope (PerkinElmer) using oil immersion objectives (60x, 1.49 NA, Apo TIRF, Nikon or 100x, 1.4 NA, Plan Apo VC, Nikon) and a CMOS camera (Orca Flash 4, Hamamatsu). Cells, objectives and microscope stage were kept at 37°C and 5% CO 2 through the presence of an environment-control chamber. Cells were imaged in 0.5 μM stacks 5min apart for 180 min.
Virus infection for X-ray imaging
U2OS cells stably expressing mCherry-Gal3 were seeded onto TEM grids (Quantifoil AU G200F1 finder) 16 h prior to infection. MRV labeled with Alexa488 was added to cells along with 250 nm gold nanoparticle fiducials (BBI Solutions) and grids were frozen in liquid nitrogen-cooled liquid ethane using Leica EM GP2 plunge freezer with a 2 s blotting time at 1h intervals. BSC-1 cells were also seeded on TEM grids 16 h prior to infection. Cells were infected with MRV at an MOI of 100 and 16 h after infection grids were frozen in liquid nitrogen-cooled liquid ethane using a Leica EM GP2 plunge freezer with a 2 s blotting time. Monitoring infection status Infection prevalence was confirmed via confocal microscopy (presence of green fluorescence virus components intracellularly) before sample vitrification but also with inspection of the same signal once vitrified using a Linkam cryo-stage on a conventional microscope (AxioImager2) using a 50x objective (0,55 DIC). The latter allowed us to map grids (using the Linkam’s LINK software) and assess their quality with respect to population density, vitrification, presence of fluorophores and grid integrity.
Cryo-SIM imaging and high-resolution data reconstruction
Vitrified samples on grids were transferred to the cryoSIM and brightfield imaging was first employed to generate mosaics, where individual cells were evaluated based on cell location (likely to allow data collection on both this instrument and the TXM) and overall state (no obvious grid surface or cell sample disruption). Samples were then imaged in both green and red fluorescence to identify individual cells within the population that both expressed fluorescent Gal3 and were infected with fluorescent virus. 3D-SIM data were collected on a number of these representative cells (4 mock-infected controls, 8 at 1h after infection, 11 at 2 h after infection, 11 at 3 h after infection and 5 at 4 h after infection). Data were reconstructed with SoftWoRX 6.5.2 (GE Healthcare) using real optical transfer functions generated from 3D-SIM images of 175 nm single-color fluorescent beads (PS-Speck, Thermo Fisher Scientific) to produce super-resolution image stacks. Multi-channel images were aligned with Chromagnon ( Matsuda et al., 2018 ). The raw and reconstructed data were analyzed in Fiji ( Schindelin et al., 2012 ) using SIMcheck ( Ball et al., 2015 ) to ensure the results were realistic and contained no artifacts.
Cryo-soft X-ray Tomography and X-ray data reconstruction
X-ray data were collected with an UltraXRM-S/L220c X-ray microscope (Carl Zeiss X-ray Microscopy, Inc.) at beamline B24 (DLS) using 500 eV X-rays. This instrument is fitted with a capillary condenser, a 40nm zone plate objective (25 nm for the BSC-1 work) and a 1024B Pixis CCD camera (Princeton instruments). Samples were loaded into the microscope chamber in batches of four and were assessed for structural integrity and alignment potential, inspecting them first with the in-line visible light 20x objective to give an overall map of the grid using visible light (images recorded on a Retiga 4000R camera; Teledyne). X-rays were then used to generate X-ray 2D mosaic maps of grid boxes that contained ROIs. The visible light microscopy setup benefits from a variable visible light LED which was used to confirm fluorophore presence and agreement with the fluorescence signal recorded in the cryoSIM. Tilt series were collected from –65° to +65° at increments of 0.5° on 3 mock-infected cells, 4 cells at 1h after infection, 8 cells at 2 h after infection, 4 cells at 3h after infection and 5 cells at 4h after infection (all previously imaged at the cryoSIM). All data were aligned and reconstructed automatically to tomograms using the in-house pipeline which employs Batchruntomo ( Mastronarde and Held, 2017 ) via a number of scripts to allow parallel and near real-time processing. Specifically, three protocols for alignment and reconstruction are currently provided: weighted back projection (WBP), simultaneous iterative reconstruction techniques (SIRT) and automatic patch tracking. Batchruntomo ( Mastronarde and Held, 2017 ) is part of the IMOD package (version 4.9.2) ( Kremer et al., 1996 ). Where necessary, multiple adjacent sites were used for data collection for subsequent stitching and FOV expansion. Correlative cryo-SXT / cryo-SIM imaging Equivalent cryo-SIM and cryo-SXT datasets were overlaid with the multidimensional registration software eC-CLEM ( Paul-Gilloteaux et al., 2017 ) ( Figure S4 ). Initially, cryo-SXT tomograms and chromatic drift-corrected multichannel SIM images were relocated. For this the 2D dimensional transformation between SIM data and X-ray tomograms was computed using the 2D rigid registration mode of eC-CLEM (coarse alignment) ( Paul-Gilloteaux et al., 2017 ). This transformation was computed as a combination of 2D independent paired relocations; (a) SIM data on brightfield image stacks, (b) brightfield data on 2D X-ray mosaics and (c) X-ray mosaics on X-ray tomogram positions. Note that accuracy is not the main target in this step, in particular because volumes were processed as 2D data. The 2D transformation from SIM to X-ray tomogram was then applied to align in 2D the 3D SIM and X-ray ROI data, as initialisation for the complete 3D alignment step. Features used for alignment purposes included both the nanoparticles added on samples just before vitrification as well as grid patterns (grid bars, carbon substrate holes and sample imperfections) and cellular features that displayed good contrast in both X-ray and fluorescence microscopy (fluorescent endosomes in this case). The next phase involved the accurate 3D registration of the 3D chromatic drift-corrected cryo-SIM data to the respective 3D cryo-SXT data, using the 3D rigid mode of eC-CLEM ( Paul-Gilloteaux et al., 2017 ). We note that no deformation was used to align data; the only allowed degrees of freedom in this process were 3D rotation, translation and isotropic scaling of data (which was found to be negligible at about 2%).
📊 Figures
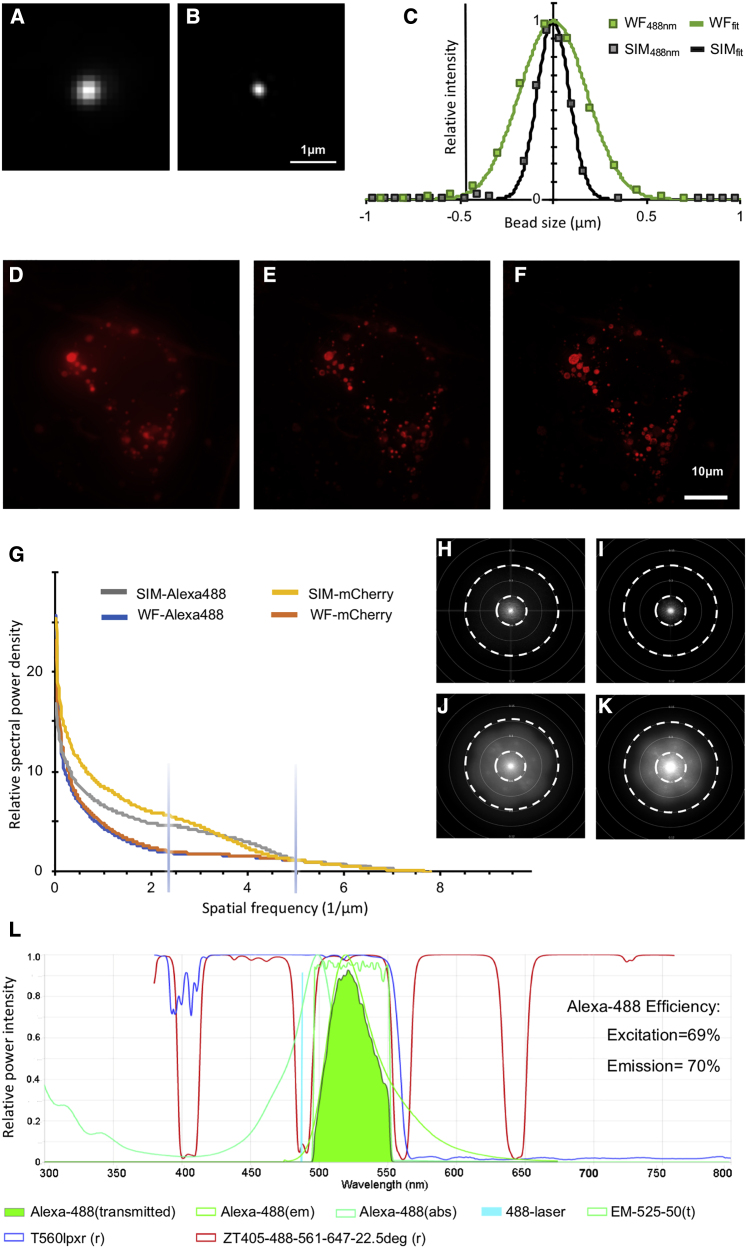
Figureu00a01
Design and performance of the super-resolution fluorescence microscope CryoSIM (A and B) Widefield (WF) (A) and SIM lateral point spread (B) of a 175u00a0nm diameter, 505/515u00a0nm wavelength microsp...
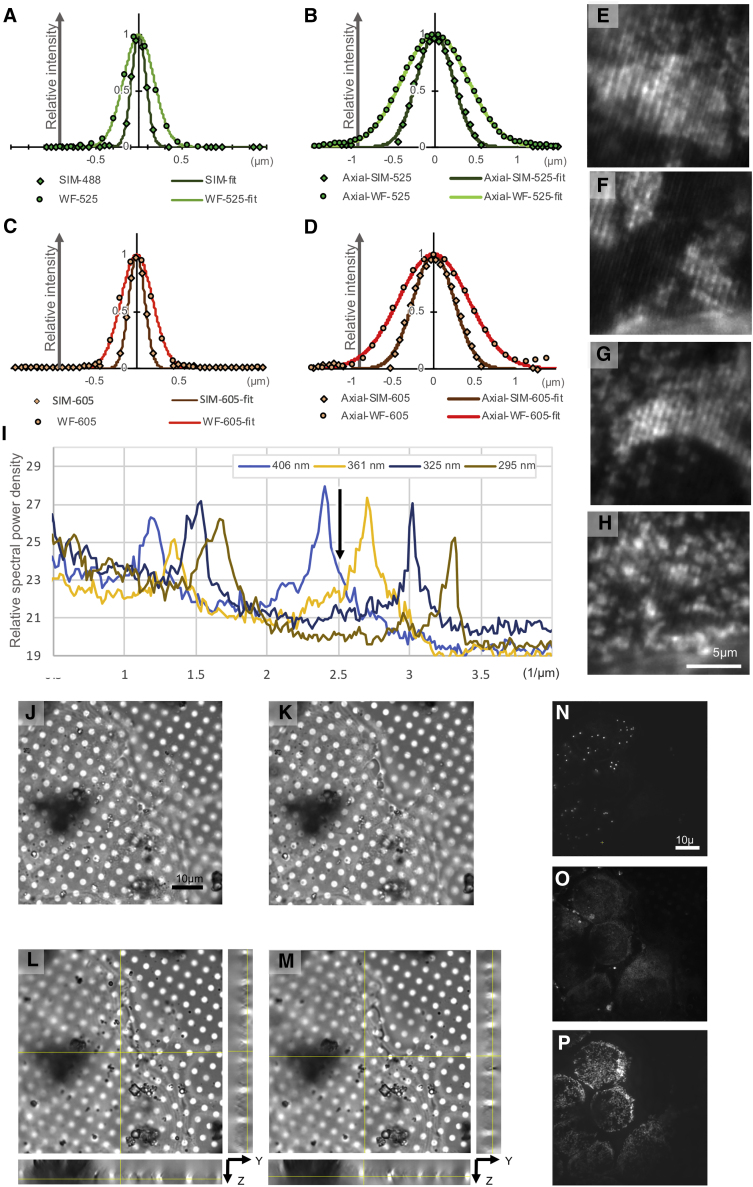
Figureu00a0S1
CryoSIM resolution parameters, related to Figureu00a01 Line scans laterally (A and C) and axially (B and D) through single fluorescent beads at 525 nm (A and B) and 605u00a0nm (C and D) emission in wi...
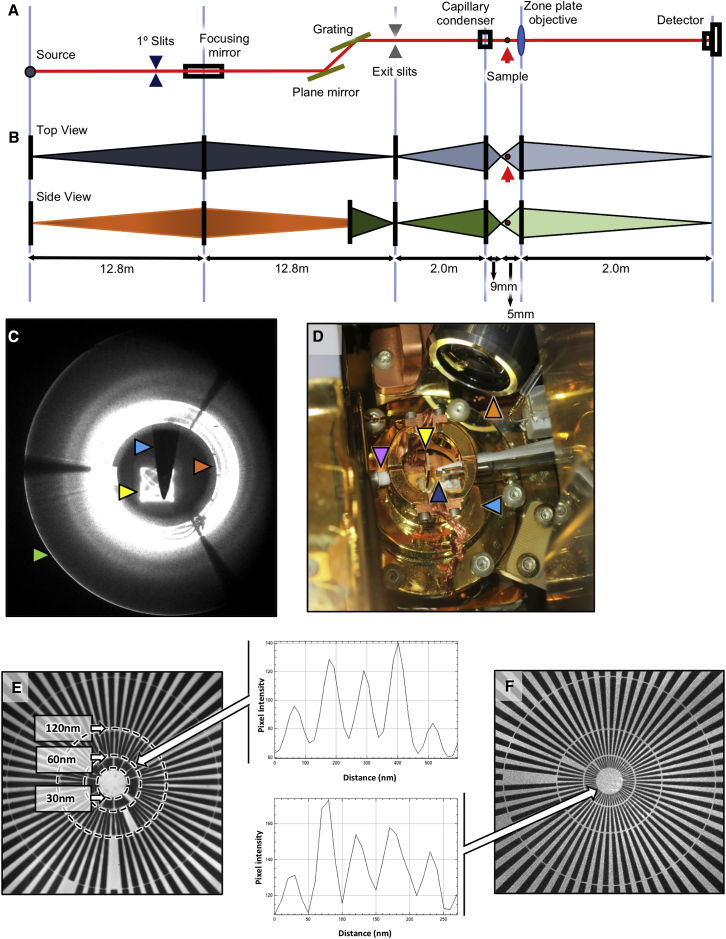
Figureu00a02
TXM optical features and resolution attained (A) Schematic representation of the X-ray optical path at beamline B24. (B) Beam divergence profile and monochromacy, top and side view. The bending magnet...
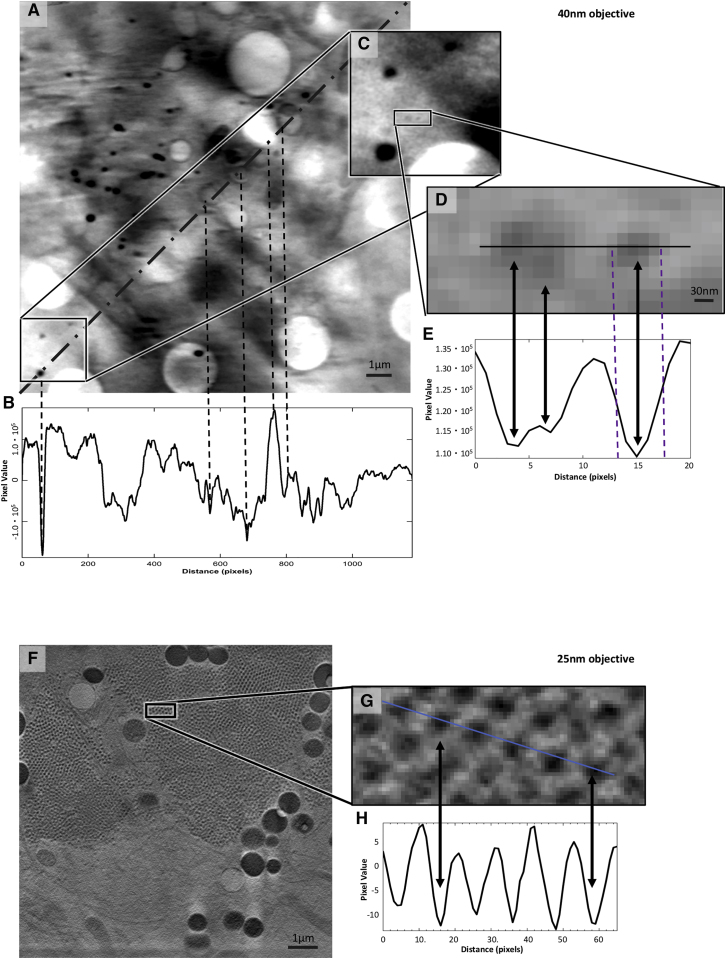
Figureu00a0S2
X-ray absorption data contrast in cells using different TXM objectives, related to Figureu00a02 (A) X-ray projection of a 16x16 u03bcm FOV collected at the beamline B24 TXM using the 40 nm objective i...
Figureu00a03
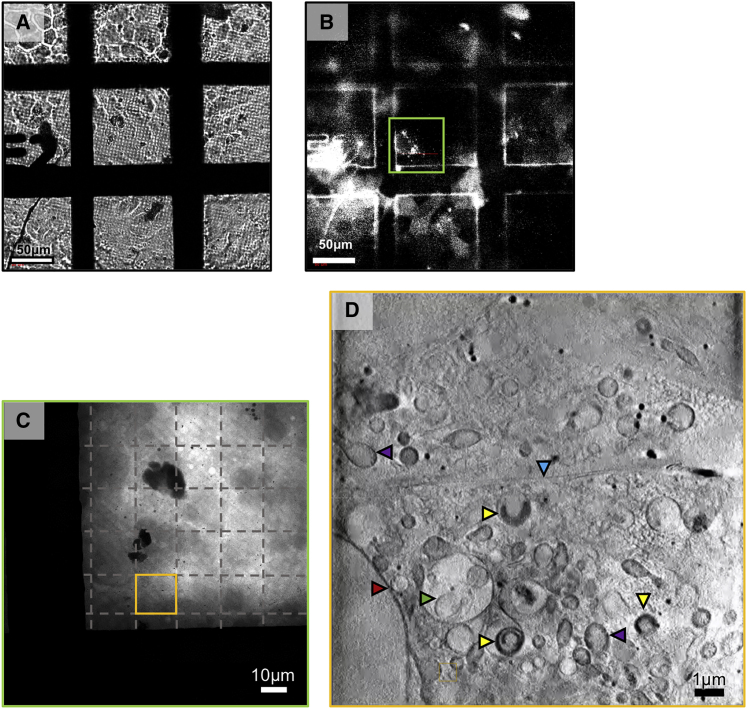
Visible light mapping and X-ray imaging process at the TXM (A and B) Brightfield (A) and fluorescence (B) in line visible-light imaging of a sample grid supporting a mixed fluorescence cell population...
Figureu00a04
Correlative imaging tools and workflow at beamline B24 with stepwise protocol for in silico correlation of data collected by using the different microscopes (A and B) Images of the TXM (A) and the cry...
Figureu00a05
In silico correlative workflow for 3D volume alignment of CryoSIM data on CryoSXT volumes (Au2013D) The registration workflow consists of two steps: an initial 2D relocation of the SIM data on the X-r...
Figureu00a0S3
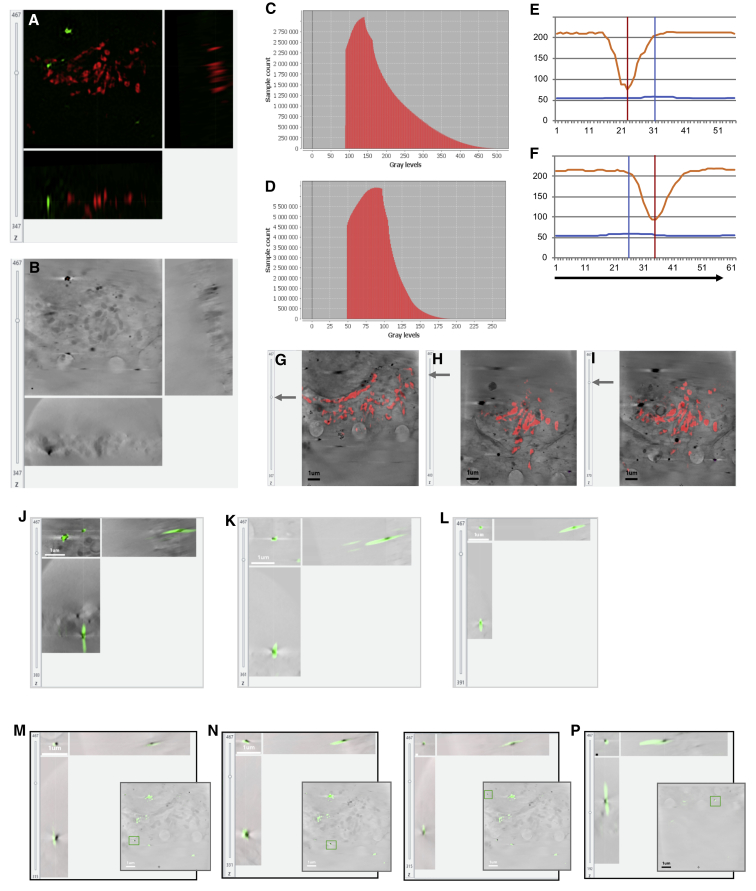
Accuracy of 3D correlation, related to Figures 4 and 5 In order to assess the accuracy of our 3D rigid registration procedure, a sample with two fluorescent features (gold beads and mitochondria) was ...
Figureu00a06
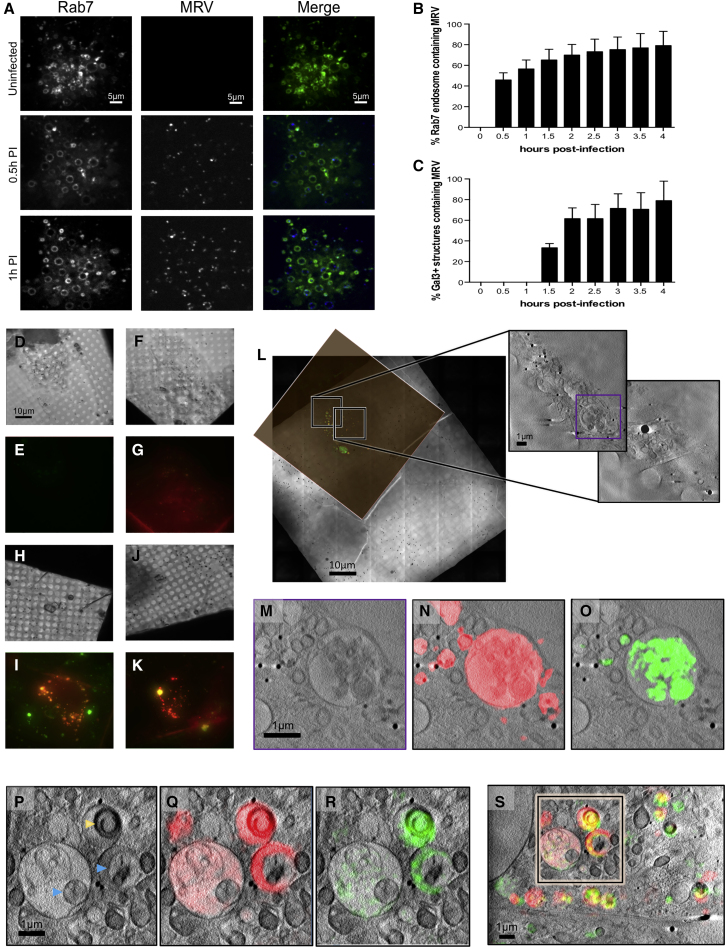
Tracking reovirus endosomal trafficking and escape (A) Confocal images of U2OS cells expressing late-endosome marker Rab7-eGFP infected with Alexa647-labeled reovirus at indicated times AI. (B and C) ...
Figureu00a0S4
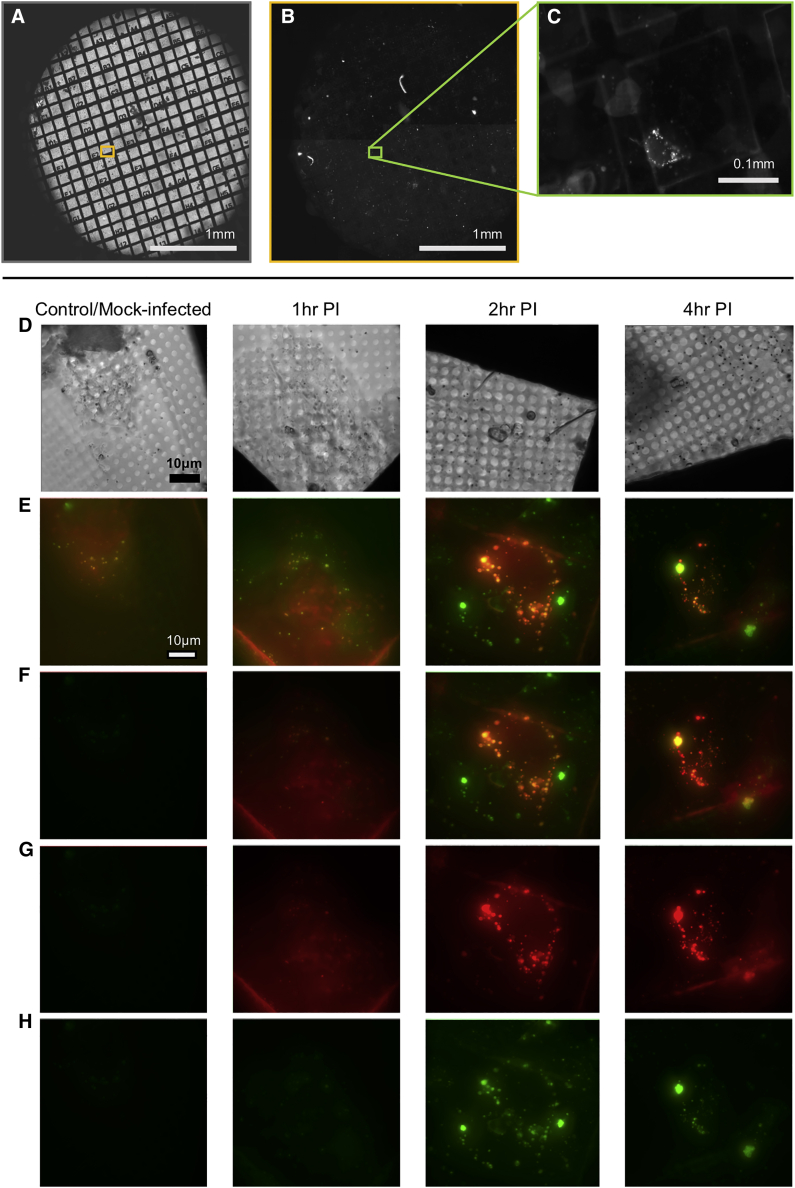
Visible light microscopy of the early stages of reovirus infection: conventional and super-resolution cryo-microscopy study, related to Figureu00a06 Conventional cryo-imaging using a AxioImager2 micro...
Figureu00a0S5
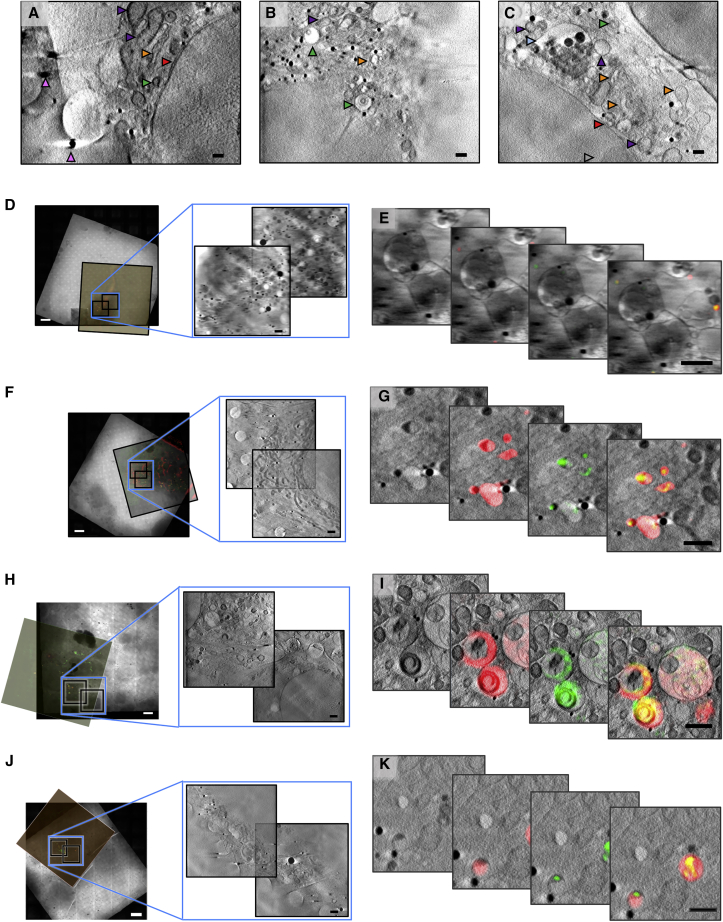
SXT and SIM imaging of mock-infected and reovirus-infected U2OS adherent cells, related to Figureu00a06 (Au2013C) Representative cross-sections from three cells, (A), (B), and (C), in the control popu...
Figureu00a0S6
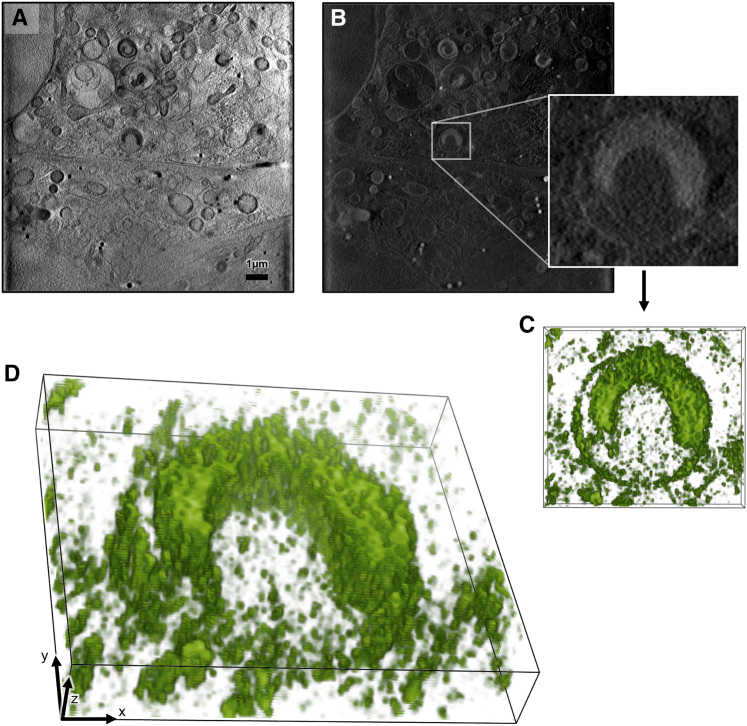
The 3D organization of virus-containing structures within cytoplasmic vesicles, related to Figureu00a06 (A and B) In (A), is a single Z axis slice of an ROI X-ray tomogram showing two infected cells a...
Figureu00a07
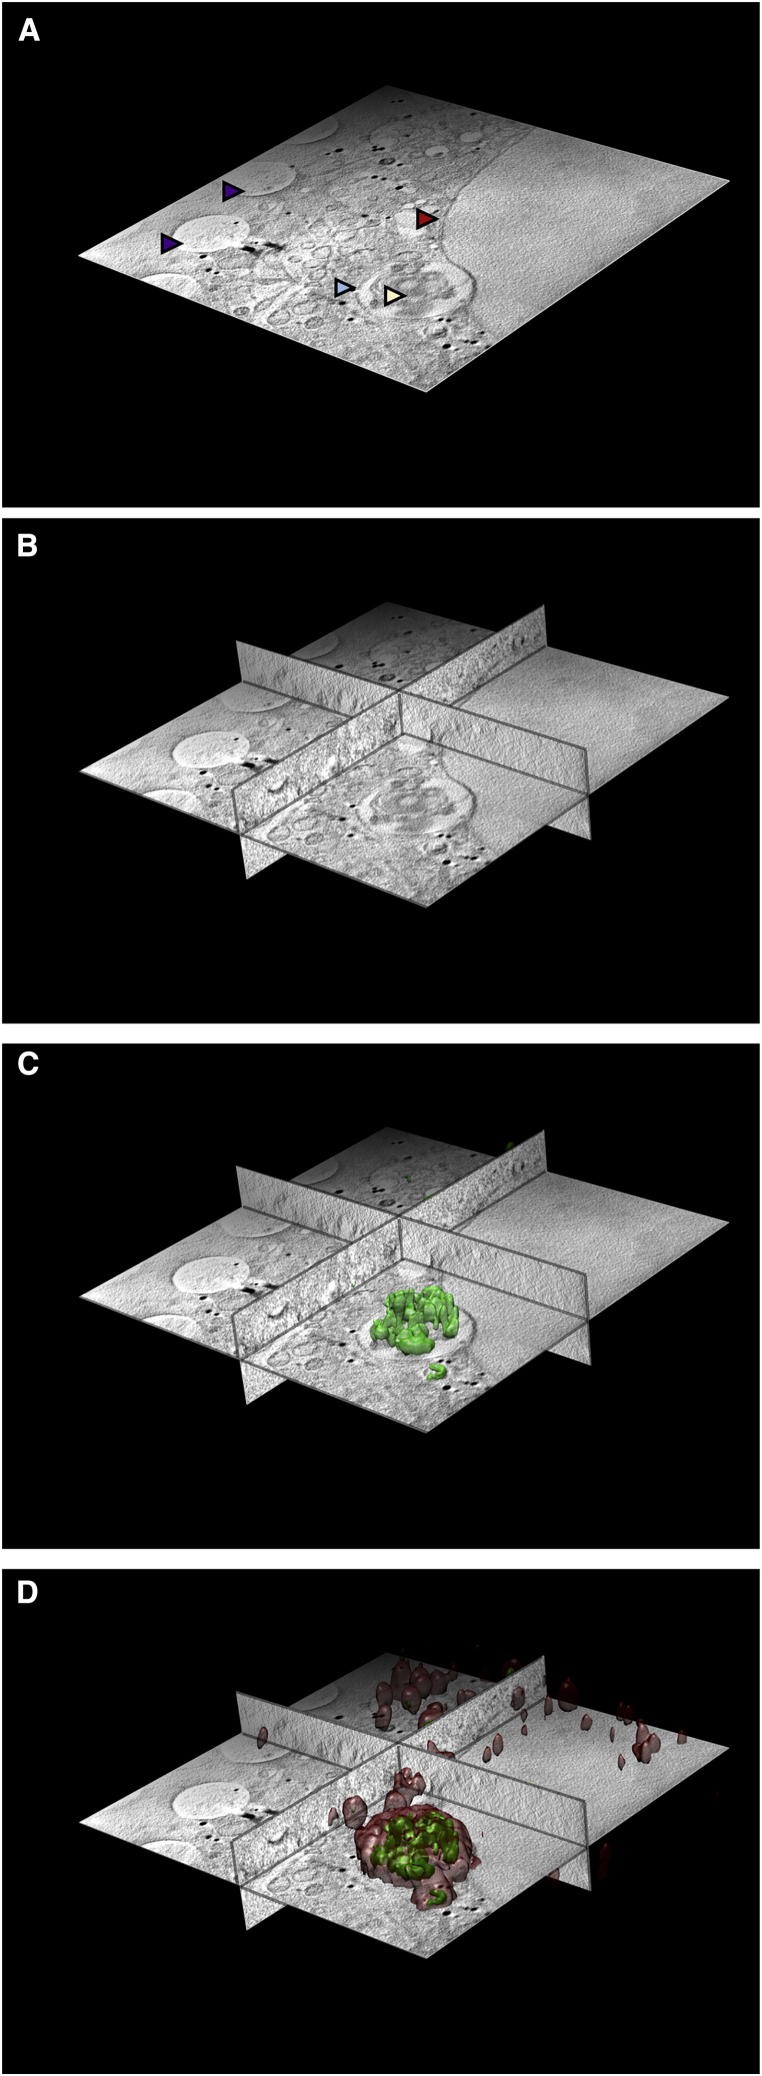
Correlation of X-ray and fluorescence data in three dimensions using the beamline B24 platform All the data shown here are from a U2OS cell vitrified 4u00a0h AI with high titers of reovirus T3D. Viral...
Figureu00a0S7
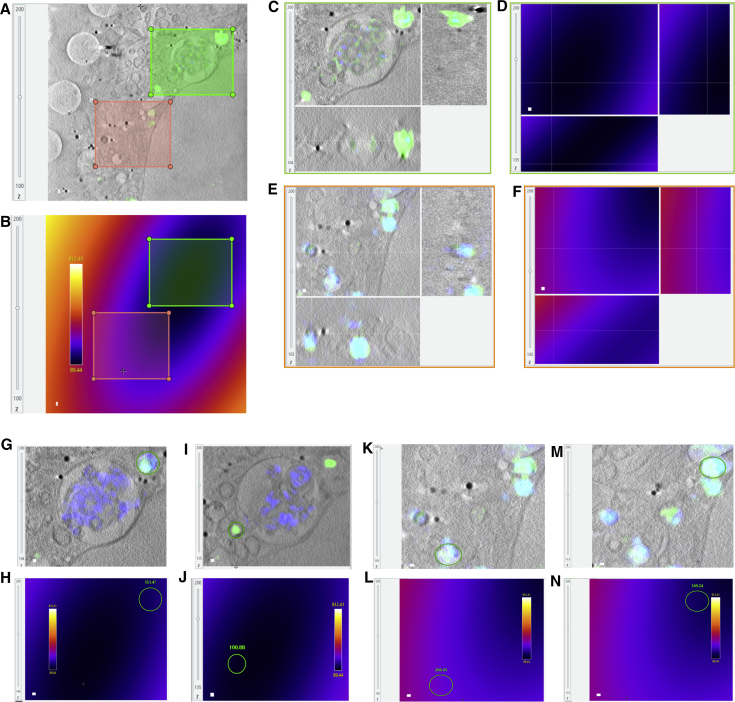
Estimation of error on reovirus datasets, related to Figures 6 , S3 , and S5 (A and B) In (A) is an XY slice of the 3D X-ray tomogram (extracted from 4 h post-infection datasets) and in (B) is the cor...
Figure images are served from the NIH/NLM PubMed Central Open Access Subset or Europe PMC; copyright remains with the publishers and authors.
💬 Discussion
0 commentsNo comments yet. Be the first to start a discussion!
Leave a Comment