Abstract
Abstract Tilted light sheet microscopy with 3D point spread functions (TILT3D) combines a novel, tilted light sheet illumination strategy with long axial range point spread functions (PSFs) for low-background, 3D super-localization of single molecules as well as 3D super-resolution imaging in thick cells. Because the axial positions of the single emitters are encoded in the shape of each single-molecule image rather than in the position or thickness of the light sheet, the light sheet need not be extremely thin. TILT3D is built upon a standard inverted microscope and has minimal custom parts. The result is simple and flexible 3D super-resolution imaging with tens of nm localization precision throughout thick mammalian cells. We validate TILT3D for 3D super-resolution imaging in mammalian cells by imaging mitochondria and the full nuclear lamina using the double-helix PSF for single-molecule detection and the recently developed tetrapod PSFs for fiducial bead tracking and live axial drift correction.
🔬 Techniques
💻 Software
✨ Fluorophores
🧪 Sample Preparation
🔬 Cell Lines
🏭 Microscope Brands
🧪 Reagent Suppliers
📷 Detectors
🎨 Filters
💻 Software Details
💾 Data Repositories
🏛️ Research Organizations (ROR)
Affiliated research institutions:
📋 Methods
Additional methods and any associated references are available in the Supplementary Information.
Optical setup
In this work, the optical setup was built around a conventional inverted microscope (IX71, Olympus) (Fig. 1 and Supplementary Fig. 1 ). Illumination lasers (405 nm, 100 mW; 561 nm, 200 mW; and 647 nm, 120 mW, all CW, from Coherent) were spectrally filtered (561 nm: ff01-554/23-25 excitation filter, 647 nm: ff01-631/36-25 excitation filter, both Semrock), circularly polarized (LPVISB050-MP2 polarizers, Thorlabs, and 405 nm: Z-10-A-.250-B-405 quarter-wave plate, Tower Optical, 561 nm: WPQ05M-561 quarter-wave plate, Thorlabs, 647 nm: WPQ05M-633 quarter-wave plate, Thorlabs), and expanded and collimated using lens telescopes. The toggling of the lasers was controlled with shutters (VS14S2T1 with VMM-D3 three-channel driver, Vincent Associates Uniblitz) and synchronized with the detection optics via MATLAB. The 405 and 561 nm lasers were introduced into the back port of the microscope through a Köhler lens to allow for wide field epi-illumination. The 647 nm laser was either introduced into the epi-illumination pathway or sent to the light sheet illumination pathway; the pathway was easily switched with a flip mirror. The light sheet illumination pathway consisted of a cylindrical lens (LJ1558L2-A, f = 300 mm, Thorlabs, or ACY254-200-A, f = 200 mm, Thorlabs), which focused the light in only one dimension onto a motorized mirror (8821 mirror mount with 8742 Picomotor controller, Newport). The motorized mirror plane was imaged onto the back aperture of a long working distance illumination objective (378-803-3, x10, NA 0.28, Mitutoyo) by two lenses in a 4 f configuration. The illumination objective then focused the light sheet, which was directed into the sample chamber (704-00-20-10, Hellma) at an angle of about 10° using a glass prism (PS908L-A, Thorlabs). The entire light sheet illumination path was mounted on a breadboard above the microscope stage, which could be moved by an xyz translation stage (460P, Newport). The emitted light from the fluorophores was detected by a high NA detection objective (UPLSAPO100XO, x100, NA 1.4, Olympus) mounted on a piezoelectric objective scanner (Nano-F100, C-Focus, Mad City Labs), spectrally filtered (Di01-R405/488/561/635 dichroic, for far red detection: Semrock, ET700/75m bandpass filter, Chroma, ZET647NF notch filter, Chroma, 3RD650LP longpass filter, Omega Optical, and for red detection: ZET647NF notch filter, Chroma, et610/60 bandpass filter, Chroma, and FF01-593/40 bandpass filter, Semrock), and focused by the microscope tube lens, before entering a 4 f imaging system. The first lens of the 4 f system ( f = 150 mm when using a deformable mirror and f = 90 mm when using transmissive phase masks) was positioned one focal length from the intermediate image plane formed by the microscope tube lens. In the plane one focal length after the first 4 f lens (i.e., the Fourier plane of the imaging path), the phase of the emitted light was modulated to reshape the PSF to encode the axial position of the emitter. After phase modulation, the light was focused by the second 4 f lens and imaged using an EM-CCD camera (iXon3 897, Andor). To create a two-channel 4 f system (Fig. 1 , lower right inset) a dichroic mirror (T660lpxrxt, Chroma) was inserted before the phase masks to transmit far red light into the first light path and reflect light with wavelengths shorter than 660 nm into a second light path. The paths were merged before the camera using a D-shaped mirror (BBD1-E02, Thorlabs). The desired phase pattern was implemented either using transmissive dielectric phase masks (for the DH mask, Double-Helix Optics, LLC, and the Tetrapod phase mask was fabricated as outlined in the Supplementary Information), or using a deformable mirror (DM) (Multi-DM 3.5, Boston Micromachines Corporation). Transmissive phase masks were used to implement the spatially non-smooth phase pattern of the DH-PSF. Since the DM consists of a continuous membrane, it is more suited to encoding smoothly varying phase patterns, such as those of the tetrapod PSFs. When the transmissive phase masks were used, the physical mask had to be exchanged whenever there was an adjustment to be made to the desired working axial range of the PSF and/or the wavelength of the emitted light. To facilitate these exchanges, the transmissive phase masks were mounted on magnetic mounts. When the DM was used, the phase pattern was controlled from a computer and could be rapidly updated with different phase patterns to produce PSFs with different axial ranges and/or at different wavelengths of light. Another common way to implement the phase pattern is to use a liquid crystal spatial light modulator (SLM). However, replacing the SLM with a transmissive phase mask or a DM substantially increases photon efficiency, which is a limiting factor for obtaining better precision for single-molecule imaging. The loss of the unmodulated polarization with a liquid crystal SLM can, however, be recovered 40 . The active regions of the transmissive masks and the DM had diameters of 2.7 and 4.2 mm, respectively. To ensure that the electric field diameter at the Fourier plane, d E , matched the diameter of the active regions, the focal lengths of the 4 f lenses, f 4 f , had to be chosen accordingly. Under the Abbe sine condition, the electric field diameter depends on the focal length according to ,1 documentclass[12pt]{minimal} usepackage{amsmath} usepackage{wasysym} usepackage{amsfonts} usepackage{amssymb} usepackage{amsbsy} usepackage{mathrsfs} usepackage{upgreek} setlength{oddsidemargin}{-69pt} begin{document}$$d_{rm{E}} = frac{{2f_{4f}rm{NA}}}{{sqrt {M^2 - rm{NA}^2} }}$$end{document} d E = 2 f 4 f NA M 2 - NA 2 where NA = 1.4 is the numerical aperture of the detection objective and M = 100 is the magnification of the microscope. Choosing focal lengths of the 4 f lenses of 90 and 150 mm for the transmissive masks and DM, respectively, resulted in electric field diameters of 2.5 and 4.2 mm, which matched or were slightly smaller than the active mask regions. Overfilling the mask would lead to unmodulated light in the image plane.
Show full methods section
Additional methods and any associated references are available in the Supplementary Information.
Optical setup
In this work, the optical setup was built around a conventional inverted microscope (IX71, Olympus) (Fig. 1 and Supplementary Fig. 1 ). Illumination lasers (405 nm, 100 mW; 561 nm, 200 mW; and 647 nm, 120 mW, all CW, from Coherent) were spectrally filtered (561 nm: ff01-554/23-25 excitation filter, 647 nm: ff01-631/36-25 excitation filter, both Semrock), circularly polarized (LPVISB050-MP2 polarizers, Thorlabs, and 405 nm: Z-10-A-.250-B-405 quarter-wave plate, Tower Optical, 561 nm: WPQ05M-561 quarter-wave plate, Thorlabs, 647 nm: WPQ05M-633 quarter-wave plate, Thorlabs), and expanded and collimated using lens telescopes. The toggling of the lasers was controlled with shutters (VS14S2T1 with VMM-D3 three-channel driver, Vincent Associates Uniblitz) and synchronized with the detection optics via MATLAB. The 405 and 561 nm lasers were introduced into the back port of the microscope through a Köhler lens to allow for wide field epi-illumination. The 647 nm laser was either introduced into the epi-illumination pathway or sent to the light sheet illumination pathway; the pathway was easily switched with a flip mirror. The light sheet illumination pathway consisted of a cylindrical lens (LJ1558L2-A, f = 300 mm, Thorlabs, or ACY254-200-A, f = 200 mm, Thorlabs), which focused the light in only one dimension onto a motorized mirror (8821 mirror mount with 8742 Picomotor controller, Newport). The motorized mirror plane was imaged onto the back aperture of a long working distance illumination objective (378-803-3, x10, NA 0.28, Mitutoyo) by two lenses in a 4 f configuration. The illumination objective then focused the light sheet, which was directed into the sample chamber (704-00-20-10, Hellma) at an angle of about 10° using a glass prism (PS908L-A, Thorlabs). The entire light sheet illumination path was mounted on a breadboard above the microscope stage, which could be moved by an xyz translation stage (460P, Newport). The emitted light from the fluorophores was detected by a high NA detection objective (UPLSAPO100XO, x100, NA 1.4, Olympus) mounted on a piezoelectric objective scanner (Nano-F100, C-Focus, Mad City Labs), spectrally filtered (Di01-R405/488/561/635 dichroic, for far red detection: Semrock, ET700/75m bandpass filter, Chroma, ZET647NF notch filter, Chroma, 3RD650LP longpass filter, Omega Optical, and for red detection: ZET647NF notch filter, Chroma, et610/60 bandpass filter, Chroma, and FF01-593/40 bandpass filter, Semrock), and focused by the microscope tube lens, before entering a 4 f imaging system. The first lens of the 4 f system ( f = 150 mm when using a deformable mirror and f = 90 mm when using transmissive phase masks) was positioned one focal length from the intermediate image plane formed by the microscope tube lens. In the plane one focal length after the first 4 f lens (i.e., the Fourier plane of the imaging path), the phase of the emitted light was modulated to reshape the PSF to encode the axial position of the emitter. After phase modulation, the light was focused by the second 4 f lens and imaged using an EM-CCD camera (iXon3 897, Andor). To create a two-channel 4 f system (Fig. 1 , lower right inset) a dichroic mirror (T660lpxrxt, Chroma) was inserted before the phase masks to transmit far red light into the first light path and reflect light with wavelengths shorter than 660 nm into a second light path. The paths were merged before the camera using a D-shaped mirror (BBD1-E02, Thorlabs). The desired phase pattern was implemented either using transmissive dielectric phase masks (for the DH mask, Double-Helix Optics, LLC, and the Tetrapod phase mask was fabricated as outlined in the Supplementary Information), or using a deformable mirror (DM) (Multi-DM 3.5, Boston Micromachines Corporation). Transmissive phase masks were used to implement the spatially non-smooth phase pattern of the DH-PSF. Since the DM consists of a continuous membrane, it is more suited to encoding smoothly varying phase patterns, such as those of the tetrapod PSFs. When the transmissive phase masks were used, the physical mask had to be exchanged whenever there was an adjustment to be made to the desired working axial range of the PSF and/or the wavelength of the emitted light. To facilitate these exchanges, the transmissive phase masks were mounted on magnetic mounts. When the DM was used, the phase pattern was controlled from a computer and could be rapidly updated with different phase patterns to produce PSFs with different axial ranges and/or at different wavelengths of light. Another common way to implement the phase pattern is to use a liquid crystal spatial light modulator (SLM). However, replacing the SLM with a transmissive phase mask or a DM substantially increases photon efficiency, which is a limiting factor for obtaining better precision for single-molecule imaging. The loss of the unmodulated polarization with a liquid crystal SLM can, however, be recovered 40 . The active regions of the transmissive masks and the DM had diameters of 2.7 and 4.2 mm, respectively. To ensure that the electric field diameter at the Fourier plane, d E , matched the diameter of the active regions, the focal lengths of the 4 f lenses, f 4 f , had to be chosen accordingly. Under the Abbe sine condition, the electric field diameter depends on the focal length according to ,1 documentclass[12pt]{minimal} usepackage{amsmath} usepackage{wasysym} usepackage{amsfonts} usepackage{amssymb} usepackage{amsbsy} usepackage{mathrsfs} usepackage{upgreek} setlength{oddsidemargin}{-69pt} begin{document}$$d_{rm{E}} = frac{{2f_{4f}rm{NA}}}{{sqrt {M^2 - rm{NA}^2} }}$$end{document} d E = 2 f 4 f NA M 2 - NA 2 where NA = 1.4 is the numerical aperture of the detection objective and M = 100 is the magnification of the microscope. Choosing focal lengths of the 4 f lenses of 90 and 150 mm for the transmissive masks and DM, respectively, resulted in electric field diameters of 2.5 and 4.2 mm, which matched or were slightly smaller than the active mask regions. Overfilling the mask would lead to unmodulated light in the image plane.
Prism and sample chamber assembly
The glass prism for reflection of the light sheet into the chamber was attached to a standard microscope stage using a custom-made right triangular aluminum prism for support. This is the only custom-made component of the entire imaging platform (other than the tetrapod phase mask). The aluminum support was cut from a square aluminum bar and designed such that when the glass prism was attached to it, the back surface of the glass prism was exposed to air (instead of aluminum) to facilitate total internal reflection at the glass–air interface (Supplementary Fig. 1b ). The aluminum prism was attached to the stage and the glass prism to the aluminum support using two-part silicone rubber (Ecoflex ® 5, Reynolds Advanced Materials). The sample chamber was assembled by attaching a glass coverslip (Fisher Premium Cover Glass, no. 1.5) with cells cultured on it to the bottom of the four transparent polished walls of a sliced commercial glass cuvette (704-000-20-10, Hellma) using two-part silicone rubber. Using a standard glass coverslip allowed for easy cell culturing and handling, and facilitated the usage of a high NA detection objective for SR imaging. During imaging, the sample chamber could be left open on the top to allow for easy sample access, or it could be easily sealed by placing a second coverslip on top of the four walls and sealing it with silicone rubber. This reduced the risk of sample contamination, decreased the rate of evaporation of the medium, and limited the access of oxygen to the sample. The glass surfaces between the coverslip and the imaging objective, and between the sample chamber and the glass prism, were brought into optical contact with immersion oil (Zeiss Immersol 518F, n = 1.518). Clearly, index matching gel could also be used between the sample chamber and the glass prism. After imaging, the bottom coverslip could be removed and the chamber walls cleaned and reused.
Cell culture and seeding
HeLa cells were cultured at 37 °C and 5% CO 2 in high-glucose Dulbecco’s modified Eagle’s medium (DMEM, HyClone) supplemented with 10% (v/v) FBS (HyClone). Two days before imaging, cultured cells were plated onto plasma-etched coverslips (Fisher Premium Cover Glass, no. 1.5) spun coat with a 1% (w/v) polyvinyl alcohol (PVA, Polysciences Inc.) layer containing red (lamin B1) (580/605 nm, F8810, Invitrogen) or far red (mitochondria) (625/645 nm, F8806, Invitrogen) fluorescent microspheres, cultured for 24 h in high-glucose DMEM supplemented with 10% FBS, and subsequently cultured for 24 h in high-glucose, phenol-red-free DMEM (HyClone) supplemented with 10% FBS. During this period, some of the microspheres were endocytosed.
Cell fixation and immunolabeling
Immunolabeling steps were performed with coverslips placed on PARAFILM, while all other steps were performed with coverslips placed in 6-well plates. After the immunolabeling, all samples were protected from light and stored in PBS (HyClone) at 4 °C. The samples were imaged within 48 h of labeling. For lamin B1 labeling, HeLa cells (CCL-2, ATCC) were washed three times in PBS, fixed in chilled 4% paraformaldehyde (PFA) (Electron Microscopy Sciences) in PBS for 20 min, washed once in PBS, and incubated with 10 mM NH 4 Cl (Sigma-Aldrich) in PBS for 10 min. Next, the cells were permeabilized with three washing steps with 0.2% (v/v) Triton X-100 (Sigma-Aldrich) in PBS with 5 min incubation between each wash, and blocked with 3% (w/v) BSA (Sigma-Aldrich) in PBS for 1 h. The cells were then labeled with primary rabbit anti-lamin B1 (ab16048, Abcam) using a 1:1000 dilution in 1% (w/v) BSA in PBS for 2 h, washed three times with 0.1% (v/v) Triton X-100 in PBS with 3 min incubation between each wash, and labeled with secondary donkey anti-rabbit conjugated with Alexa Fluor 647 (ab150067, Abcam) using a 1:1000 dilution in 1% (w/v) BSA in PBS for 1 h. The cells were finally washed five times with 0.1% (v/v) Triton X-100 in PBS with 1 min incubation between each wash. For immunolabeling of mitochondria, HeLa cells (CCL-2, ATCC) were washed two times in PBS, fixed in chilled 4% PFA in PBS for 20 min, washed once in PBS, and incubated with 10 mM NH 4 Cl in PBS for 10 min. Next, the cells were permeabilized with three washing steps with 0.2% (v/v) Triton X-100 in PBS with 5 min incubation between each wash, and blocked with 3% (w/v) BSA in 0.1% (v/v) Triton X-100 in PBS for 1 h. The cells were labeled with Alexa Fluor 647-conjugated primary rabbit anti-TOMM20 (ab209606, Abcam) using a 1:100 dilution in 1% (w/v) BSA in 0.1% (v/v) Triton X-100 in PBS for 2 h. The cells were then washed five times with 0.1% (v/v) Triton X-100 in PBS with 3 min incubation between each wash, post-fixed in 4% PFA in PBS for 5 min, and washed three times in PBS.
Single-molecule super-resolution imaging
For diffraction-limited imaging, cells were imaged in PBS using low power 647 nm excitation (~1 W cm −2 ). Comparisons between light sheet and epi-illumination were performed by manually switching illumination light paths using a flip mirror during image acquisition. Custom scripts were written in MATLAB to synchronize the laser shutters, phase patterns on the DM, image acquisition on the camera, and translation by the piezoelectric objective scanner. Scanning of the light sheet was performed using the New Focus Picomotor Application software (Newport). For single-molecule SR imaging, the PBS was replaced by a reducing and oxygen-scavenging buffer 41 comprising 100 mM Tris-HCl (Invitrogen), 10% (w/v) glucose (BD Difco), 2 µl ml −1 catalase (Sigma-Aldrich), 560 µg ml −1 glucose oxidase (Sigma-Aldrich), and cysteamine (Sigma-Aldrich) with a concentration of 10 mM (Alexa Fluor 647 immunolabeled lamin B1 (2D)), 20 mM (Alexa Fluor 647 immunolabeled mitochondria), or 40 mM (Alexa Fluor 647 immunolabeled lamin B1 (3D)). At the beginning of the measurement, a large fraction of the Alexa Fluor 647 molecules were converted into a dark state using 647 nm epi-illumination at 5 kW cm −2 . For all single-molecule measurements, an exposure time of 50 ms and a calibrated EM gain of 186 was used. For each imaging experiment, at least 300 dark frames were acquired when the shutter of the camera was closed. The mean of these dark frames was subtracted from the images before analysis. When using 3D PSFs, calibration of each PSF was carried out by axial scanning of the fiducial beads in the sample over the full PSF range using the piezoelectric objective scanner. For acquisition of 2D SR images of lamin B1 in HeLa cells, a 4 f system with a DM was used for phase modulation in the imaging pathway. A standard PSF was used together with ~25 kW cm −2 647 nm light sheet illumination for imaging of single Alexa Fluor 647 molecules, while for every twentieth frame a fiducial bead at the coverslip was imaged using a 10-µm tetrapod PSF and 10 W cm −2 561 nm epi-illumination (Fig. 2 ). This scheme makes it easy to alternate the imaging of the nuclear lamina and of the fiducial bead several microns below at the surface of the coverslip while keeping the focal plane stationary. Using a fluorecent bead that is excited by a different wavelength reduced the risk of photobleaching the fluorophores and of saturating the single-molecule image by light from the fiducial bead, while maintaining a high photon count for the fiducial. The fiducial frame was analyzed in real time and the sample drift corrected in the axial direction via feedback to the piezoelectric objective scanner. Drift correction in the image plane was performed during post processing, but could, in principle, have been performed live during imaging via feedback to a motorized stage. Reactivation of the Alexa Fluor 647 molecules back from the dark state was performed with 3 W cm −2 405 nm epi-illumination every hundredth frame after the first 10,000 frames were acquired. Single-molecule data comparing epi-illumination and light sheet illumination is shown in Supplementary Movie 1 . For 3D SR imaging of mitochondria in HeLa cells, the DM was replaced by a transmissive dielectric phase mask (Supplementary Movie 2 ). In this case, far red fiducial beads were used, allowing for continuous excitation using 647 nm and detection using the DH-PSF. Since the range of the PSF covered the entire range of the sample, no live drift correction was necessary. This scheme was very easy to implement and required no scripts to control the setup and only a single laser for illumination. Mitochondria in HeLa cells were imaged with the DH-PSF while switching from epi-illumination to light sheet illumination to allow for direct comparison between the signal, background, and localization precision in the two cases (Supplementary Movie 6 ).
Acquisition of 3D SR images of lamin
B1 in HeLa cells was performed using the scheme shown in Fig. 2 using interleaved illumination and live axial drift correction. In this case, the 4 f system was extended to two channels, where single molecules were detected using the DH-PSF in the far red channel and the fiducial beads were detected in the red channel using a 6-µm tetrapod PSF, both implemented using transmissive phase masks. Several slices were aqcuired and the focal plane was moved together with the light sheet to sample the entire nuclear lamina. The positions of the fiducial beads, which were detectable in all slices owing to the very long axial range of the tetrapod PSF, were used during post processing to correct lateral and axial drift within each slice and to stitch together the different slices. The final z -position of each slice was corrected using cross-correlation between two adjacent slices.
Code availability
The custom-written code generated during the current study is available from the corresponding author on request. Calibration and fitting of tetrapod fiducial images for drift correction was performed using a modified version of the open-source Easy-Pupil-Finder software 42 ( https://sourceforge.net/projects/easy-pupil-finder/ ). Calibration and fitting analysis of DH-PSF images was performed using a modified version of the open-source Easy-DHPSF software 43 ( https://sourceforge.net/projects/easy-dhpsf/ ).
Data availability
The single-molecule localizations generated and analyzed during the current study are available from the corresponding author on request.
Electronic supplementary material Supplementary Information Peer Review File Description of Additional Supplementary Files Supplementary Movie 1 Supplementary Movie 2 Supplementary Movie 3 Supplementary Movie 4 Supplementary Movie 5 Supplementary Movie 6 Supplementary Movie 7 Supplementary Movie 8 Supplementary Movie 9 Supplementary Movie 10
📊 Figures
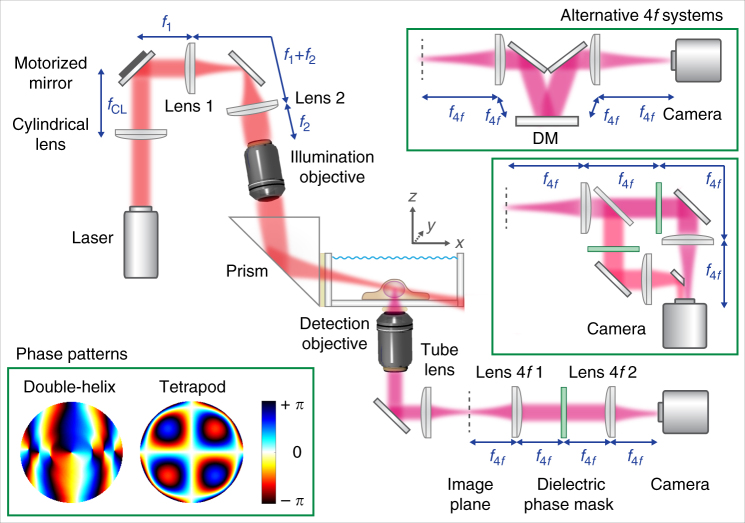
Fig. 1
Simplified schematic of the TILT3D design. The light sheet is formed by a cylindrical lens, relayed to the back aperture of a long working distance illumination objective, and reflected at an angle in...
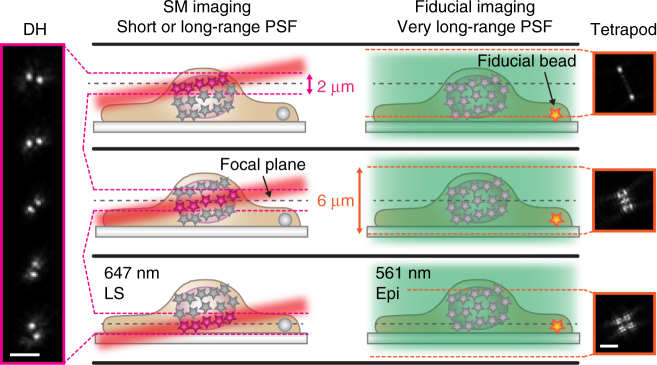
Fig. 2
Schematic of interleaved illumination and detection scheme. Singleu00a0molecules (SMs) were excited using light sheet (LS) illumination and detected using either a conventional clear aperture point sp...
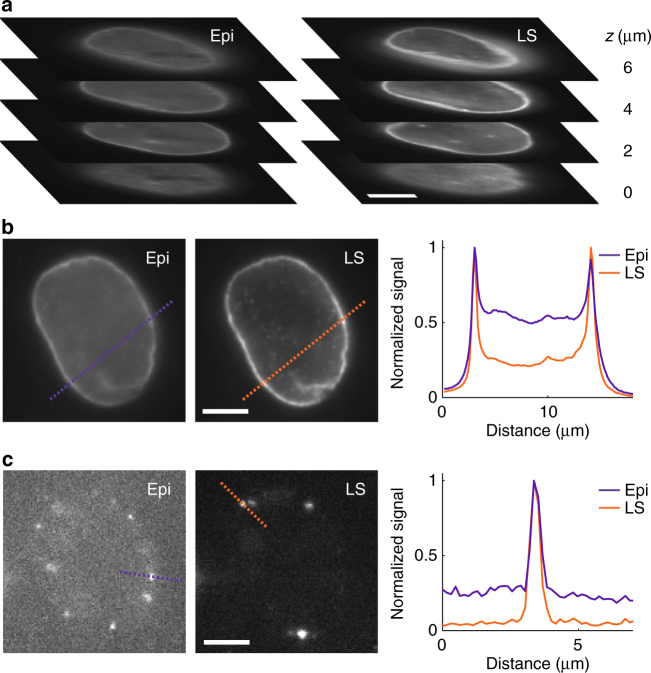
Fig. 3
Sectioning using light sheet illumination improves contrast in 2D imaging. a Comparison between epi- (Epi) and light sheet (LS) illumination at different z -positions throughout a cell nucleus. The im...
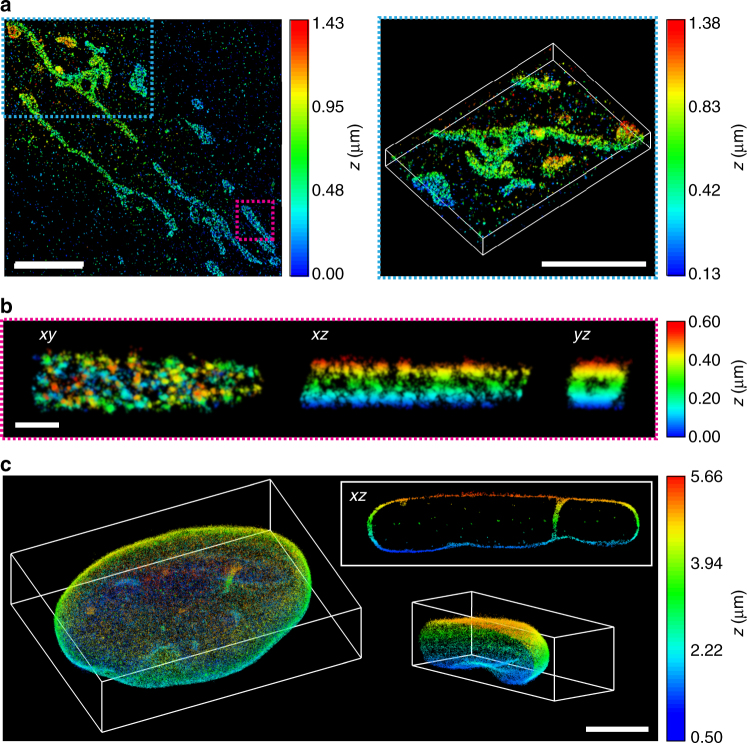
Fig. 4
Tilted light sheet imaging with long axial range point spread functions (PSFs). a 3D super-resolution (SR) reconstructions of mitochondria (TOM20) in a HeLa cell. The double-helix (DH) PSF was used fo...
Figure images are served from the NIH/NLM PubMed Central Open Access Subset or Europe PMC; copyright remains with the publishers and authors.
💬 Discussion
0 commentsNo comments yet. Be the first to start a discussion!
Leave a Comment