Abstract
The molecular composition of the organelles involved in membrane recycling is difficult to establish as a result of the absence of suitable labeling tools. We introduce in this paper a novel probe, named membrane-binding fluorophore-cysteine-lysine-palmitoyl group (mCLING), which labels the plasma membrane and is taken up during endocytosis. It remains attached to membranes after fixation and permeabilization and can therefore be used in combination with immunostaining and super-resolution microscopy. We applied mCLING to mammalian-cultured cells, yeast, bacteria, primary cultured neurons, Drosophila melanogaster larval neuromuscular junctions, and mammalian tissue. mCLING enabled us to study the molecular composition of different trafficking organelles. We used it to address several questions related to synaptic vesicle recycling in the auditory inner hair cells from the organ of Corti and to investigate molecular differences between synaptic vesicles that recycle actively or spontaneously in cultured neurons. We conclude that mCLING enables the investigation of trafficking membranes in a broad range of preparations.
🔬 Techniques
🔭 Microscopes
🧬 Organisms
💻 Software
✨ Fluorophores
🧪 Sample Preparation
🔬 Cell Lines
🏭 Microscope Brands
🧪 Reagent Suppliers
🔴 Lasers
📷 Detectors
🔎 Objectives
💻 Software Details
🏛️ Research Organizations (ROR)
Affiliated research institutions:
📋 Methods
Materials and methods mCLING validation on cultured cells
COS7 cells were cultured according to standard protocols. Cells were incubated with the different membrane and/or endocytosis markers in Ringer’s buffer for 5 min at 37°C or on ice, at the following concentrations: 0.2–0.4 µM mCLING, 5 µM FM 1-43 (Biotium), 5 µM AM 1-43 (Biotium), 5 µM FM 4-64FX (Life Technologies), 25 µg/ml Alexa Fluor 546–Transferrin (Life Technologies), 0.4 ng/ml tetramethylrhodamine-EGF (Life Technologies), or 15 µg/ml DiI-LDL (Life Technologies). Cells were imaged live (in Ringer’s buffer), fixed (4% PFA + 0.2% glutaraldehyde; Mowiol embedding), or fixed and permeabilized (0.1% Triton X-100 + 2.5% BSA; Mowiol embedding), at RT in an inverted microscope (IX71; Olympus) equipped with a 60×, 1.35 NA oil immersion objective or a 100×, 1.45 NA TIRFM (total internal reflection fluorescence microscopy) oil immersion objective (Olympus) and a 100-W mercury lamp (Olympus). Images were acquired using the software cell^P (version 3.4; Olympus) and a charge-coupled device camera (1,376 × 1,032 pixels, pixel size of 6.45 × 6.45 µm; F-View II; Olympus). For the viability assay (Fig. S1, C–E), COS7 cells were incubated in different concentrations of mCLING for 5 min, washed, and incubated in Ringer’s buffer containing propidium iodide. The cells were then imaged in an inverted epifluorescence microscope (Eclipse Ti-E; Nikon) equipped with a lamp (HBO-100W), a camera (IXON X3897; Andor Technology), and a CFI S Plan Fluor ELWD (Extra Long Working Distance; air) 40×, 0.60 NA objective (Nikon) and operated with the software NIS-Elements AR (version 4.20; Nikon). For confocal imaging of COS7 cells ( Figs. 1 D and 2, B and C ), the same microscope as for STED microscopy was used (as described in the STED microscopy section of the Materials and methods). mCLING validation on yeast and bacteria S. cerevisiae cells from the strain BY4742 were immobilized on poly- l -lysine (PLL)–coated coverslips and labeled with either 20 µM FM 4-64 or 0.4 µM mCLING in YNB (yeast nitrogen base) medium for 20 min. Cells were imaged live (in YNB medium with the dye), fixed, or fixed and immunostained (same protocol as for COS7 cells; Mowiol embedded). Imaging was performed in the same Olympus microscope described in the previous section, using the 100×, 1.45 NA TIRFM oil immersion objective combined with an optovar lens of 1.6× magnification (Olympus). For membrane staining of E. coli cells, these were immobilized on PLL-coated coverslips and labeled with either 5 µM FM 1-43 or 0.4 µM mCLING, in LB medium, for 5 min. After washing and direct mounting in Mowiol, cells were imaged in confocal or super-resolution mode using the STED microscope described in the STED microscopy section of the Materials and methods. Animals Mice ( Mus musculus ) from the wild-type substrains C57BL/6N and C57BL/6J were obtained from the animal facility of the University Medical Center Göttingen or from Charles River. Other mouse strains used included CD1/C57BL/6J expressing VGLUT1-pHluorin (offspring of CD1 mice mated with C57BL/6J mice) and Otoferlin knockout mice ( Otof −/− mice; see next section of Materials and methods). Male or female mice, at ages between postnatal days 14 and 18, were used for organ of Corti dissection. Mice were handled according to the specifications of the University of Göttingen and of the state of Lower Saxony (Landesamt für Verbraucherschutz, Braunschweig, Germany).
Show full methods section
Materials and methods mCLING validation on cultured cells
COS7 cells were cultured according to standard protocols. Cells were incubated with the different membrane and/or endocytosis markers in Ringer’s buffer for 5 min at 37°C or on ice, at the following concentrations: 0.2–0.4 µM mCLING, 5 µM FM 1-43 (Biotium), 5 µM AM 1-43 (Biotium), 5 µM FM 4-64FX (Life Technologies), 25 µg/ml Alexa Fluor 546–Transferrin (Life Technologies), 0.4 ng/ml tetramethylrhodamine-EGF (Life Technologies), or 15 µg/ml DiI-LDL (Life Technologies). Cells were imaged live (in Ringer’s buffer), fixed (4% PFA + 0.2% glutaraldehyde; Mowiol embedding), or fixed and permeabilized (0.1% Triton X-100 + 2.5% BSA; Mowiol embedding), at RT in an inverted microscope (IX71; Olympus) equipped with a 60×, 1.35 NA oil immersion objective or a 100×, 1.45 NA TIRFM (total internal reflection fluorescence microscopy) oil immersion objective (Olympus) and a 100-W mercury lamp (Olympus). Images were acquired using the software cell^P (version 3.4; Olympus) and a charge-coupled device camera (1,376 × 1,032 pixels, pixel size of 6.45 × 6.45 µm; F-View II; Olympus). For the viability assay (Fig. S1, C–E), COS7 cells were incubated in different concentrations of mCLING for 5 min, washed, and incubated in Ringer’s buffer containing propidium iodide. The cells were then imaged in an inverted epifluorescence microscope (Eclipse Ti-E; Nikon) equipped with a lamp (HBO-100W), a camera (IXON X3897; Andor Technology), and a CFI S Plan Fluor ELWD (Extra Long Working Distance; air) 40×, 0.60 NA objective (Nikon) and operated with the software NIS-Elements AR (version 4.20; Nikon). For confocal imaging of COS7 cells ( Figs. 1 D and 2, B and C ), the same microscope as for STED microscopy was used (as described in the STED microscopy section of the Materials and methods). mCLING validation on yeast and bacteria S. cerevisiae cells from the strain BY4742 were immobilized on poly- l -lysine (PLL)–coated coverslips and labeled with either 20 µM FM 4-64 or 0.4 µM mCLING in YNB (yeast nitrogen base) medium for 20 min. Cells were imaged live (in YNB medium with the dye), fixed, or fixed and immunostained (same protocol as for COS7 cells; Mowiol embedded). Imaging was performed in the same Olympus microscope described in the previous section, using the 100×, 1.45 NA TIRFM oil immersion objective combined with an optovar lens of 1.6× magnification (Olympus). For membrane staining of E. coli cells, these were immobilized on PLL-coated coverslips and labeled with either 5 µM FM 1-43 or 0.4 µM mCLING, in LB medium, for 5 min. After washing and direct mounting in Mowiol, cells were imaged in confocal or super-resolution mode using the STED microscope described in the STED microscopy section of the Materials and methods. Animals Mice ( Mus musculus ) from the wild-type substrains C57BL/6N and C57BL/6J were obtained from the animal facility of the University Medical Center Göttingen or from Charles River. Other mouse strains used included CD1/C57BL/6J expressing VGLUT1-pHluorin (offspring of CD1 mice mated with C57BL/6J mice) and Otoferlin knockout mice ( Otof −/− mice; see next section of Materials and methods). Male or female mice, at ages between postnatal days 14 and 18, were used for organ of Corti dissection. Mice were handled according to the specifications of the University of Göttingen and of the state of Lower Saxony (Landesamt für Verbraucherschutz, Braunschweig, Germany).
Mouse mutagenesis
To generate Otof −/− mice (described in Reisinger et al., 2011 ), a targeting vector was generated to replace exons 14 and 15 of the otoferlin wild-type gene by homologous recombination. A sequence containing 2.7- and 5.3-kb-long linkers upstream and downstream of a floxP-flanked neomycin selection cassette was subcloned into the NdeI and NsiI restriction sites of the respective gene intron regions (backbone vector pL253). 129ola embryonic stem cell colonies were electroporated with the targeting vector and selected with G418 and ganciclovir. After evaluating successful recombination by Southern blot analysis, positive clones were injected into mouse blastocysts for generation of chimeric mice. The heterozygous offspring of those mice were bred with cre recombinase–expressing mice to excise the neomycin cassette. Deletion of the neomycin cassette was confirmed by PCR. Absence of otoferlin from IHCs was confirmed by immunostaining using two different antibodies (mouse monoclonal, ab53233 [Abcam]; rabbit polyclonal, 178 003 [Synaptic Systems]). mCLING labeling and immunostaining in IHCs The apical turn of the organ of Corti was dissected and directly placed in an imaging chamber filled with HBSS without calcium (HBSS without Ca 2+ ) containing (mM): 5.36 KCl, 141.7 NaCl, 1 MgCl 2 , 0.5 MgSO 4 , 10 Hepes, 3.4 l -glutamine, and 6.9 d -glucose, pH 7.4. For labeling, the organ of Corti was incubated with 1.7 µM mCLING. Incubation times were always of 3 min, to ensure adequate probe penetration into the tissue. For stimulation, organs were first incubated for 2 min in HBSS without Ca 2+ + mCLING and then for 1 min in HBSS high K + + mCLING (KCl increased to 65.36 mM, NaCl reduced to 79.7 mM, and 2 mM CaCl 2 ). For recovery after stimulation, the probe was washed off, and the sample was incubated for 5 min in a constant flow of dye-free HBSS with Ca 2+ (NaCl reduced to 139.7 mM plus 2 mM CaCl 2 , with 5.36 mM KCl). All solutions were carbogen charged and prewarmed at 37°C before the experiments. After labeling, samples were rapidly washed with HBSS without Ca 2+ , fixed in 4% PFA + 0.2% glutaraldehyde for 30 min on ice followed by 30 min at RT, and quenched in 100 mM NH 4 Cl + 100 mM glycine for 30 min. Afterward, organs were permeabilized in 0.5% Triton X-100 + 1.5% BSA in PBS (3 × 10 min) and incubated for 1 h with one of the following primary antibodies (diluted in PBS + 0.5% Triton X-100 + 1.5% BSA): calnexin (rabbit polyclonal, ab22595; Abcam), GM130 (mouse monoclonal, 610822; BD), LAMP1 (rabbit polyclonal, ab24170; Abcam), otoferlin (mouse monoclonal, ab53233; Abcam), Rab3 (mouse monoclonal, 610379; BD), syntaxin 6 (mouse monoclonal, 610636; BD), syntaxin 16 (rabbit polyclonal; provided by R. Jahn, Max Planck Institute for Biophysical Chemistry, Göttingen, Germany; same as 110 162 obtained from Synaptic Systems), VGLUT3 (rabbit polyclonal, 135203; Synaptic Systems), and Vti1a (mouse monoclonal, 611220; BD). After primary antibody incubation, washes with 0.5% Triton X-100 + 1.5% BSA in PBS (3 × 10 min) were performed. Secondary antibodies were Chromeo494-coupled goat anti–rabbit IgG (15042; Active Motif) and Chromeo494-coupled goat anti–mouse IgG (15032; Active Motif). For identifying the synaptic ribbon, the following antibodies were used: primary antibodies against CtBP2 (also recognizing Ribeye A domain; mouse monoclonal, 612044; BD) or Ribeye B domain (rabbit polyclonal, 192003; Synaptic Systems) and, as secondary antibodies, Cy2-coupled goat anti–mouse IgG or goat anti–rabbit IgG (115-225-146 and 111-225-144; Dianova). Finally, organs were washed with high salt PBS (containing 500 mM NaCl; 3 × 10 min) and standard PBS (2 × 10 min).
Cell surface quenching of mCLING in IHCs
After mCLING labeling for 2 min in HBSS without Ca 2+ and 1 min under stimulation conditions (65 mM KCl), the organ of Corti was placed in an imaging chamber containing mCLING-free HBSS with Ca 2+ and 0.75 mM BPB for 5 min. BPB quenched the mCLING on the cell surface, enabling the live imaging of endocytotic organelles. IHCs were stimulated for a second time by replacing the solution with HBSS with high K + and 0.75 mM BPB (65 mM KCl for 1 min). In the control group, the second stimulation was performed in the absence of Ca 2+ and in the presence of 0.75 mM BPB and 5 mM EGTA. Live imaging was performed at RT using an upright confocal microscope (SP2; Leica) equipped with a HCX Apochromat L UV-visible-infrared 63×, 0.9 NA water immersion objective (Leica) and operated with the Leica Confocal Software (version 2.61; Leica). VGLUT1-pHluorin experiments in IHCs Complementary DNA of pHluorin-coupled VGLUT1 (a gift from R. Edwards, University of California, San Francisco, San Francisco, CA) was subcloned into an AAV-HBA-EWB vector using an EcoRI and a HindIII restriction site introduced through PCR. The virus was produced by S. Kügler (University Medical Center Göttingen, Göttingen, Germany) as described previously ( Kügler et al., 2007 ), using capsid proteins of serotype 1 and 2 (AAV1/2). IHCs were transduced by trans-uterine injection of otocysts in postcoital day 11.5 pregnant CD1 dams mated with C57BL/6J males ( Bedrosian et al., 2006 ). The live imaging of transduced IHCs was performed with a confocal microscope (FluoView 300) equipped with a 60×, 0.9 NA water-immersion objective, all obtained from Olympus ( Frank et al., 2009 ). pHluorin and TAMRA (carboxytetramethylrhodamine)-conjugated Ribeye-binding peptide ( Zenisek et al., 2004 ) were excited with a 50-mW, 488-nm laser (Cyan; Newport Spectraphysics) and with a 1.5-mW, 543-nm He-Ne laser, respectively. Patch–clamp experiments were performed with an EPC 9 amplifier and Patchmaster software (HEKA) using intracellular solution containing (mM) 131.5 Cs-glutamate, 13 tetraethylammonium-Cl, 20 CsOH-Hepes, 1 MgCl 2 , 2 MgATP, 0.3 NaGTP, 0.5 EGTA, and 0.04 Ribeye-binding peptide, pH 7.2, and extracellular solution containing 104 NaCl, 35 tetraethylammonium-Cl, 2.8 KCl, 5 CaCl 2 , 1 MgCl 2 , 10 NaOH-Hepes, and 10 d -glucose, pH 7.3.
Neuronal culture methods
Neuronal hippocampal cultures were obtained from dissociated hippocampi of newborn rats (modified from Banker and Cowan, 1977 ; Beaudoin et al., 2012 ). In brief, brains were extracted from the skulls of postnatal 2-d-old rat pups, and the hippocampi were isolated under a dissection microscope. Following washes with HBSS (Invitrogen) to remove tissue debris, the hippocampi were incubated for 1 h in enzyme solution (10 ml DMEM, 2 mg cysteine, 100 mM CaCl 2 , 50 mM EDTA, and 25 U sterile papain bubbled with carbogen for 10 min and sterile filtered). Before mechanical dissociation, cells were washed thoroughly with HBSS and incubated for 15 min in inactivating solution (2 mg albumin and 2 mg trypsin inhibitor in 10 ml FCS containing DMEM medium). Before seeding, coverslips were treated with nitric acid, washed thoroughly with sterile water, and 1 mg/ml PLL coated overnight. Dissociated neurons were seeded in plating medium (MEM supplemented with 10% horse serum, 3.3 mM glucose, and 2 mM glutamine) and incubated for 1–4 h at 37°C in a 5% CO 2 humidified atmosphere to allow adhesion to the substrate. After adhesion, the medium was changed to Neurobasal-A medium containing 500 ml Neurobasal-A (Gibco), 10 ml B27 supplement (Gibco), and 5 ml GlutaMAX I stock. To avoid glial proliferation 5-fluoro-2’-deoxyuridine was added to the culture after 2 d in vitro. The neurons were kept in culture at 37°C and 5% CO 2 for 14 d before use. mCLING labeling (0.68 µM) and immunostaining were performed as for the IHCs, using the incubation and stimulation conditions indicated in the main text for the different experiments (see Results sections titled mCLING applications to cultured neurons). Tyrode buffer was used, containing 124 mM NaCl, 5 mM KCl, 2 mM CaCl 2 , 30 mM glucose, and 25 mM Hepes, pH adjusted to 7.3. Permeabilization was performed with 0.1% Triton X-100 and 2.5% BSA. The following antibodies were used: VGLUT1/2 (rabbit polyclonal, 135 503; Synaptic Systems), synaptophysin (rabbit polyclonal raised against synaptophysin purified from rat synaptic vesicles; see Jahn et al., 1985 ; provided by R. Jahn), synaptotagmin 1 (rabbit polyclonal, 105 102; Synaptic Systems), VAMP2 (mouse monoclonal, 104211; Synaptic Systems), synapsin (rabbit polyclonal, 106 002; Synaptic Systems), syntaxin 13 (mouse monoclonal, 110 131; Synaptic Systems), Vti1a (mouse monoclonal, 611220; BD), VAMP4 (rabbit polyclonal, 136002; Synaptic Systems), Rab3a (rabbit polyclonal, 107 003; Synaptic Systems), syntaxin 1 (mouse monoclonal, 110 011; Synaptic Systems), and SNAP-25 (rabbit polyclonal, 111 002; Synaptic Systems). Chromeo494-coupled goat secondary antibodies were used accordingly. To study the effects of mCLING on synaptic vesicle recycling, neurons were transfected with the synaptopHluorin plasmid using calcium phosphate (ProFection; Promega). The synaptopHluorin insert (a gift from L. Lagnado, University of Sussex, Brighton, England, UK) was subcloned into a pEGFP-N1 plasmid (cytomegalovirus promoter; Takara Bio Inc.) by PCR through insertion of a KpnI restriction site in the forward primer (5′-AATGGTACCGCCGGTCGCCACC-3′) and a NotI restriction site in the reverse primer (5′-AATGCGGCCGCTTTAACCGGTTTTGTATAG-3′). Recombinant clones were confirmed by sequencing. After 8 d in vitro, transfected neurons were treated with 0.2 µM mCLING for 5 min. Cells were then stimulated using an A385 stimulus isolator and an A310 Accupulser stimulator (World Precision Instruments). 100-mA shocks were delivered initially in a short stimulus (3 s at 20 Hz) and 40 s later in a long stimulus (30 s at 20 Hz). Spontaneous network activity was blocked after mCLING incubation using 10 µM 6-cyano-7-nitroquinoxaline-2,3-dione and 1 µM AP5. Imaging was performed in the same Nikon setup described in the first Materials and methods section using a Plan Apochromat 60×, 1.4 NA oil immersion objective.
Drosophila methods
Third instar larvae were dissected, internal organs were removed, and the larvae were pinned as previously described ( Jan and Jan, 1976 ). The larvae were preincubated during 2 min with 1.7 µM mCLING and then electrically stimulated in Drosophila saline ( Jan and Jan, 1976 ) at 20 Hz for 8 s before fixation (same as organs of Corti). Active zones were identified by immunostaining against Bruchpilot (mouse monoclonal, nc82; Developmental Studies Hybridoma Bank at The University of Iowa, Iowa City, IA).
Embedding in polymer resin for fluorescence imaging
The resin hardener was prepared by dissolving 48 mg p -toluenesulfonic acid monohydrate (Sigma-Aldrich) in 0.576-ml distilled water. 1.344 g 2,4,6-Tris[bis(methoxymethyl)amino]-1,3,5-triazine (melamine) was added, and the tube was agitated on a horizontal shaker at 250 rpm for 2 h or until the melamine was completely dissolved. After mCLING labeling and immunostaining (see mCLING labeling and immunostaining in IHCs), the organ of Corti was placed (tectorial membrane facing down) on an 18-mm glass coverslip. A BEEM capsule (BEEM, Inc.), whose bottom had previously been cut, was placed with the opening down, surrounding the organ of Corti. 200 µl of freshly prepared melamine was poured inside the BEEM capsule, covering the organ of Corti completely. The mounted sample was placed in a box containing silica beads for removing the water and left overnight at RT to allow penetration of melamine into the tissue. The box was then heated to 40°C for 24 h. The BEEM capsule was filled to the top with Epon resin (EpoFix kit; Struers) and then heated up at 60°C for 48 h. The melamine around the organ of Corti was trimmed away with a scalpel blade, and samples were again incubated at 60°C for 48 h for complete hardening. Melamine blocks were cut into thin sections with an ultramicrotome (EM UC6; Leica). Sections were dried on a coverslip and embedded in Mowiol for two-color STED or epifluorescence imaging at RT. STED microscopy A STED microscope (TCS SP5; Leica) equipped with a HCX Plan Aprochromat 100×, 1.4 NA oil STED objective and operated with the LAS AF imaging software (version 2.7.3.9723; Leica) was used for performing two-color STED microscopy. Chromeo494 and Atto647N were excited with pulsed diode lasers (PDL 800-D; PicoQuant) at 531 and 640 nm, respectively. The STED beam was generated by a Ti:Sapphire laser (Mai Tai; Spectra-Physics) tuned at 750 nm. The same microscope was used for acquiring confocal images of COS7 cells using an HCX Plan Apochromat 63×, 1.4 NA oil immersion objective. Thin-section imaging mCLING-labeled organs of Corti were fixed and immunostained for VGLUT3 and otoferlin, VGLUT3 and syntaxin 6, otoferlin and syntaxin 16, or syntaxin 6 and syntaxin 16 as described previously in this paper. The same primary antibodies used for the double labeling (see the section mCLING labeling and immunostaining in IHCs from the Materials and methods) were recognized by Cy3- and Cy2-coupled goat anti–mouse IgG or goat anti–rabbit IgG (115-225-146 and 111-225-144) accordingly. After melamine embedding, 20-nm-thick sections were cut and imaged at RT using the same epifluorescence inverted microscope (IX71) described in the first Materials and methods section. Images were acquired with a 100×, 1.45 NA TIRFM oil immersion objective (Olympus).
Data analysis
For presentation purposes, the STED images were deconvolved with the software Huygens Essential 4.4 (Scientific Volume Imaging), based on a CMLE (Classical Maximum Likelihood Estimation) algorithm. The in-built deconvolution functions of the software were adapted to the imaging parameters of the aforementioned STED microscope. Images were processed and arranged for display using Photoshop and Illustrator software (Adobe). For calculating endocytosis levels ( Fig. 4 D ), we analyzed nondeconvolved STED images from transversal cuts of mCLING-labeled IHCs. Images were processed with a self-written MATLAB (The MathWorks, Inc.) routine to determine the percentage of the cellular region occupied by mCLING-labeled organelles. mCLING-labeled organelles were defined as groups of pixels with fluorescence intensities above the mean mCLING background value. A similar routine was used in Fig. 4 G , determining the mCLING intensity levels, rather than the area occupied. Similar routines were used in Fig. 9 . The macros are found in zip file 1 . To establish the presence of various proteins on mCLING-labeled organelles ( Figs. 6 and 7 ), we analyzed two-color STED or epifluorescence images taken from transversal cuts of mCLING-labeled and immunostained IHCs. A self-written MATLAB routine was used to calculate Pearson’s correlation coefficients between line scans (20 pixels long and 2 pixels wide, using 20.2-nm pixels) drawn on organelles in both channels. The macros are found in zip file 2 . To obtain averaged STED pictures of IHC active zones ( Fig. 5 ), we selected for each condition ≥20 regions of interest (ROIs; 5 × 5 µm 2 ) centered on synaptic ribbons. Using a self-written MATLAB routine, we rotated the ROIs until we obtained the maximum overlap, measured both in the mCLING and immunostaining channels. A final grayscale image of the average fluorescence intensities was then generated from the stack of individual images. The average images are displayed using the Jet lookup table inbuilt in ImageJ (National Institutes of Health). Similar routines were used to identify and average the neuronal organelles ( Fig. 8 ) or SNARE clusters ( Fig. 10 ). The macros are found in zip file 3 .
Statistical analysis
All graphs show means ± SEM, unless otherwise indicated in the figure legends. The t test (unpaired) was used (p-values indicated in the figure legends). No blinding was used for data analysis, as each dataset could be easily recognized by the experimenters. Online supplemental material Fig. S1 shows the poor fixability of Atto647N-coupled PLL chains and that mCLING is not toxic, does not interfere with membrane trafficking processes in cultured cells, and does not affect synaptic vesicle recycling in hippocampal neurons. Fig. S2 shows the suitability of mCLING for imaging membranes of E. coli cells under STED microscopy. Fig. S3 shows that endocytosis in IHCs is clathrin and dynamin dependent and that synaptic vesicle exocytosis preferentially occurs at the active zones of IHCs, as indicated by pHluorin imaging. Fig. S4 shows that endocytosis at the cuticular level of IHCs is related to constitutive trafficking to late endosomes/lysosomes. Fig. S5 shows mCLING uptake at the Drosophila larval neuromuscular junction. Three ZIP files are provided containing self-written MATLAB routines: The routine zip file 1 was used to calculate the percentage of cellular area occupied by mCLING-labeled organelles. The routine zip file 2 was used to calculate Pearson’s correlation values between the mCLING and the immunostaining channels across mCLING-labeled organelles. The routine zip file 3 was used to generate average pictures of aligned ribbon-type active zones and to generate average images of mCLING-labeled and immunostained synaptic vesicles. Online supplemental material is available at http://www.jcb.org/cgi/content/full/jcb.201402066/DC1 .
Neuronal culture methods
Neuronal hippocampal cultures were obtained from dissociated hippocampi of newborn rats (modified from Banker and Cowan, 1977 ; Beaudoin et al., 2012 ). In brief, brains were extracted from the skulls of postnatal 2-d-old rat pups, and the hippocampi were isolated under a dissection microscope. Following washes with HBSS (Invitrogen) to remove tissue debris, the hippocampi were incubated for 1 h in enzyme solution (10 ml DMEM, 2 mg cysteine, 100 mM CaCl 2 , 50 mM EDTA, and 25 U sterile papain bubbled with carbogen for 10 min and sterile filtered). Before mechanical dissociation, cells were washed thoroughly with HBSS and incubated for 15 min in inactivating solution (2 mg albumin and 2 mg trypsin inhibitor in 10 ml FCS containing DMEM medium). Before seeding, coverslips were treated with nitric acid, washed thoroughly with sterile water, and 1 mg/ml PLL coated overnight. Dissociated neurons were seeded in plating medium (MEM supplemented with 10% horse serum, 3.3 mM glucose, and 2 mM glutamine) and incubated for 1–4 h at 37°C in a 5% CO 2 humidified atmosphere to allow adhesion to the substrate. After adhesion, the medium was changed to Neurobasal-A medium containing 500 ml Neurobasal-A (Gibco), 10 ml B27 supplement (Gibco), and 5 ml GlutaMAX I stock. To avoid glial proliferation 5-fluoro-2’-deoxyuridine was added to the culture after 2 d in vitro. The neurons were kept in culture at 37°C and 5% CO 2 for 14 d before use. mCLING labeling (0.68 µM) and immunostaining were performed as for the IHCs, using the incubation and stimulation conditions indicated in the main text for the different experiments (see Results sections titled mCLING applications to cultured neurons). Tyrode buffer was used, containing 124 mM NaCl, 5 mM KCl, 2 mM CaCl 2 , 30 mM glucose, and 25 mM Hepes, pH adjusted to 7.3. Permeabilization was performed with 0.1% Triton X-100 and 2.5% BSA. The following antibodies were used: VGLUT1/2 (rabbit polyclonal, 135 503; Synaptic Systems), synaptophysin (rabbit polyclonal raised against synaptophysin purified from rat synaptic vesicles; see Jahn et al., 1985 ; provided by R. Jahn), synaptotagmin 1 (rabbit polyclonal, 105 102; Synaptic Systems), VAMP2 (mouse monoclonal, 104211; Synaptic Systems), synapsin (rabbit polyclonal, 106 002; Synaptic Systems), syntaxin 13 (mouse monoclonal, 110 131; Synaptic Systems), Vti1a (mouse monoclonal, 611220; BD), VAMP4 (rabbit polyclonal, 136002; Synaptic Systems), Rab3a (rabbit polyclonal, 107 003; Synaptic Systems), syntaxin 1 (mouse monoclonal, 110 011; Synaptic Systems), and SNAP-25 (rabbit polyclonal, 111 002; Synaptic Systems). Chromeo494-coupled goat secondary antibodies were used accordingly. To study the effects of mCLING on synaptic vesicle recycling, neurons were transfected with the synaptopHluorin plasmid using calcium phosphate (ProFection; Promega). The synaptopHluorin insert (a gift from L. Lagnado, University of Sussex, Brighton, England, UK) was subcloned into a pEGFP-N1 plasmid (cytomegalovirus promoter; Takara Bio Inc.) by PCR through insertion of a KpnI restriction site in the forward primer (5′-AATGGTACCGCCGGTCGCCACC-3′) and a NotI restriction site in the reverse primer (5′-AATGCGGCCGCTTTAACCGGTTTTGTATAG-3′). Recombinant clones were confirmed by sequencing. After 8 d in vitro, transfected neurons were treated with 0.2 µM mCLING for 5 min. Cells were then stimulated using an A385 stimulus isolator and an A310 Accupulser stimulator (World Precision Instruments). 100-mA shocks were delivered initially in a short stimulus (3 s at 20 Hz) and 40 s later in a long stimulus (30 s at 20 Hz). Spontaneous network activity was blocked after mCLING incubation using 10 µM 6-cyano-7-nitroquinoxaline-2,3-dione and 1 µM AP5. Imaging was performed in the same Nikon setup described in the first Materials and methods section using a Plan Apochromat 60×, 1.4 NA oil immersion objective.
Online supplemental material Fig. S1 shows the poor fixability of Atto647N-coupled PLL chains and that mCLING is not toxic, does not interfere with membrane trafficking processes in cultured cells, and does not affect synaptic vesicle recycling in hippocampal neurons. Fig. S2 shows the suitability of mCLING for imaging membranes of E. coli cells under STED microscopy. Fig. S3 shows that endocytosis in IHCs is clathrin and dynamin dependent and that synaptic vesicle exocytosis preferentially occurs at the active zones of IHCs, as indicated by pHluorin imaging. Fig. S4 shows that endocytosis at the cuticular level of IHCs is related to constitutive trafficking to late endosomes/lysosomes. Fig. S5 shows mCLING uptake at the Drosophila larval neuromuscular junction. Three ZIP files are provided containing self-written MATLAB routines: The routine zip file 1 was used to calculate the percentage of cellular area occupied by mCLING-labeled organelles. The routine zip file 2 was used to calculate Pearson’s correlation values between the mCLING and the immunostaining channels across mCLING-labeled organelles. The routine zip file 3 was used to generate average pictures of aligned ribbon-type active zones and to generate average images of mCLING-labeled and immunostained synaptic vesicles. Online supplemental material is available at http://www.jcb.org/cgi/content/full/jcb.201402066/DC1 .
📊 Figures
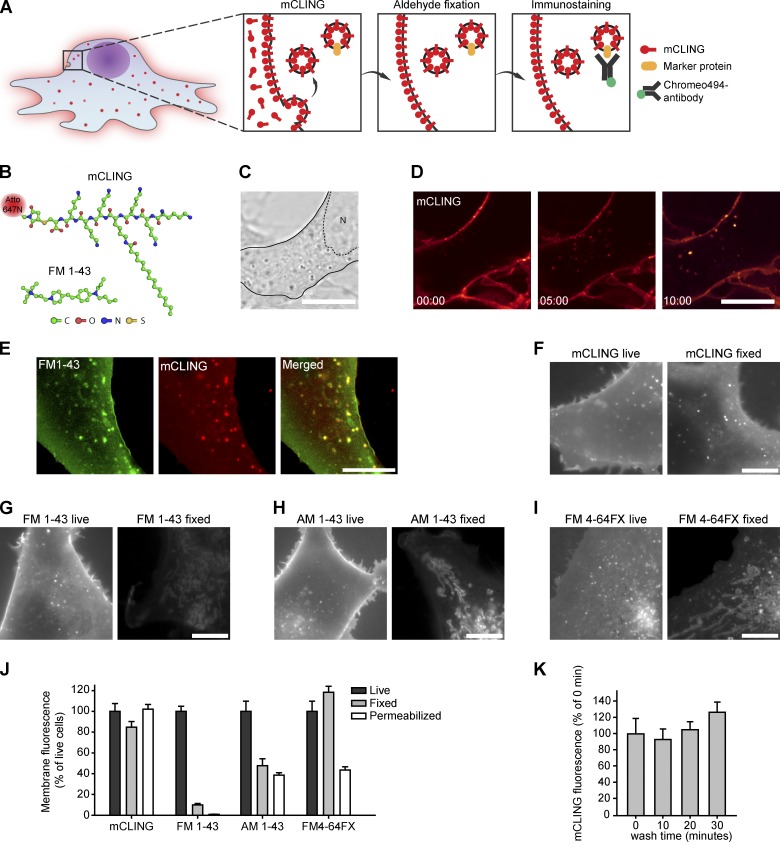
Figure 1.
mCLING: A novel membrane probe. (A) Outline of an experiment designed to reveal the molecular composition of endocytotic organelles. The membrane probe mCLING labels the endocytotic organelles and is ...
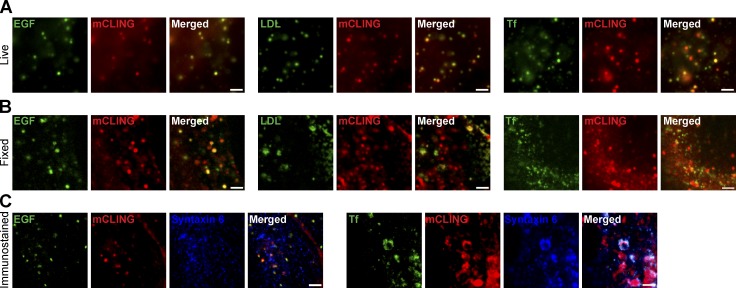
Figure 2.
mCLING labels endocytotic organelles involved in ligand trafficking. (A) COS7 cells were incubated for 5 min with mCLING and with fluorescently coupled transferrin (Tf), LDL, or EGF at 37u00b0C. The l...
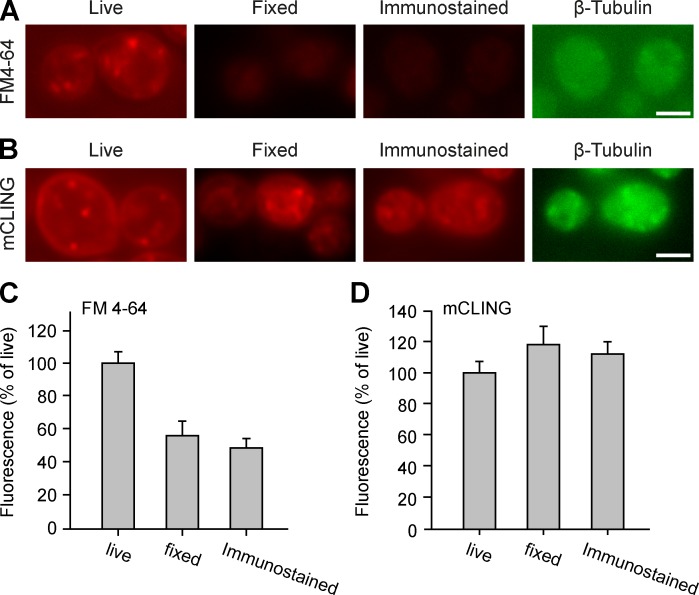
Figure 3.
mCLING imaging in yeast. (A) Yeast cells from the strain BY4742 were incubated with FM 4-64 for 20 min, at RT, and were analyzed by epifluorescence imaging under different conditions: live (left), aft...
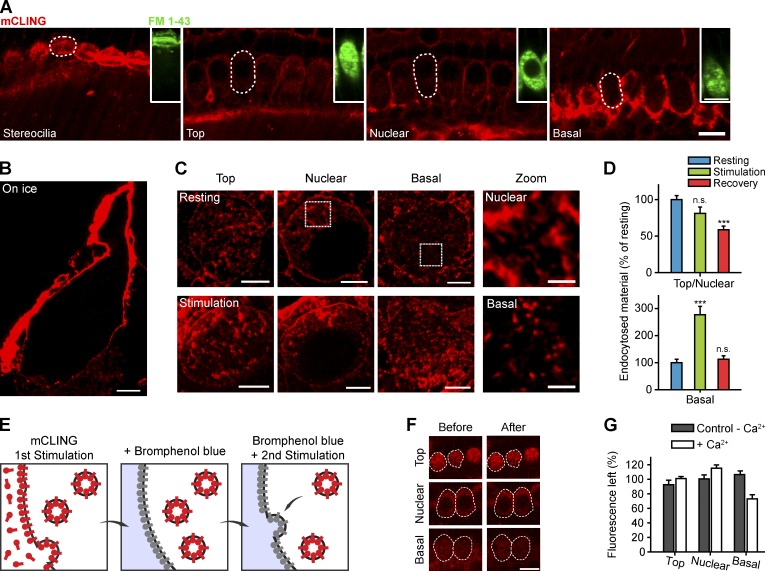
Figure 4.
mCLING imaging in IHCs. (A) mCLING does not permeate mechanotransducer channels in living IHCs. Confocal images of the stereocilia bundle and of the top, nuclear, and basal levels of a row of living I...
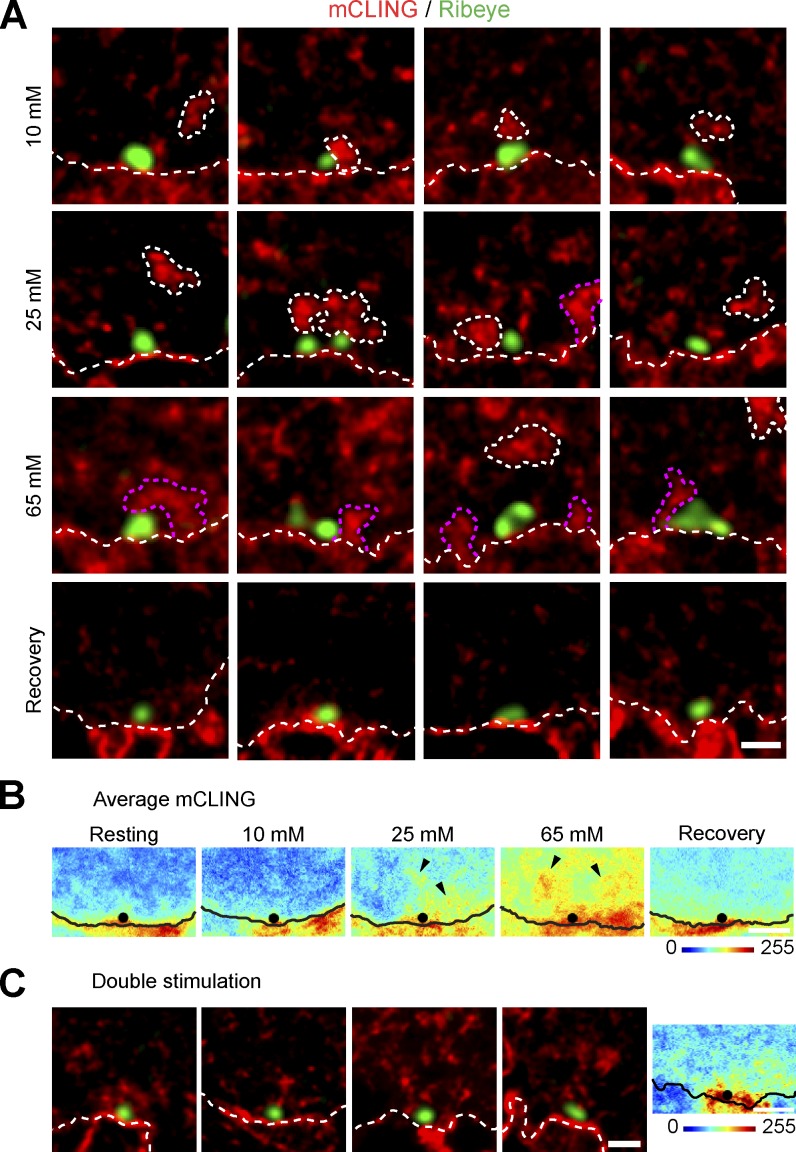
Figure 5.
mCLING reveals organelles endocytosed at the IHC base. (A) Endocytosis near active zones, at the base of the cell, during stimulation. mCLING-labeled organelles were imaged in the vicinity of synaptic...
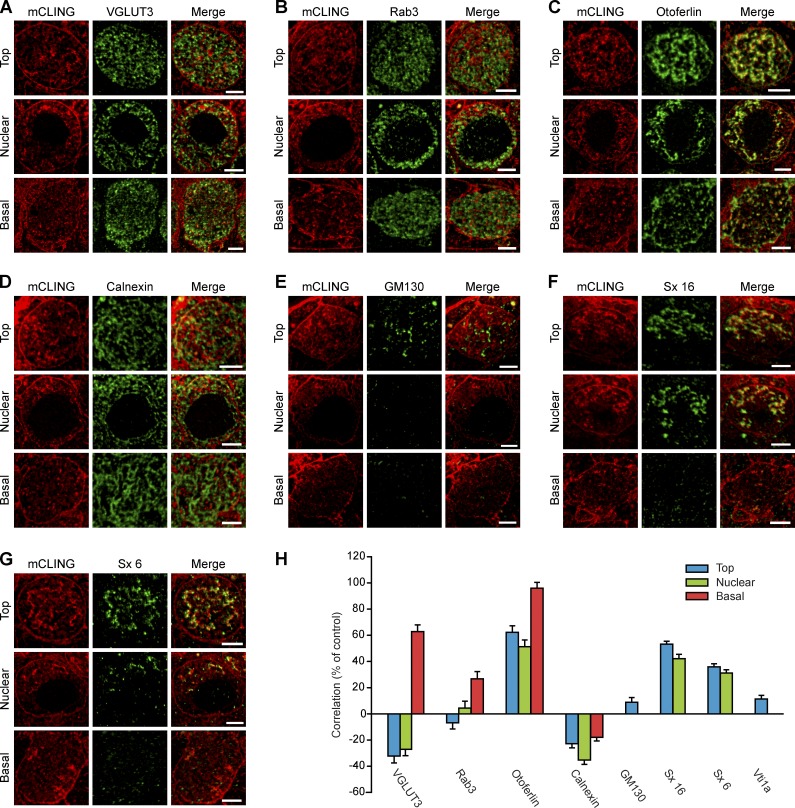
Figure 6.
Immunostaining analysis of the organelles involved in membrane recycling in IHCs. We labeled organs of Corti with mCLING and then immunostained them for different organelle markers. (Au2013G) The foll...
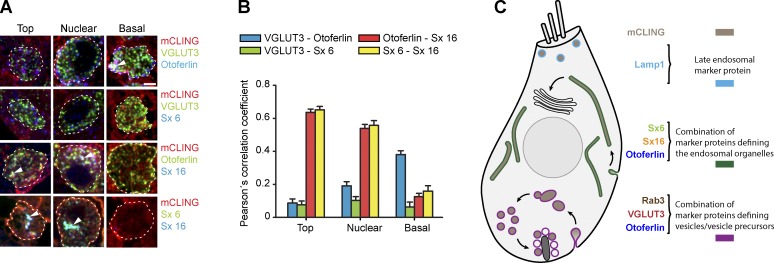
Figure 7.
Multicolor immunostaining analysis of the IHC organelles. (A) mCLING-labeled organs of Corti were immunostained for VGLUT3 and otoferlin (first row), for VGLUT3 and syntaxin 6 (Sx 6; second row), for ...
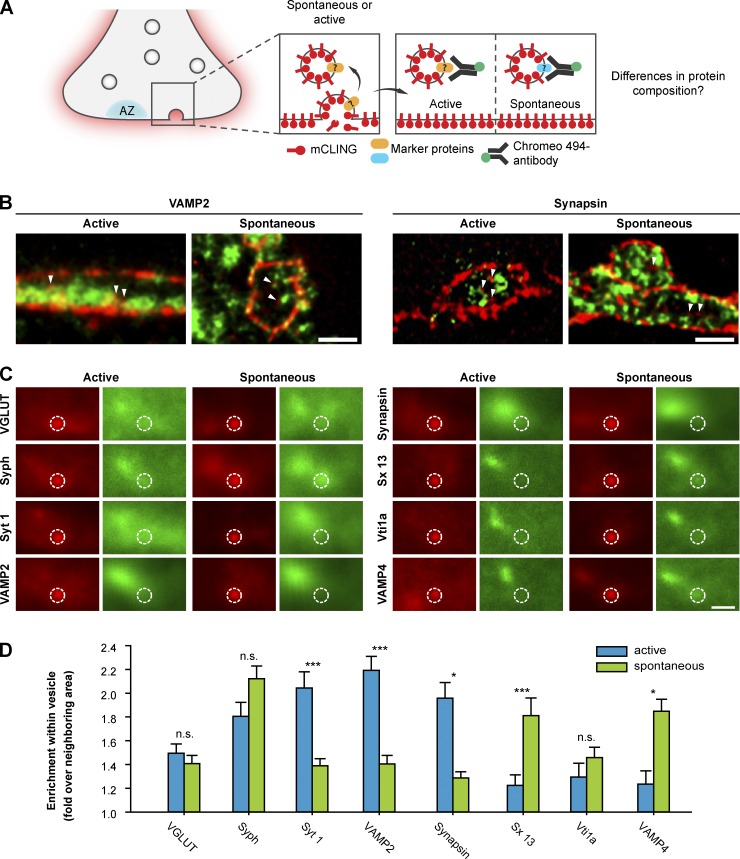
Figure 8.
mCLING reveals differences in protein composition between actively and spontaneously recycling synaptic vesicles in hippocampal neurons. (A) Experimental outline: neurons are incubated with mCLING, an...
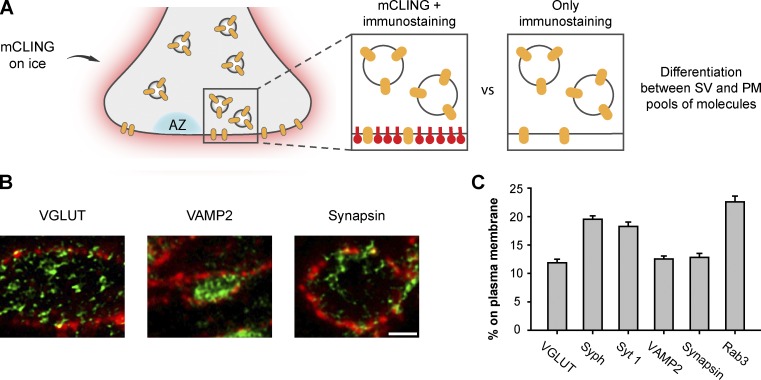
Figure 9.
mCLING use in identifying the membrane-associated fraction of synaptic vesicle proteins. (A) Experimental outline: application of mCLING on ice reveals only the plasma membrane (PM). Immunostaining th...
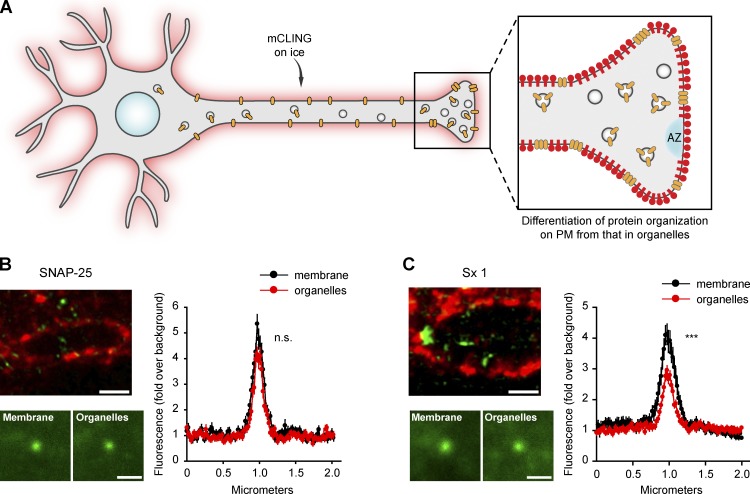
Figure 10.
mCLING use in revealing differences between organellar and plasma membrane protein assemblies. (A) Experimental outline: as in Fig. 9 , mCLING reveals the plasma membrane (PM) and allows the identific...
Figure images are served from the NIH/NLM PubMed Central Open Access Subset or Europe PMC; copyright remains with the publishers and authors.
💬 Discussion
0 commentsNo comments yet. Be the first to start a discussion!
Leave a Comment