Abstract
Specialized cell types exploit endosomal trafficking to deliver protein cargoes to cell type-specific lysosome-related organelles (LROs), but how endosomes are specified for this function is not known. In this study, we show that the clathrin adaptor AP-1 and the kinesin motor KIF13A together create peripheral recycling endosomal subdomains in melanocytes required for cargo delivery to maturing melanosomes. In cells depleted of AP-1 or KIF13A, a subpopulation of recycling endosomes redistributes to pericentriolar clusters, resulting in sequestration of melanosomal enzymes like Tyrp1 in vacuolar endosomes and consequent inhibition of melanin synthesis and melanosome maturation. Immunocytochemistry, live cell imaging, and electron tomography reveal AP-1- and KIF13A-dependent dynamic close appositions and continuities between peripheral endosomal tubules and melanosomes. Our results reveal that LRO protein sorting is coupled to cell type-specific positioning of endosomes that facilitate endosome-LRO contacts and are required for organelle maturation.
🔬 Techniques
🔭 Microscopes
💻 Software
✨ Fluorophores
🧪 Sample Preparation
🏭 Microscope Brands
🧪 Reagent Suppliers
📷 Detectors
🔎 Objectives
💻 Software Details
🏛️ Research Organizations (ROR)
Affiliated research institutions:
📋 Methods
Antibodies
Mouse monoclonal anti-Tyrp1 (ab3312), HMB-45 to Pmel17 (ab787), anti-EEA1 (ab15846), anti-CD9 (ab19761), and rabbit polyclonal anti–β-tubulin (ab6046) were obtained from Abcam.
Mouse monoclonal H4A3 to human
LAMP-1 was obtained from BD. Sheep anti–human TGN46 was obtained from AbD Serotec, mouse monoclonal anti–γ-adaptin (clone 100/3) was obtained from Sigma-Aldrich, anti-GM130 rabbit polyclonal antibody was obtained from EMD, and rabbit polyclonal to KIF13A was obtained from Bethyl Laboratories, Inc. (A301-077A). The rabbit polyclonal antibody to full-length recombinant Rab11A was described previously ( Wilcke et al., 2000 ). Rabbit polyclonal antibodies to µ1a and EEA1 and the mouse mAb (SA4) to the AP-3 δ subunit were provided by L. Traub (University of Pittsburgh, Pittsburgh, PA), M.J. Clague (University of Liverpool, Liverpool, England, UK), and A.A. Peden (University of Cambridge, Cambridge, England, UK), respectively. Tf-A488 and -A555 were obtained from Invitrogen, HRP-conjugated Tf was provided by G. LeDez and P. Chavrier (Institut Curie, Centre National de la Recherche Scientifique, Paris, France), and secondary goat anti–rabbit or –mouse antibodies conjugated to Alexa Fluor 488, 555, or 647 were obtained from Invitrogen. Protein A conjugated to 10- or 15-nm gold particles was obtained from the Cell Microscopy Center (Utrecht University Hospital, Utrecht, Netherlands).
Cell culture and siRNA depletion
MNT-1 cells were maintained in DME supplemented with 20% FBS (Invitrogen) as previously described ( Raposo et al., 2001 ), and transfection with oligonucleotides proceeded as reported previously ( Theos et al., 2006 ). 1 × 10 6 cells were seeded in a 10-cm dish at day 1 and transfected on day 3 with 40 pmol siRNA according to the manufacturer's instructions (Oligofectamine; Invitrogen). At day 4, 1 × 10 5 transfected cells were seeded in 6-well plates and were either transfected or not a second time at day 5. Cells were collected at day 5 or 7 and processed for melanin quantification assays ( Wasmeier et al., 2006 ), IFM, EM, and Western blotting. The level of expression of each corresponding protein was assessed by Western blotting using specific antibodies and compared with β-tubulin expression as a loading control. Oligonucleotides used in siRNA experiments The sense strand for the indicated double-stranded siRNAs were synthesized with the following sequences or derived from the following references: siRNA control, 5′-AATTCTCCGAACGTGTCACGT-3′; siRNA µ1a #1, 5′-AAGGCATCAAGTATCGGAAGA-3′ ( Hirst et al., 2003 ); siRNA µ1a #2, 5′-CCCGATCAGTGTCAAGTTCGA-3′ (QIAGEN); siRNA γ-adaptin, 5′-ACCGAATTAAGAAAGTGGT-3′; siRNA β3A, 5′-ATGGCTGATCTTGAAGGTTTA-3′ ( Lui-Roberts et al., 2005 ); KIF13A siRNA, sc-43380 (Santa Cruz Biotechnology, Inc.); siRNA KIF13A #2, 5′-CTGGCGGGTAGCGAAAGAGTA-3′ (QIAGEN); and siRNA KIF13A #3, 5′-CCGCAACAACTTGGTAGGAAA-3′ (QIAGEN). Microinjection of siRNAs Microinjection of MNT-1 cells grown on 35-mm glass coverslips was performed using a manual microinjector (TransferMan NK2; Eppendorf). 5 µM of the corresponding siRNA was diluted in the microinjection buffer (5 mM phosphate sodium buffer, pH 7.2, and 100 mM KCl) supplemented with 1 µM Texas red–conjugated dextran (Invitrogen), which was used as a microinjection marker. Plasmids Full-length KIF13A cDNA (Thermo Fisher Scientific) was prepared from bacteria using the Plasmid Mini kit (QIAGEN), and the tail corresponding sequence (nucleotides 3,919–5,310, corresponding to the last 464 amino acids of KIF13A) was amplified by PCR. The sequence corresponding to the KIF13A tail domain was verified and cloned in mammalian expression vectors with the N-terminal GFP tag using a cloning system according to the manufacturer's instructions (Gateway; Invitrogen). pSPOII-GFP was provided by E. Bertrand (Institut de Génétique Moléculaire de Montpellier, Montpellier, France; Boulon et al., 2008 ). Cross-linking and immunoprecipitations MNT-1 cells at 80% of confluency were washed in cold PBS and lysed on ice in lysis buffer (50 mM Tris, 150 mM NaCl, 0.1% Triton X-100, 10 mM EDTA, pH 7.2, and protease inhibitor cocktail [Roche]). For cross-linking experiments, three dishes per condition were incubated with 1 mM DSP (dithiobis[succinimidyl propionate]; Thermo Fisher Scientific) in 1% DMSO or in 1% DMSO alone in cross-linking buffer (150 mM NaCl, 0.2 mM CaCl 2 , 0.2 mM MgCl 2 , and 10 mM Hepes, pH 7.3) for 30 min at 4°C, neutralized with three washes in 150 mM NaCl and 20 mM Tris, pH 7.3, and lysed on ice in lysis buffer. Then, lysate was first precleared using protein G agarose beads for 1 h at 4°C under rotation. Supernatants were collected and incubated with protein G agarose beads with 1 µg rabbit anti–human IgG or 1 µg mouse monoclonal IgG 2b anti-CD9 for 1 h at 4°C. To immunoprecipitate KIF13A, γ-adaptin, or Tyrp1, supernatants were incubated with beads coated earlier with 1 µg anti-KIF13A polyclonal antibodies, 1 µg mouse monoclonal IgG 2b anti–γ-adaptin, or 1 ml TA99 supernatant, respectively, for 2 h at 4°C under rotation. As controls, 1 µg rabbit anti–human IgG and 1 µg mouse monoclonal IgG 2b anti-CD9 were used to immunoprecipitate the lysate. After three washes in cold lysis buffer, immunoprecipitated proteins bound to the beads were incubated in sample buffer with reducing agent, boiled, and fractionated by SDS-PAGE using Nupage (3–8%) Tris-acetate gels (Invitrogen) for Western blotting detection of KIF13A and cross-linked proteins or Nupage (4–12%) Bis-Tris gels (Invitrogen) to reveal γ-adaptin. Material was transferred on nitrocellulose membrane (Millipore) to XCell II Blot Module (Invitrogen) and detected using KIF13A and γ-adaptin antibodies. Tf uptake, immunofluorescence, and time-lapse fluorescence microscopy MNT-1 cells were washed in FBS (GIBCO), then in PBS, and starved for 45 min in DME at 37°C in 5% CO 2 . Cells were further incubated in DME supplemented with Tf-A488 or Tf-A555 at a final concentration of 10 µg/ml for 30 min at 37°C in 5% CO 2 . Cells were washed in PBS at 37°C and fixed for 10 min at RT in 4% PFA except for KIF13A labeling, in which cells were fixed in cold methanol followed by incubation in PBS and 1 mg/ml BSA (blocking buffer) all along the procedure. Fixed cells were washed in PBS, quenched for 10 min in PBS and 50 mM glycine at RT, saturated in blocking buffer, and permeabilized in PBS, 0.05% saponin, and 1 mg/ml BSA (incubation buffer [IB]). Cells were incubated for 45 min with the primary antibody diluted in IB, washed three times in IB, and incubated with the corresponding secondary antibody for 30 min. Cells were washed twice in IB and once in blocking buffer. Finally, coverslips were mounted in DABCO medium and examined under a 3D deconvolution microscope (DM-RXA2; Leica) equipped with a piezo z drive (Physik Instrument) and a 100 × 1.4 NA Plan Apo objective lens for optical sectioning. 3D multicolor image stacks were acquired using MetaMorph software (MDS Analytical Technologies) through a cooled charge-coupled device (CCD) camera (Coolsnap HQ; Photometrics). All IFM images are deconvoluted and maximum intensity z projections ( Figs. 1–4 , S1, and S3; Sibarita, 2005 ). For time-lapse microscopy, MNT-1 cells grown on glass coverslips were transferred just before observation to custom-built aluminum microscope slide chambers (Ludin chamber; Life Imaging Services) filled with culture medium supplemented with10 µg/ml Tf-A488 and 10 mM Hepes. Time-lapse imaging was performed at 37°C (Life Imaging Services) using a spinning-disk microscope mounted on an inverted motorized microscope (TE2000-U; Nikon) through a 100 × 1.4 NA Plan Apo objective lens. The apparatus is composed of a spinning-disk head (CSU-22; Yokogawa), a laser lounge (with a 491-nm Cobalt for GFP observation; Roper Industries), a CCD camera (Coolsnap HQ2; Photometrics) for image acquisition, and MetaMorph software to control the setup. The acquisition parameters used were 200-ms exposure for A-488 channel and 30 ms for bright field.
Show full methods section
Antibodies
Mouse monoclonal anti-Tyrp1 (ab3312), HMB-45 to Pmel17 (ab787), anti-EEA1 (ab15846), anti-CD9 (ab19761), and rabbit polyclonal anti–β-tubulin (ab6046) were obtained from Abcam.
Mouse monoclonal H4A3 to human
LAMP-1 was obtained from BD. Sheep anti–human TGN46 was obtained from AbD Serotec, mouse monoclonal anti–γ-adaptin (clone 100/3) was obtained from Sigma-Aldrich, anti-GM130 rabbit polyclonal antibody was obtained from EMD, and rabbit polyclonal to KIF13A was obtained from Bethyl Laboratories, Inc. (A301-077A). The rabbit polyclonal antibody to full-length recombinant Rab11A was described previously ( Wilcke et al., 2000 ). Rabbit polyclonal antibodies to µ1a and EEA1 and the mouse mAb (SA4) to the AP-3 δ subunit were provided by L. Traub (University of Pittsburgh, Pittsburgh, PA), M.J. Clague (University of Liverpool, Liverpool, England, UK), and A.A. Peden (University of Cambridge, Cambridge, England, UK), respectively. Tf-A488 and -A555 were obtained from Invitrogen, HRP-conjugated Tf was provided by G. LeDez and P. Chavrier (Institut Curie, Centre National de la Recherche Scientifique, Paris, France), and secondary goat anti–rabbit or –mouse antibodies conjugated to Alexa Fluor 488, 555, or 647 were obtained from Invitrogen. Protein A conjugated to 10- or 15-nm gold particles was obtained from the Cell Microscopy Center (Utrecht University Hospital, Utrecht, Netherlands).
Cell culture and siRNA depletion
MNT-1 cells were maintained in DME supplemented with 20% FBS (Invitrogen) as previously described ( Raposo et al., 2001 ), and transfection with oligonucleotides proceeded as reported previously ( Theos et al., 2006 ). 1 × 10 6 cells were seeded in a 10-cm dish at day 1 and transfected on day 3 with 40 pmol siRNA according to the manufacturer's instructions (Oligofectamine; Invitrogen). At day 4, 1 × 10 5 transfected cells were seeded in 6-well plates and were either transfected or not a second time at day 5. Cells were collected at day 5 or 7 and processed for melanin quantification assays ( Wasmeier et al., 2006 ), IFM, EM, and Western blotting. The level of expression of each corresponding protein was assessed by Western blotting using specific antibodies and compared with β-tubulin expression as a loading control. Oligonucleotides used in siRNA experiments The sense strand for the indicated double-stranded siRNAs were synthesized with the following sequences or derived from the following references: siRNA control, 5′-AATTCTCCGAACGTGTCACGT-3′; siRNA µ1a #1, 5′-AAGGCATCAAGTATCGGAAGA-3′ ( Hirst et al., 2003 ); siRNA µ1a #2, 5′-CCCGATCAGTGTCAAGTTCGA-3′ (QIAGEN); siRNA γ-adaptin, 5′-ACCGAATTAAGAAAGTGGT-3′; siRNA β3A, 5′-ATGGCTGATCTTGAAGGTTTA-3′ ( Lui-Roberts et al., 2005 ); KIF13A siRNA, sc-43380 (Santa Cruz Biotechnology, Inc.); siRNA KIF13A #2, 5′-CTGGCGGGTAGCGAAAGAGTA-3′ (QIAGEN); and siRNA KIF13A #3, 5′-CCGCAACAACTTGGTAGGAAA-3′ (QIAGEN). Microinjection of siRNAs Microinjection of MNT-1 cells grown on 35-mm glass coverslips was performed using a manual microinjector (TransferMan NK2; Eppendorf). 5 µM of the corresponding siRNA was diluted in the microinjection buffer (5 mM phosphate sodium buffer, pH 7.2, and 100 mM KCl) supplemented with 1 µM Texas red–conjugated dextran (Invitrogen), which was used as a microinjection marker. Plasmids Full-length KIF13A cDNA (Thermo Fisher Scientific) was prepared from bacteria using the Plasmid Mini kit (QIAGEN), and the tail corresponding sequence (nucleotides 3,919–5,310, corresponding to the last 464 amino acids of KIF13A) was amplified by PCR. The sequence corresponding to the KIF13A tail domain was verified and cloned in mammalian expression vectors with the N-terminal GFP tag using a cloning system according to the manufacturer's instructions (Gateway; Invitrogen). pSPOII-GFP was provided by E. Bertrand (Institut de Génétique Moléculaire de Montpellier, Montpellier, France; Boulon et al., 2008 ). Cross-linking and immunoprecipitations MNT-1 cells at 80% of confluency were washed in cold PBS and lysed on ice in lysis buffer (50 mM Tris, 150 mM NaCl, 0.1% Triton X-100, 10 mM EDTA, pH 7.2, and protease inhibitor cocktail [Roche]). For cross-linking experiments, three dishes per condition were incubated with 1 mM DSP (dithiobis[succinimidyl propionate]; Thermo Fisher Scientific) in 1% DMSO or in 1% DMSO alone in cross-linking buffer (150 mM NaCl, 0.2 mM CaCl 2 , 0.2 mM MgCl 2 , and 10 mM Hepes, pH 7.3) for 30 min at 4°C, neutralized with three washes in 150 mM NaCl and 20 mM Tris, pH 7.3, and lysed on ice in lysis buffer. Then, lysate was first precleared using protein G agarose beads for 1 h at 4°C under rotation. Supernatants were collected and incubated with protein G agarose beads with 1 µg rabbit anti–human IgG or 1 µg mouse monoclonal IgG 2b anti-CD9 for 1 h at 4°C. To immunoprecipitate KIF13A, γ-adaptin, or Tyrp1, supernatants were incubated with beads coated earlier with 1 µg anti-KIF13A polyclonal antibodies, 1 µg mouse monoclonal IgG 2b anti–γ-adaptin, or 1 ml TA99 supernatant, respectively, for 2 h at 4°C under rotation. As controls, 1 µg rabbit anti–human IgG and 1 µg mouse monoclonal IgG 2b anti-CD9 were used to immunoprecipitate the lysate. After three washes in cold lysis buffer, immunoprecipitated proteins bound to the beads were incubated in sample buffer with reducing agent, boiled, and fractionated by SDS-PAGE using Nupage (3–8%) Tris-acetate gels (Invitrogen) for Western blotting detection of KIF13A and cross-linked proteins or Nupage (4–12%) Bis-Tris gels (Invitrogen) to reveal γ-adaptin. Material was transferred on nitrocellulose membrane (Millipore) to XCell II Blot Module (Invitrogen) and detected using KIF13A and γ-adaptin antibodies. Tf uptake, immunofluorescence, and time-lapse fluorescence microscopy MNT-1 cells were washed in FBS (GIBCO), then in PBS, and starved for 45 min in DME at 37°C in 5% CO 2 . Cells were further incubated in DME supplemented with Tf-A488 or Tf-A555 at a final concentration of 10 µg/ml for 30 min at 37°C in 5% CO 2 . Cells were washed in PBS at 37°C and fixed for 10 min at RT in 4% PFA except for KIF13A labeling, in which cells were fixed in cold methanol followed by incubation in PBS and 1 mg/ml BSA (blocking buffer) all along the procedure. Fixed cells were washed in PBS, quenched for 10 min in PBS and 50 mM glycine at RT, saturated in blocking buffer, and permeabilized in PBS, 0.05% saponin, and 1 mg/ml BSA (incubation buffer [IB]). Cells were incubated for 45 min with the primary antibody diluted in IB, washed three times in IB, and incubated with the corresponding secondary antibody for 30 min. Cells were washed twice in IB and once in blocking buffer. Finally, coverslips were mounted in DABCO medium and examined under a 3D deconvolution microscope (DM-RXA2; Leica) equipped with a piezo z drive (Physik Instrument) and a 100 × 1.4 NA Plan Apo objective lens for optical sectioning. 3D multicolor image stacks were acquired using MetaMorph software (MDS Analytical Technologies) through a cooled charge-coupled device (CCD) camera (Coolsnap HQ; Photometrics). All IFM images are deconvoluted and maximum intensity z projections ( Figs. 1–4 , S1, and S3; Sibarita, 2005 ). For time-lapse microscopy, MNT-1 cells grown on glass coverslips were transferred just before observation to custom-built aluminum microscope slide chambers (Ludin chamber; Life Imaging Services) filled with culture medium supplemented with10 µg/ml Tf-A488 and 10 mM Hepes. Time-lapse imaging was performed at 37°C (Life Imaging Services) using a spinning-disk microscope mounted on an inverted motorized microscope (TE2000-U; Nikon) through a 100 × 1.4 NA Plan Apo objective lens. The apparatus is composed of a spinning-disk head (CSU-22; Yokogawa), a laser lounge (with a 491-nm Cobalt for GFP observation; Roper Industries), a CCD camera (Coolsnap HQ2; Photometrics) for image acquisition, and MetaMorph software to control the setup. The acquisition parameters used were 200-ms exposure for A-488 channel and 30 ms for bright field.
Tf-endocytosis assay
Control and AP-1–inactivated MNT-1 cells were starved for 30 min and incubated for 30 min with 10 µg/ml Tf-A488 at 19.5°C to accumulate Tf in early endosomal compartments. Medium was removed and replaced with prewarmed complete medium, the temperature was shifted to 37°C, and Tf was chased for 10 and 30 min. Cells were fixed at each time point and immunolabeled with anti–γ-adaptin antibodies to identify inactivated cells. Images were acquired under a 3D deconvolution microscope and processed for deconvolution. The total Tf-A488 fluorescence and γ-adaptin labeling intensity were measured and averaged using MetaMorph software. EM For conventional EM, control and inactivated MNT-1 cells grown on coverslips were fixed with 2.5% glutaraldehyde in 0.1 M cacodylate buffer for 24 h and processed as described previously ( Raposo et al., 2001 ). For ultrathin cryosectioning and immunogold labeling, cells were fixed with 2% PFA or with a mixture of 2% PFA and 0.2% glutaraldehyde in 0.1 M phosphate buffer, pH 7.4. Cells were processed for ultracryomicrotomy and single- or double-immunogold labeled using protein A conjugated to 10 nm gold (PAG10) or 15 nm gold (PAG15) as reported previously ( Theos et al., 2005 ). Sections were observed under an electron microscope (Philips CM120; FEI Company), and digital acquisitions were made with a numeric camera (Keen View; Soft Imaging System). Internalization of Tf-HRP MNT-1 grown on glass coverslips for 2 d were starved for 45 min in DME and incubated with DME supplemented with 25 µg/ml Tf-HRP for 30 min. Cells were rapidly washed in DME at 4°C and fixed for 90 min with a mixture of 2% PFA/0.5% glutaraldehyde in 0.2 M phosphate buffer, pH 7.4. To reveal HRP, cells were washed three times for 5 min in 50 mM Tris-HCl, pH 6.85, and incubated with 1.5 mg/ml DAB for 30 min followed by a 1-h incubation with 1.5 mg/ml DAB supplemented with 0.5% H 2 O 2 . Cells were fixed with 2.5% glutaraldehyde in 0.1 M cacodylate buffer for 90 min, postfixed with 2% OsO 4 , dehydrated in ethanol, and embedded in epon. Ultrathin (60–70 nm) or thick (300–400 nm) sections were observed at 80 or 200 kV for electron tomography (see following paragraph).
Electron tomography
MNT-1 cells were grown on carbonated sapphire discs at 70% confluency and were high pressure frozen with a high pressure freezer (EM PACT I; Leica), freeze substituted in a freeze substitution system (AFS; Leica), and embedded in epon 812 (TAAB Laboratories Equipment Ltd.) as described previously ( Hurbain et al., 2008 ). Tomographic acquisitions made on thick 350-nm sections of HPF-fixed, freeze-substituted MNT-1 cells were cut on a microtome (Reichert Ultracut S; Leica) and collected on formvar-coated copper grids (75 mesh) for analysis by electron tomography. Sections were randomly labeled on the two sides with 10 nm PAG and post-stained with 2% uranyl acetate in methanol for 4 min and lead citrate for 2 min. Finally, tilt series (two perpendicular series per tomogram, angular range from −60 to 60° with a 1° increment) of 350-nm-thick sections were recorded automatically using Xplore3D (FEI Company) on a 200-kV transmission electron microscope (Tecnai 20; FEI Company) and used for reconstructing tomograms. Projection images (1,024 × 1,024 pixels) were recorded using a CCD camera (Temcam F214; Tietz Video and Image Processing Systems GmbH). After acquiring the first tilt series, the specimen grid was rotated over an angle of 90°, and a second series was recorded of the same area. Alignment of the tilt series and tomogram computing (resolution-weighted back projection) were performed using the IMOD program ( Kremer et al., 1996 ). The 10-nm gold particles at the surface of the sections were used as fiducial markers. Manual contouring of the tomograms was performed using IMOD. Finally, the contours were meshed, and the z scale was stretched with a factor of 1.6 to correct for resin shrinkage ( Mastronarde, 1997 ).
Image analysis and quantitation
For localization and colocalization analysis, segmentation was performed using the wavelet-based multidimensional analysis software (MIA imaging platform; Cell and Tissue Imaging Facility of Curie Institute [PICT-IBISA]; Paris, France). This segmentation algorithm is widely used to detect small, isolated structures in a heterogeneous and noisy background ( Sibarita, 2005 ). Colocalization in Fig. 2 B was evaluated after 3D segmentation of individual channels and quantification of overlap between the two masks. Likewise, endosomal distributions ( Fig. 3 C ) were computed as the histogram of distances between endosomes and Golgi. Endosomes were segmented using MIA software, and their positions were detected in the x, y, and z axes. The center of the cell was manually determined as the center of Golgi labeling (GM130) along the three axes. Lastly, distances (in pixels) between each endosome position and the fixed center were calculated and reported on a graph as endosomal distribution in percent relative to distance in pixels. To determine the compaction factor ( Fig. 4, D and G ), >30 cells per condition were acquired, and the intensity of labeling for Tf and γ-adaptin was measured. Background fluorescence intensity was subtracted from the intensity of the whole cell (total intensity; I t ) and from within the Golgi area (I g ), and the compaction factor (C f = I g /I t ) was measured. All measures have been averaged ( Fig. 4, D and G ) and normalized to the control ( Fig. 4 D ). For time-lapse microscopy ( Fig. 6 ), all melanosomes were tracked after binary treatment of the original images. The intensity of the Tf-A488 signal was measured during the length of the time-lapse acquisition, within a window of 5 pixels in size, around each tracked melanosome ( n = 860). Distribution of binned Tf-A488 intensities was gathered as classes of intensities. From these data, frequencies of distribution of binned Tf-A488 intensities in the vicinity of tracked melanosomes in the whole cell or within the indicated area were calculated on the whole time sequences ( Fig. 6 C ). Mean frame number in which individual Tf endosomes appeared in continuous contact of individual tracked melanosomes were also deduced from these data ( Fig. 6 D ). Quantification of immunogold labeling on ultrathin cryosections was performed as described previously ( Theos et al., 2005 ). The relative distribution of AP-1 in MNT-1 cells was evaluated by analyzing randomly selected cell profiles from two distinct grids directly under the electron microscope. A total of 1,526 gold particles was counted and assigned to the compartment over which they were located. The definition of the distinct compartments was based on their morphology and their previous characterization by immunogold labeling with different organelle markers (EEA-1 and Hrs for early endosomes; TGN46 for the TGN; and LAMP-1 for late endosomes/lysosomes) and internalization of endocytic tracers (BSA-gold and Tf-FITC). Tubulovesicular membranes that were located close to the trans-side of the Golgi were considered as TGN. Vacuolar endosomes were defined as electron-lucent vacuoles with no internal membranes or few internal vesicles. Multivesicular bodies were compartments delimited by a membrane with numerous internal vesicles. Electron-dense compartments with few or no internal membranes were classified as lysosomes. Clearly visible tubulovesicular membrane profiles connected to or in close association with endosomal vacuoles, melanosomes, multivesicular bodies, and lysosomes were also defined. Melanosome stages were defined by morphology ( Raposo et al., 2001 ).
Quantification of Tyrp1 distribution in control or AP-1– and KIF13A-inactivated
MNT-1 cells was performed on single immunogold–labeled cryosections by counting the number of gold particles in each of the defined compartments (as for the quantification of AP-1 distribution) taken randomly in 50 cell profiles. Totals of 897, 855, and 750 gold particles were counted in control, AP-1–, and KIF13A-inactivated cells, respectively. Results are presented as a percentage of the total number of gold particles in each compartment and represent a mean and standard deviation of two independent experiments. Online supplemental material Fig. S1 characterizes the distribution of the endosomal recycling compartments in MNT-1 melanocytic cells using IFM analyses. Fig. S2 shows by IEM that endosomal tubules filled with Tf-biot are distinct from EEA1-positive endosomes and localize in the vicinity of pigmented melanosomes and not unpigmented premelanosomes as well as in the absence of the µ1B subunit of AP-1 in MNT-1 cells by RT-PCR. Fig. S3 illustrates by IFM the specific perinuclear clustering of recycling endosomes in KIF13A-depleted cells, the characterization by Western blotting of two different siRNAs to µ1A and KIF13A, and the immunoprecipitation of KIF13A in MNT-1 cells in the absence or presence of a blocking peptide. Fig. S4 shows the specific perinuclear clustering of recycling endosomes in cells overexpressing the tail of KIF13A or in cells microinjected with µ1A or KIF13A siRNAs. Fig. S5 shows different examples of tilt series, tomographic reconstructions, and 3D models of mature melanosomes in continuity with endosomes either filled or not with Tf-HRP. Video 1 shows dynamics of Tf-A488–filled endosomal tubules close to melanosomes by video microscopy. Videos 2–10 show a number of tilt series, tomographic reconstructions, and 3D models of pigmented melanosomes continuous with endosomal tubules. Online supplemental material is available at http://www.jcb.org/cgi/content/full/jcb.200907122/DC1 .
Online supplemental material Fig. S1 characterizes the distribution of the endosomal recycling compartments in MNT-1 melanocytic cells using IFM analyses. Fig. S2 shows by IEM that endosomal tubules filled with Tf-biot are distinct from EEA1-positive endosomes and localize in the vicinity of pigmented melanosomes and not unpigmented premelanosomes as well as in the absence of the µ1B subunit of AP-1 in MNT-1 cells by RT-PCR. Fig. S3 illustrates by IFM the specific perinuclear clustering of recycling endosomes in KIF13A-depleted cells, the characterization by Western blotting of two different siRNAs to µ1A and KIF13A, and the immunoprecipitation of KIF13A in MNT-1 cells in the absence or presence of a blocking peptide. Fig. S4 shows the specific perinuclear clustering of recycling endosomes in cells overexpressing the tail of KIF13A or in cells microinjected with µ1A or KIF13A siRNAs. Fig. S5 shows different examples of tilt series, tomographic reconstructions, and 3D models of mature melanosomes in continuity with endosomes either filled or not with Tf-HRP. Video 1 shows dynamics of Tf-A488–filled endosomal tubules close to melanosomes by video microscopy. Videos 2–10 show a number of tilt series, tomographic reconstructions, and 3D models of pigmented melanosomes continuous with endosomal tubules. Online supplemental material is available at http://www.jcb.org/cgi/content/full/jcb.200907122/DC1 .
📊 Figures
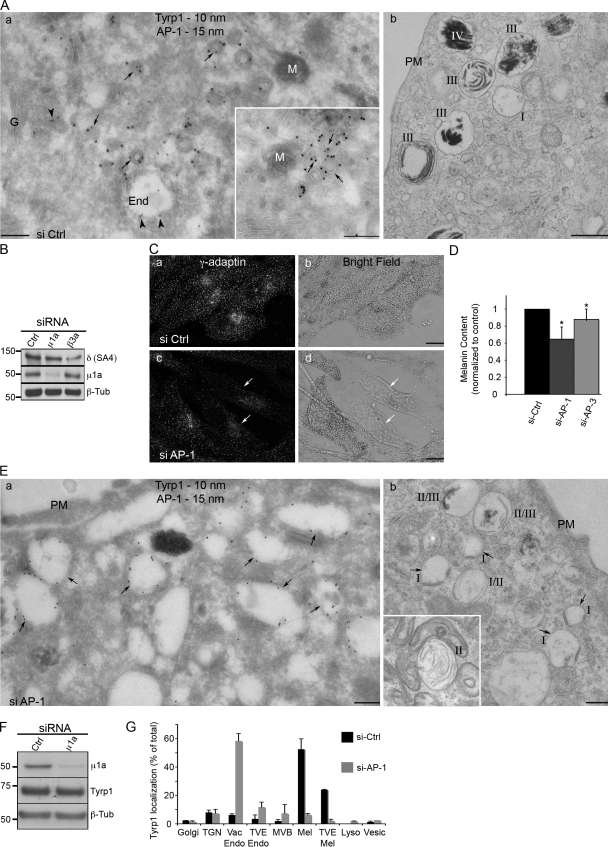
Figure 1.
Depletion of AP-1 inhibits melanogenesis and results in Tyrp1 accumulation in endosomal vacuoles. (A) MNT-1 cells treated with control siRNA (si Ctrl) were analyzed by ultracryomicrotomy (a) or conven...
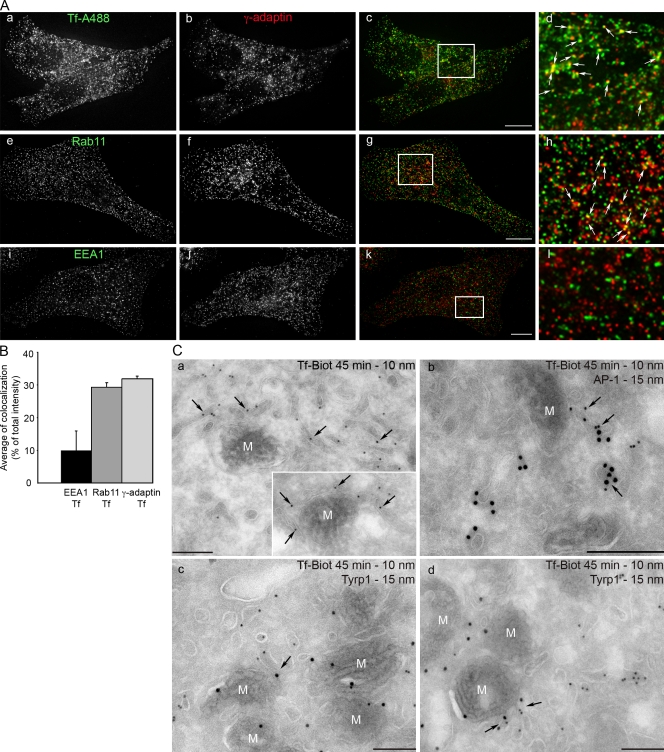
Figure 2.
AP-1 and Tyrp1 localize to subdomains of the recycling compartment adjacent to melanosomes. (A) MNT-1 cells that had internalized Tf-A488 for 45 min were analyzed by IFM after labeling for AP-1 (u03b3...
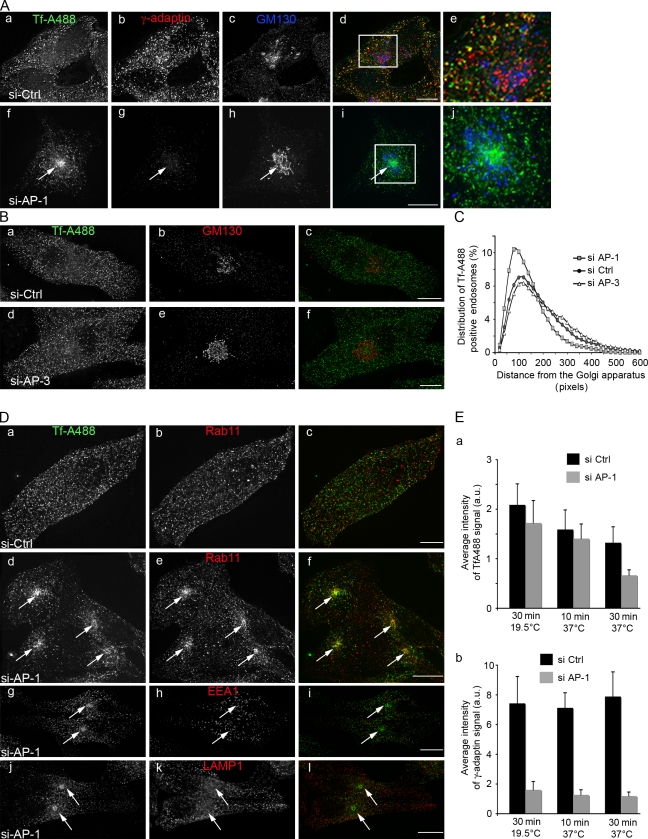
Figure 3.
AP-1 is required for the peripheral distribution of recycling endosomal domains. (A) IFM analysis of MNT-1 cells treated with control (au2013e) or u00b51A/u03b3-adaptin (fu2013j) siRNAs that had inter...
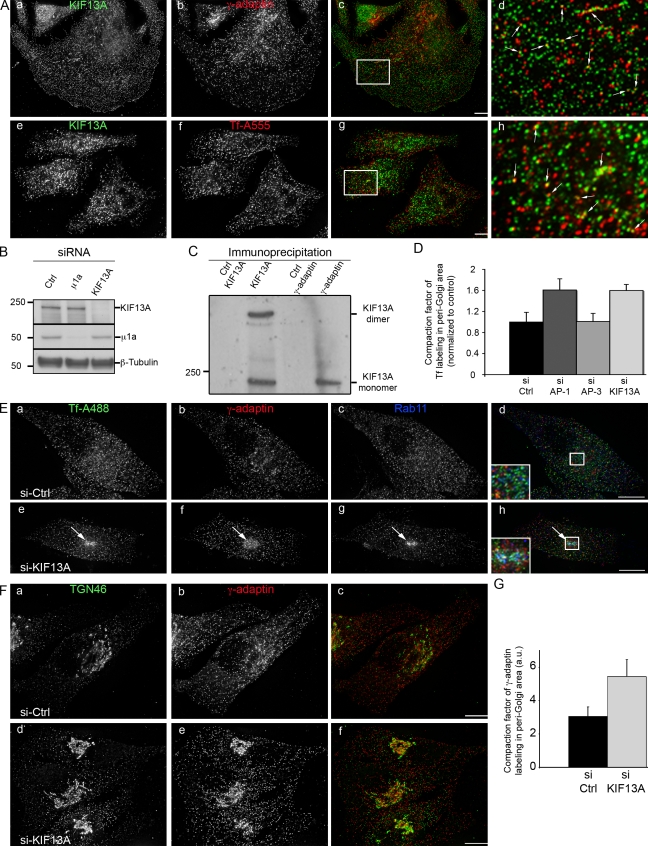
Figure 4.
AP-1 and KIF13A function together on the peripheral localization of recycling endosomes. (A) MNT-1 cells were fixed in cold methanol, and endogenous KIF13A localization (a and d) was assessed relative...
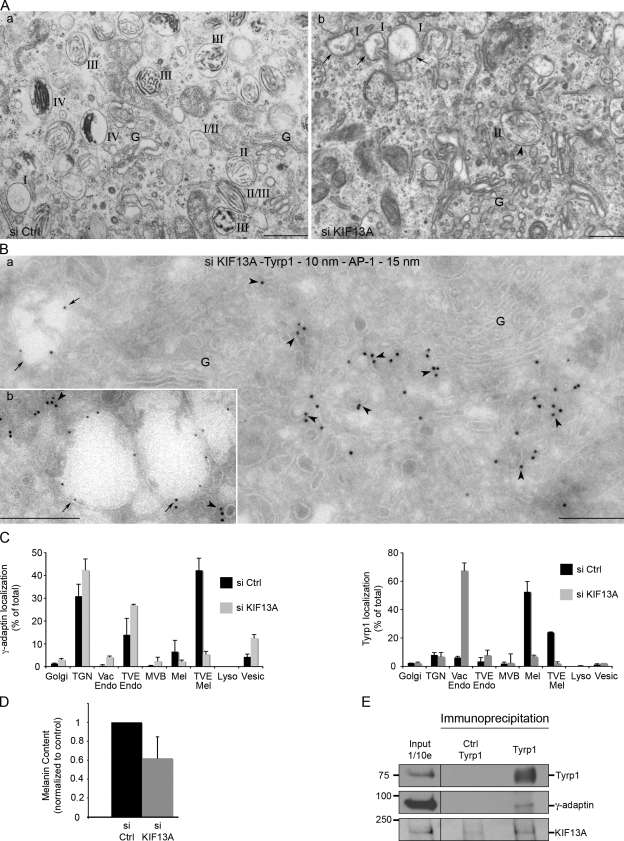
Figure 5.
Depletion of KIF13A inhibits melanogenesis and results in Tyrp1 accumulation in endosomal vacuoles. (A) Cells treated with control (a) or KIF13A (b) siRNAs were analyzed by conventional EM. KIF13A-dep...
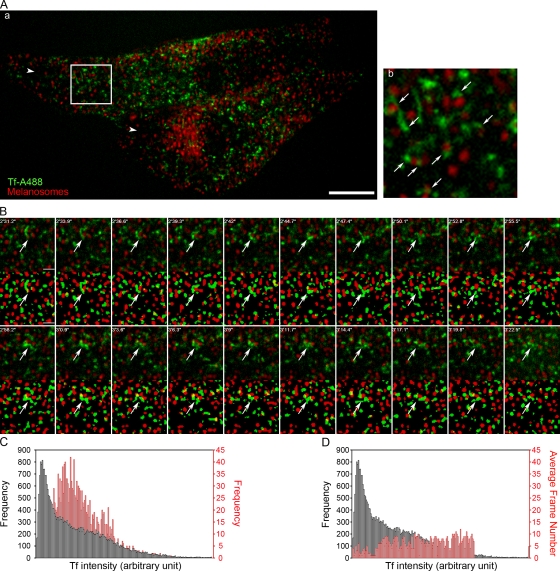
Figure 6.
Endosomal tubules dynamically contact melanosomes. (A) Spinning-disc confocal microscopy was used to capture concomitant movements of Tf-positive endosomes (green) and melanosomes (red). (a) View of a...
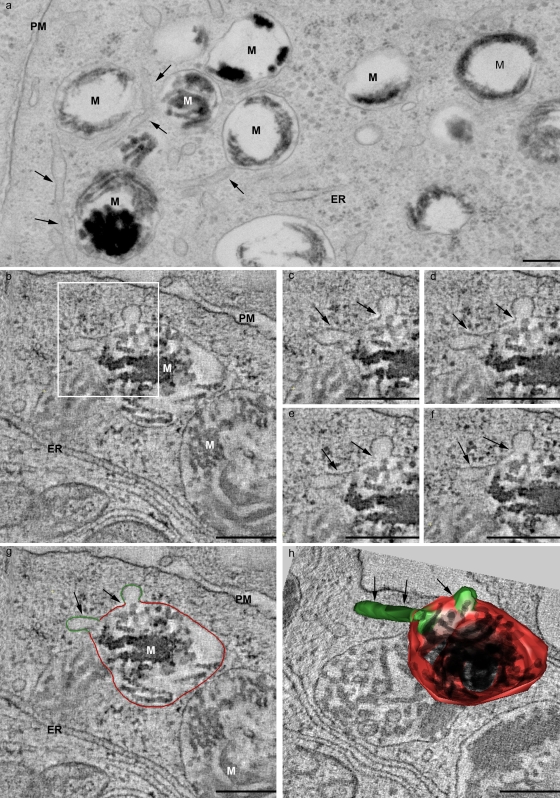
Figure 7.
Endosomal tubules are continuous with the melanosome limiting membrane. (a) Low magnification EM analysis of thin sections of MNT-1 cells fixed by HPF. Several smooth tubules are close to and surround...
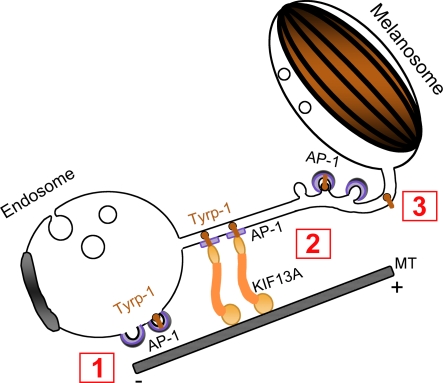
Figure 8.
Model for AP-1 and KIF13A function in Tyrp1 sorting and endosome positioning. AP-1 is recruited to endosomes through its interaction with the sorting signal in the cytoplasmic domain of Tyrp1 (step 1)...
Figure images are served from the NIH/NLM PubMed Central Open Access Subset or Europe PMC; copyright remains with the publishers and authors.
💬 Discussion
0 commentsNo comments yet. Be the first to start a discussion!
Leave a Comment