Abstract
Abstract Astrocytes are important regulators of excitatory synaptic networks. However, astrocytes regulation of inhibitory synaptic systems remains ill defined. This is particularly relevant since GABAergic interneurons regulate the activity of excitatory cells and shape network function. To address this issue, we combined optogenetics and pharmacological approaches, two-photon confocal imaging and whole-cell recordings to specifically activate hippocampal somatostatin or paravalbumin-expressing interneurons (SOM-INs or PV-INs), while monitoring inhibitory synaptic currents in pyramidal cells and Ca 2+ responses in astrocytes. We found that astrocytes detect SOM-IN synaptic activity via GABA B R and GAT-3-dependent Ca 2+ signaling mechanisms, the latter triggering the release of ATP. In turn, ATP is converted into adenosine, activating A 1 Rs and upregulating SOM-IN synaptic inhibition of pyramidal cells, but not PV-IN inhibition. Our findings uncover functional interactions between a specific subpopulation of interneurons, astrocytes and pyramidal cells, involved in positive feedback autoregulation of dendritic inhibition of pyramidal cells.
🔬 Techniques
🔭 Microscopes
✨ Fluorophores
🧪 Sample Preparation
🔬 Cell Lines
🏭 Microscope Brands
🧪 Reagent Suppliers
💻 Software Details
💾 Data Repositories
🏛️ Research Organizations (ROR)
Affiliated research institutions:
📋 Methods
Mice
All experiments were approved by and performed in accordance with guidelines for maintenance and care of animals of the Canadian Council of Animal Care and Université de Montréal. To express the light-gated ion channel channelrhodopsin-2 in SOM-INs and PV-INs, heterozygous SOM or PV-IRES-Cre-ChR2(H134R)/EYFP mice (SOM or PV-ChR2/EYFP) were obtained by crossing SOM-IRES-Cre mice (kindly provided by Z.J. Huang—Cold Spring Harbor Laboratory, Cold Spring Harbor, NY; JAX no. 013044) 36 or Pvalb tm1(cre)Arbr (PV-Cre; Jackson Labs; JAX no. 008069) with ChR2(H134R)/EYFP Ai32 mice (Jackson Labs; JAX no. 012569). Experiments were performed on 1–2 months old mice of either sex.
Slice preparation
Transverse hippocampal slices were obtained from 4 to 8-week-old SOM-ChR2/EYFP or PV-ChR2/EYFP mice 36 . Animals were anesthetized with isoflurane and the brain was rapidly excised and placed in ice-cold choline-based cutting solution saturated with 95% O 2 and 5% CO 2 containing the following (in m m ): 120 choline chloride, 3 KCl, 1.25 NaH 2 PO 4 , 26 NaHCO 3 , 8 MgCl 2 , 20 glucose, pH 7.4 and 295 mOsmol. A block of brain tissue containing the hippocampus was prepared and transverse hippocampal slices (300 μm thick) were cut on a vibratome (Leica VT1000S, Nussloch, Germany). Slices were transferred to oxygenated artificial CSF (ACSF) at 33 ± 0.5 °C containing the following (in m m ): 130 NaCl, 2.5 KCl, 1.25 NaH 2 PO 4 , 26 NaHCO 3 , 10 glucose, 1.3 MgCl 2 , 2 CaCl 2 , pH 7.3–7.4, and 305–310 mOsmol, and allowed to recover for at least 1 h before being placed in oxygenated ACSF at room temperature (RT). For experiments, the slices were transferred to a recording chamber where they were perfused (2.5 ml/min) with ACSF at 32–34 °C for the course of the experiment. The NMDA receptor antagonist AP-5 (20 μM) and the AMPA and Kainate receptor antagonist NBQX (10 μM) were present in the superfusate of all experiments. Slices were used for a maximum of 6 h after cutting. Cell identification CA1 pyramidal cells, astrocytes and SOM-INs and PV-INs were identified using an infrared camera (70 series; Dage-MTI, Michigan City, IN) mounted on an Zeiss LSM 510 confocal laser scanning microscope installed on a Zeiss Axioskop FS Upright Microscope (Carl Zeiss, Kirkland, Québec, Canada) and equipped with a 40× water immersion long-working distance objective (0.8 n.a.). CA1 pyramidal cells were visually identified based on their soma location and triangular shape. Astrocytes in the stratum radiatum (s.r.) were identified by their specific labeling with sulforhodamine 101 red fluorescent dye (SR101, 0.25 μM) 37 , 38 . Preliminary experiments showed that SR101 did not affect PC membrane properties and spontaneous IPSC frequency and amplitude (Supplementary Fig. 2c ), unlike previously suggested for EPSCs 39 . SOM-INs and PV-INs expressing ChR2 were identified by specific EYFP fluorescence and soma location in CA1 stratum oriens or near stratum pyramidale respectively 25 , 28 – 32 .
Show full methods section
Mice
All experiments were approved by and performed in accordance with guidelines for maintenance and care of animals of the Canadian Council of Animal Care and Université de Montréal. To express the light-gated ion channel channelrhodopsin-2 in SOM-INs and PV-INs, heterozygous SOM or PV-IRES-Cre-ChR2(H134R)/EYFP mice (SOM or PV-ChR2/EYFP) were obtained by crossing SOM-IRES-Cre mice (kindly provided by Z.J. Huang—Cold Spring Harbor Laboratory, Cold Spring Harbor, NY; JAX no. 013044) 36 or Pvalb tm1(cre)Arbr (PV-Cre; Jackson Labs; JAX no. 008069) with ChR2(H134R)/EYFP Ai32 mice (Jackson Labs; JAX no. 012569). Experiments were performed on 1–2 months old mice of either sex.
Slice preparation
Transverse hippocampal slices were obtained from 4 to 8-week-old SOM-ChR2/EYFP or PV-ChR2/EYFP mice 36 . Animals were anesthetized with isoflurane and the brain was rapidly excised and placed in ice-cold choline-based cutting solution saturated with 95% O 2 and 5% CO 2 containing the following (in m m ): 120 choline chloride, 3 KCl, 1.25 NaH 2 PO 4 , 26 NaHCO 3 , 8 MgCl 2 , 20 glucose, pH 7.4 and 295 mOsmol. A block of brain tissue containing the hippocampus was prepared and transverse hippocampal slices (300 μm thick) were cut on a vibratome (Leica VT1000S, Nussloch, Germany). Slices were transferred to oxygenated artificial CSF (ACSF) at 33 ± 0.5 °C containing the following (in m m ): 130 NaCl, 2.5 KCl, 1.25 NaH 2 PO 4 , 26 NaHCO 3 , 10 glucose, 1.3 MgCl 2 , 2 CaCl 2 , pH 7.3–7.4, and 305–310 mOsmol, and allowed to recover for at least 1 h before being placed in oxygenated ACSF at room temperature (RT). For experiments, the slices were transferred to a recording chamber where they were perfused (2.5 ml/min) with ACSF at 32–34 °C for the course of the experiment. The NMDA receptor antagonist AP-5 (20 μM) and the AMPA and Kainate receptor antagonist NBQX (10 μM) were present in the superfusate of all experiments. Slices were used for a maximum of 6 h after cutting. Cell identification CA1 pyramidal cells, astrocytes and SOM-INs and PV-INs were identified using an infrared camera (70 series; Dage-MTI, Michigan City, IN) mounted on an Zeiss LSM 510 confocal laser scanning microscope installed on a Zeiss Axioskop FS Upright Microscope (Carl Zeiss, Kirkland, Québec, Canada) and equipped with a 40× water immersion long-working distance objective (0.8 n.a.). CA1 pyramidal cells were visually identified based on their soma location and triangular shape. Astrocytes in the stratum radiatum (s.r.) were identified by their specific labeling with sulforhodamine 101 red fluorescent dye (SR101, 0.25 μM) 37 , 38 . Preliminary experiments showed that SR101 did not affect PC membrane properties and spontaneous IPSC frequency and amplitude (Supplementary Fig. 2c ), unlike previously suggested for EPSCs 39 . SOM-INs and PV-INs expressing ChR2 were identified by specific EYFP fluorescence and soma location in CA1 stratum oriens or near stratum pyramidale respectively 25 , 28 – 32 .
Electrophysiology
Whole-cell voltage-clamp recordings of CA1 pyramidal cells were obtained using borosilicate glass pipettes (3–5 MΩ) filled with intracellular solution containing the following (in m m ): 130 CsCl, 10 NaCl, 10 HEPES, 1 EGTA, 0.1 CaCl 2 , 10 creatine-PO 4 di(tris), 4 ATP-Mg, 0.4 GTP-Na and 5 lidocaine N -ethyl bromide (QX-314; voltage-gated Na + channel blocker) (pH 7.2 adjusted with CsOH; 285–290 mOsmol). Data was acquired using a Multiclamp 700B amplifier (Molecular Devices) and digitized using a Digidata 1320A digitizer and pClamp 10.3 (Molecular Devices). Recordings were low-pass filtered at 2 kHz and digitized at 20 kHz. Series resistance (Rs) was 10–25 MΩ and regularly monitored during experiments. Data were included only if the holding current and Rs were stable (
📊 Figures
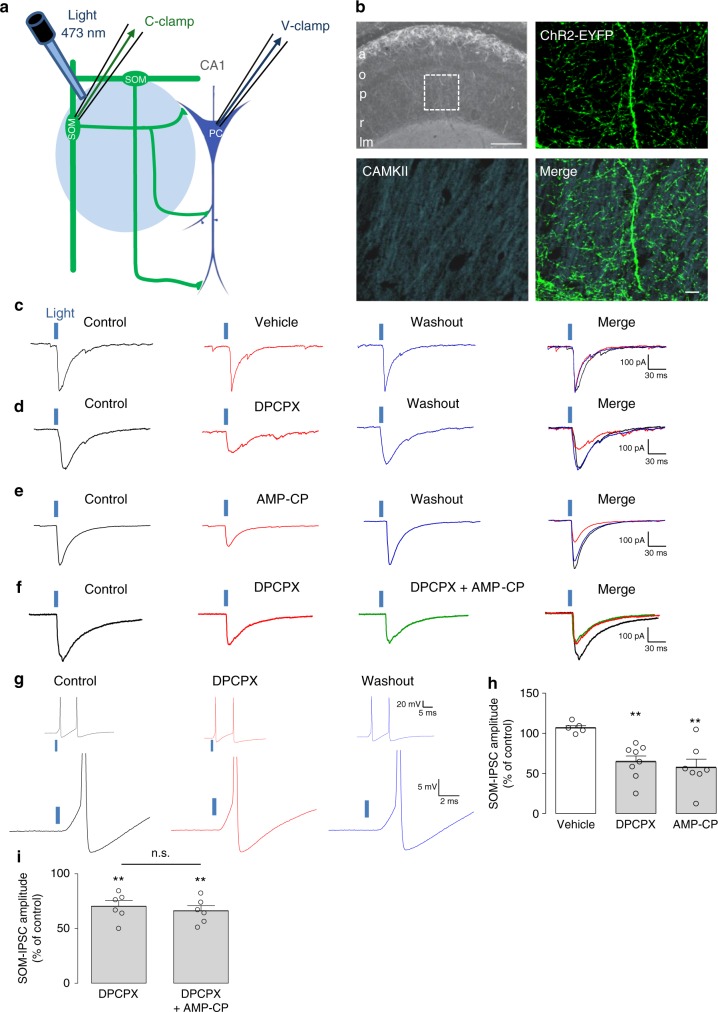
Fig. 1
Endogenous activation of A 1 Rs by adenosine upregulates inhibition evoked in pyramidal cells by SOM-IN optogenetic stimulation. a Diagram of experimental arrangement with optogenetic stimulation of S...
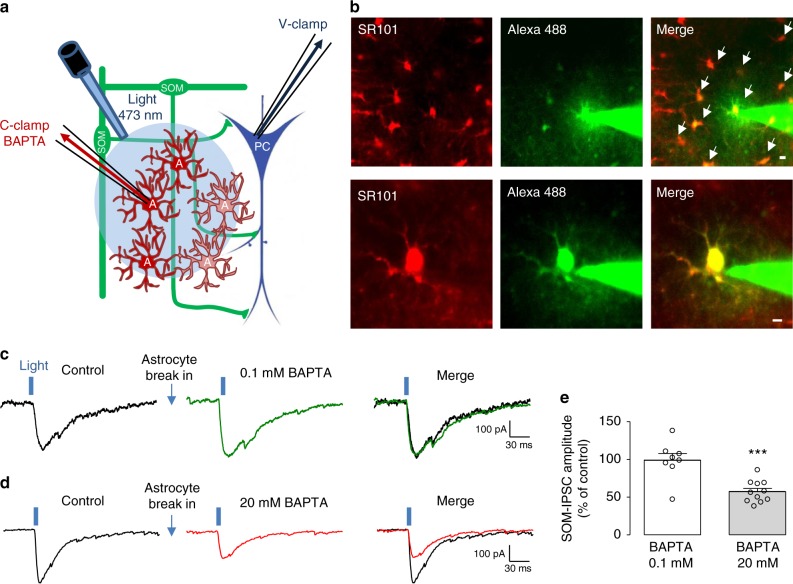
Fig. 2
Blocking astrocyte Ca 2+ reduces pyramidal cell inhibition evoked by SOM-INs. a Diagram of experimental arrangement with optogenetic stimulation of SOM-INs, recording of SOM-IPSCs in pyramidal cells a...
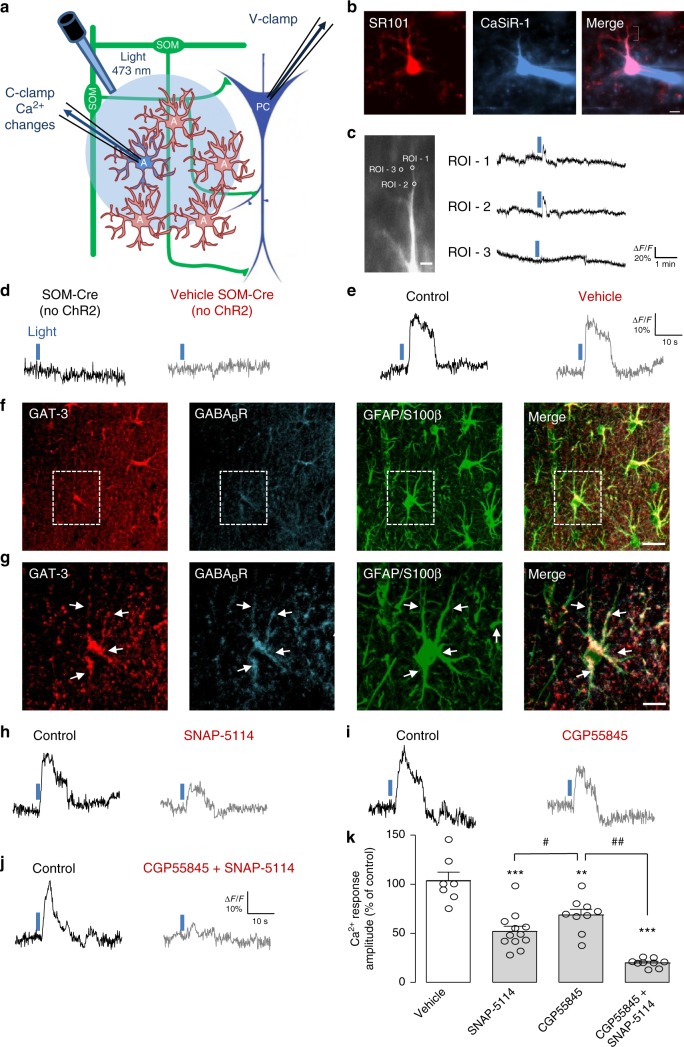
Fig. 3
Ca 2+ responses in astrocytes evoked by SOM-INs are mediated by GAT-3 and GABA B Rs. a Experimental diagram with optogenetic stimulation of SOM-INs and Ca 2+ imaging in astrocytes during whole-cell re...
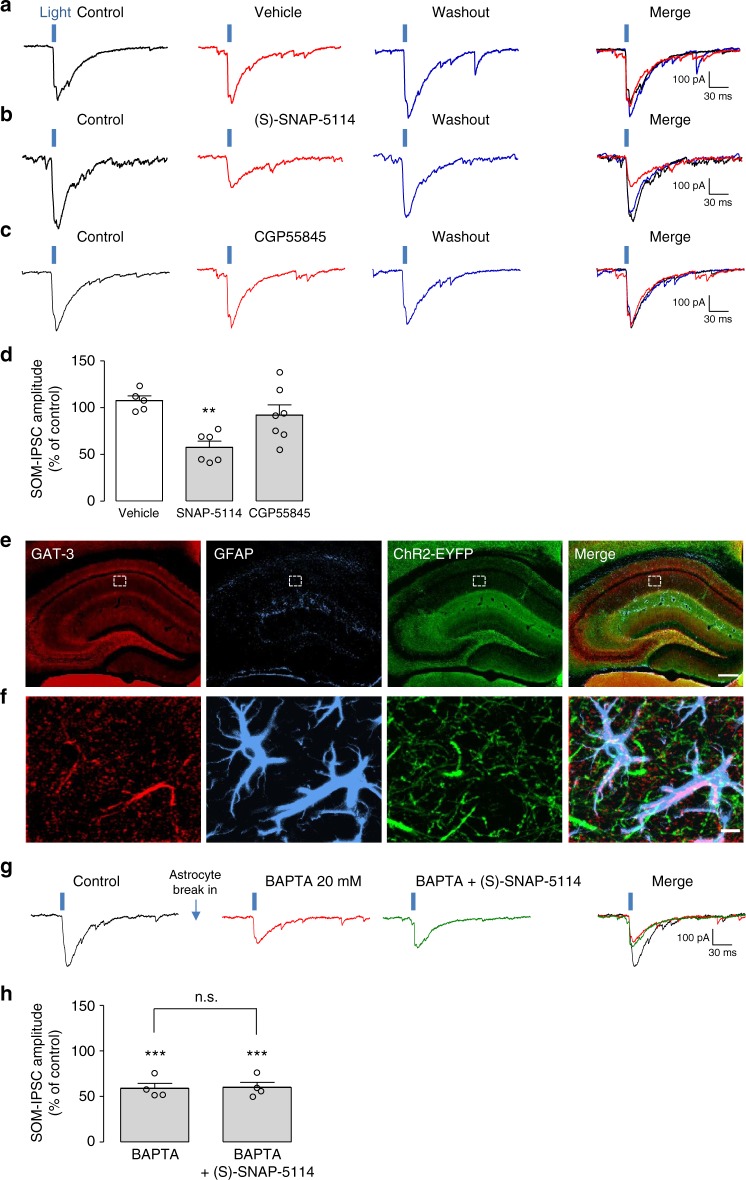
Fig. 4
Endogenous activation of GAT-3, but not GABA B R, upregulates SOM-INs inhibition of pyramidal cells via astrocyte Ca 2+ signaling. a u2013 c Representative traces of SOM-IPSCs from different pyramidal...
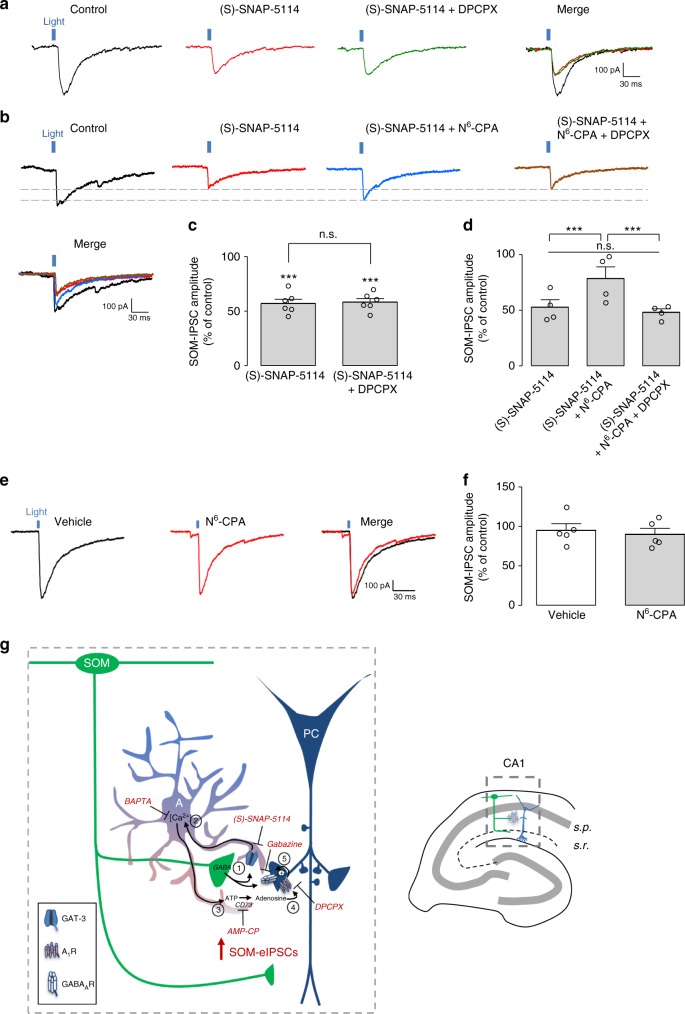
Fig. 5
GAT-3 inhibition prevents A 1 R modulation of pyramidal cell inhibition by SOM-INs. a Representative traces of an occlusion experiment showing that reduction of SOM-IPSCs by (S)-SNAP-5114 (red trace) ...
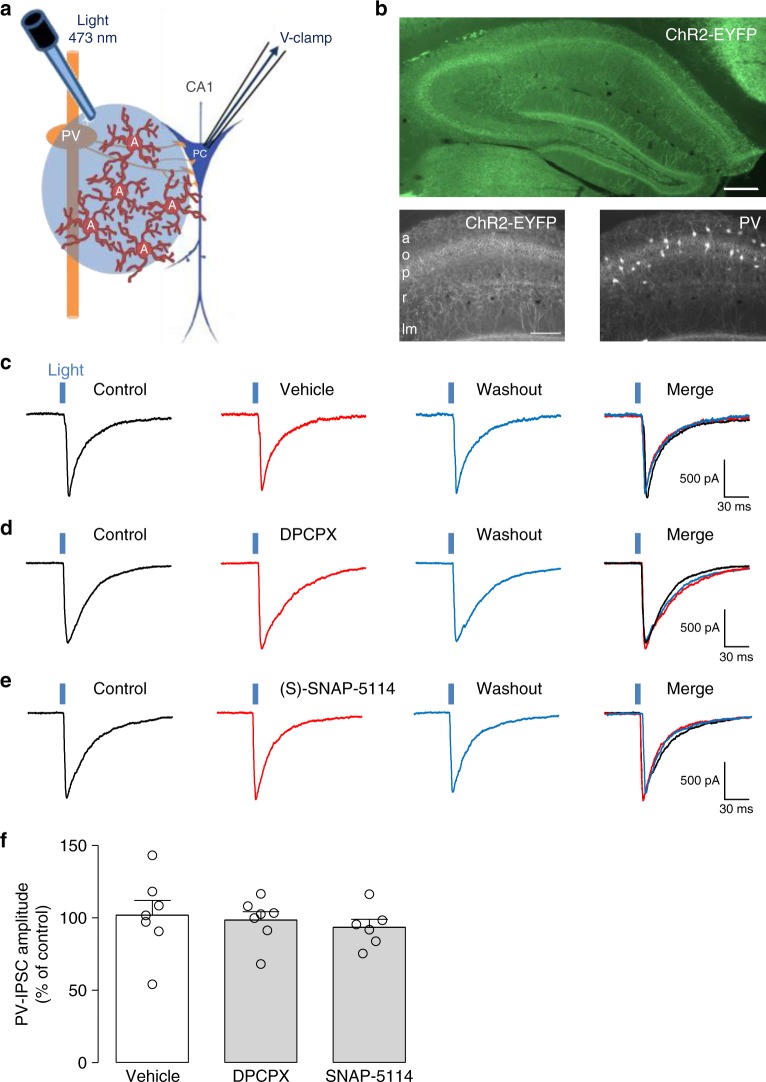
Fig. 6
Endogenous activation of A 1 R and astrocytic GAT-3 do not regulate inhibition of pyramidal cells by PV-INs. a Diagram of experimental arrangement with selective optogenetic stimulation of PV-INs expr...
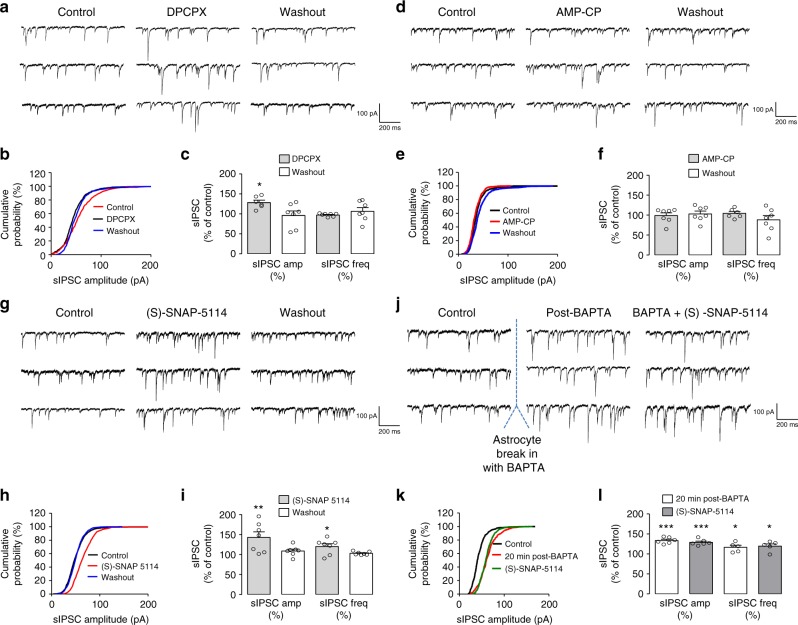
Fig. 7
Distinct modulation of sIPSCs in pyramidal cells by A 1 Rs, GAT-3, and astrocyte Ca 2+ activity. a u2013 c Representative sIPSC traces ( a ), cumulative probability plots ( b ), and summary bar graphs...
Figure images are served from the NIH/NLM PubMed Central Open Access Subset or Europe PMC; copyright remains with the publishers and authors.
💬 Discussion
0 commentsNo comments yet. Be the first to start a discussion!
Leave a Comment