Abstract
Dividing cells reorganize their microtubule cytoskeleton into a bipolar spindle, which moves one set of sister chromatids to each nascent daughter cell. Early spindle assembly models postulated that spindle pole-derived microtubules search the cytoplasmic space until they randomly encounter a kinetochore to form a stable attachment. More recent work uncovered several additional, centrosome-independent microtubule generation pathways, but the contributions of each pathway to spindle assembly have remained unclear. Here, we combined live microscopy and mathematical modeling to show that most microtubules nucleate at noncentrosomal regions in dividing human cells. Using a live-cell probe that selectively labels aged microtubule lattices, we demonstrate that the distribution of growing microtubule plus ends can be almost entirely explained by Augmin-dependent amplification of long-lived microtubule lattices. By ultrafast 3D lattice light-sheet microscopy, we observed that this mechanism results in a strong directional bias of microtubule growth toward individual kinetochores. Our systematic quantification of spindle dynamics reveals highly coordinated microtubule growth during kinetochore fiber assembly.
🔬 Techniques
🔭 Microscopes
🧬 Organisms
✨ Fluorophores
🧪 Sample Preparation
🔬 Cell Lines
🏭 Microscope Brands
🧪 Reagent Suppliers
📷 Detectors
🔎 Objectives
💻 Software Details
💾 Data Repositories
🏛️ Research Organizations (ROR)
Affiliated research institutions:
📋 Methods
Cell lines and cell culture HeLa cell lines stably expressing fluorescent reporter proteins were derived from a HeLa Kyoto line obtained from S. Narumiya (Kyoto University, Kyoto, Japan) and validated by a multiplex human cell line authentication test. The EB3-EGFP/mCherry-CENPA and EGFP-α-tubulin/H2B-mCherry lines were previously reported ( Dick and Gerlich, 2013 ; Cuylen et al., 2016 ) and generated as described in Schmitz and Gerlich (2009) . Briefly, reporter constructs were subcloned into IRESpuro2b or IRESneo3 vectors that allow expression of resistance genes and tagged proteins from a single transcript. The resulting plasmids were transfected into the parental cell lines using X-tremeGENE9 DNA transfection Reagent (Sigma-Aldrich) according to the manufacturer’s instructions. The EB3-tagRFP line was generated by transfecting a plasmid derived from a EB3-EGFP construct reported previously ( Stepanova et al., 2003 ): the EGFP sequence was replaced with tagRFP (FP142; Evrogen) by restriction enzyme cloning. For selection of reporter construct expression, cells were cultured in medium containing 500 µg/ml G418 (11811-031; Thermo Fisher Scientific) and 0.5 µg/ml puromycin (540411; Merck). The RPE1 cell line stably expressing EB3-EGFP and mCherry-CENPA was generated from a parental hTERT-RPE1 line obtained from ATCC using a lentiviral vector system pseudotyped with murine ecotropic envelope that is rodent-restricted (RIEP receptor system), as previously described ( Samwer et al., 2017 ). Briefly, the hTERT-RPE1 cells were first engineered to express RIEP on the cell surface and then infected with virus carrying lentiviral transfer plasmids encoding each of the reporter constructs. The virus were packaged in HEK293T cells transfected using25K linear polyethylenimine (23966-1; Polysciences, Inc.). 48 h after infection, hTERT-RPE1 cells were thoroughly washed with PBS and cultured in DMEM containing 10 µg/ml blasticidin (15205; Sigma-Aldrich) for selection of viral integration. Another 48 h later, the washing step was repeated and cells were FACS sorted for the respective fluorescent marker. HeLa and RPE1 cells were cultured in DMEM (produced in-house at Institute of Molecular Biotechnology of the Austrian Academy of Sciences) supplemented with 10% (vol/vol) FBS (Thermo Fisher Scientific), 1% (vol/vol) penicillin–streptomycin (Sigma-Aldrich), and GlutaMAX (Thermo Fisher Scientific) at 37°C with 5% CO 2 in a humidified incubator. All cell lines used in this study are listed in Table S1 and have been regularly tested negatively for mycoplasma contamination.
Show full methods section
Cell lines and cell culture HeLa cell lines stably expressing fluorescent reporter proteins were derived from a HeLa Kyoto line obtained from S. Narumiya (Kyoto University, Kyoto, Japan) and validated by a multiplex human cell line authentication test. The EB3-EGFP/mCherry-CENPA and EGFP-α-tubulin/H2B-mCherry lines were previously reported ( Dick and Gerlich, 2013 ; Cuylen et al., 2016 ) and generated as described in Schmitz and Gerlich (2009) . Briefly, reporter constructs were subcloned into IRESpuro2b or IRESneo3 vectors that allow expression of resistance genes and tagged proteins from a single transcript. The resulting plasmids were transfected into the parental cell lines using X-tremeGENE9 DNA transfection Reagent (Sigma-Aldrich) according to the manufacturer’s instructions. The EB3-tagRFP line was generated by transfecting a plasmid derived from a EB3-EGFP construct reported previously ( Stepanova et al., 2003 ): the EGFP sequence was replaced with tagRFP (FP142; Evrogen) by restriction enzyme cloning. For selection of reporter construct expression, cells were cultured in medium containing 500 µg/ml G418 (11811-031; Thermo Fisher Scientific) and 0.5 µg/ml puromycin (540411; Merck). The RPE1 cell line stably expressing EB3-EGFP and mCherry-CENPA was generated from a parental hTERT-RPE1 line obtained from ATCC using a lentiviral vector system pseudotyped with murine ecotropic envelope that is rodent-restricted (RIEP receptor system), as previously described ( Samwer et al., 2017 ). Briefly, the hTERT-RPE1 cells were first engineered to express RIEP on the cell surface and then infected with virus carrying lentiviral transfer plasmids encoding each of the reporter constructs. The virus were packaged in HEK293T cells transfected using25K linear polyethylenimine (23966-1; Polysciences, Inc.). 48 h after infection, hTERT-RPE1 cells were thoroughly washed with PBS and cultured in DMEM containing 10 µg/ml blasticidin (15205; Sigma-Aldrich) for selection of viral integration. Another 48 h later, the washing step was repeated and cells were FACS sorted for the respective fluorescent marker. HeLa and RPE1 cells were cultured in DMEM (produced in-house at Institute of Molecular Biotechnology of the Austrian Academy of Sciences) supplemented with 10% (vol/vol) FBS (Thermo Fisher Scientific), 1% (vol/vol) penicillin–streptomycin (Sigma-Aldrich), and GlutaMAX (Thermo Fisher Scientific) at 37°C with 5% CO 2 in a humidified incubator. All cell lines used in this study are listed in Table S1 and have been regularly tested negatively for mycoplasma contamination.
Plasmids
We aimed to use minimally tagged HAUS6 variants. To monitor expression levels via EGFP, we designed plasmids containing the P2A sequence (2A peptide from porcine teschovirus-1 polyprotein; Szymczak et al., 2004 ). The ribosome fails to insert a peptide bond at the two last amino acids of the P2A sequence, yielding two separate polypeptides from a single mRNA. To generate EGFP-P2A-HAUS6, a HAUS6 cDNA clone was obtained from the PlasmID Repository (pCR-BluntII-TOPO_HAUS6; see Table S1 for details) and amplified by PCR with the following primers: 5′-AAGAGAATCCTGGACCGACCGGTATGAGCTCGGCCTCG-3′ (forward) and 5′-CTGGATCGGAATTCGGATCCTCATCTTGTCAAGTCAGACG-3′ (reverse). Alternatively, to generate the EGFP-P2A control construct, amplification with the forward primer 5′-AAGAGAATCCTGGACCGACCGGTATGAGCTCGGCCTCGGTCACC-3′ was used to introduce a stop codon two amino acids downstream of the start methionine of HAUS6. The amplified sequences were inserted via Gibson Assembly (New England Biolabs) into a previously described EGFP-P2A-BAF_IRES_Blast construct ( Samwer et al., 2017 ), replacing the BAF gene. To generate an siRNA-resistant HAUS6 variant, we introduced five mismatches in the siRNA target region without changing the amino-acid sequence (see Fig. S4 F for sequence details). The mutated gene region was produced by gene synthesis (gBlocks; Integrated DNA Technologies) and swapped into the EGFP-P2A-HAUS6 plasmid described above by Gibson assembly. All plasmids were verified by DNA sequencing and will be distributed via the Addgene repository ( http://www.addgene.org ). For the RNAi phenotype complementation experiments, the EGFP-P2A-HAUS6* and EGFP-P2A–encoding plasmids were delivered to EB3-tagRFP–expressing cells 24 h after siRNA transfection (see below). In each reaction, 200 ng plasmid was transfected using X-tremeGENE9 DNA transfection Reagent (Roche) according to the manufacturer’s instructions. siRNA transfection siRNAs (see Table S1) were delivered at a final concentration of 20 nM using Lipofectamine RNAiMAX (Thermo Fisher Scientific). 6.8 pmol siRNA was dissolved in 20 µl OptiMEM; 2 µl RNAiMAX was diluted in 20 µl OptiMEM. Both solutions were combined, mixed by pipetting, and incubated for 20–30 min. Cells were harvested by trypsinization, resuspended in fresh DMEM medium, and seeded onto LabTek II chambered coverglass (Thermo Fisher Scientific). 2 × 10 4 HeLa cells or 3 × 10 4 RPE1 cells were seeded per well in 300 µl DMEM medium. 40 µl of the above transfection mix was added dropwise to the cells directly after seeding. Cells were analyzed 48 h later by confocal live-cell microscopy (or lysed for quantification of protein levels). Alternatively, cells were harvested by trypsinization 24 h after siRNA transfection and then seeded onto precleaned 5-mm coverslips for analysis by lattice light-sheet microscopy 24 h later.
Immunoblotting
Where quantification of protein levels by immunoblotting was preformed, samples were prepared in parallel as those meant for live-cell imaging. All steps were done at RT. HeLa cells treated as above were lysed in 1× SDS loading buffer 48 h after siRNA transfection. Samples were separated by Novex NuPAGE SDS-PAGE system (Thermo Fisher Scientific) using 4–12% BisTris 1.5-mm gels in MES running buffer, according to the manufacturer’s instructions. Proteins were transferred to a nitrocellulose membrane (Protran BA 83; Sigma-Aldrich) by semidry blotting in a Trans-Blot SD Cell (Bio-Rad). Membranes were blocked in 5% (wt/vol) milk powder + 0.02% NP-40 in TBS (blocking solution) for 30 min, then incubated for 1.5 h with the primary antibodies diluted in blocking solution at the concentrations indicated in Table S1. Membranes were washed three times in blocking solution (sequentially for 5, 10, and 10 min), then incubated for 1.5 h with species-specific secondary antibodies coupled to HRP at the concentrations indicated in Table S1. Membranes were washed three times in blocking solution for 5 min and then three more times in 0.02% NP-40 in TBS (sequentially for 5, 10, and 10 min). Finally, membranes were rinsed once with ddH 2 O and incubated for 5 min in ECL Plus Western Blotting Substrate (Thermo Fisher Scientific). Chemiluminescence was documented on a ChemiDoc MP (Bio-Rad) system. All immunoblots were recorded with no saturated pixels.
Immunofluorescence HeLa Kyoto
WT cells were cultured as described above. All subsequent steps were done at RT, unless otherwise stated. See Table S1 for antibody dilutions used. Cells were fixed for 6 min in −20°C methanol and then washed three times with PBS supplemented with Tween 80 (PBST), each for 5 min. Samples were blocked with 10% fetal calf serum in PBST (blocking solution) for 30 min and then incubated with the primary antibody in blocking solution for 14 h, at 4°C. Samples were washed two times with PBST, each for 10 min, and then incubated with the respective secondary antibody in blocking solution for 3 h. Samples were washed for 10 min in PBS (repeated three times) and then imaged on a spinning-disk confocal microscope (UltraView VoX; PerkinElmer) controlled by Volocity software, with a 100×/1.45 NA oil objective. Two 3D volumes were sequentially acquired by illuminating with 488-nm and 561-nm lasers.
Confocal live-cell microscopy
Cells were imaged on LabTek II chambered coverglass (Thermo Fisher Scientific) in DMEM containing 10% (vol/vol) FBS and 1% (vol/vol) penicillin–streptomycin, but without phenol red and riboflavin to reduce autofluorescence ( Samwer et al., 2017 ). Where indicated, the imaging medium additionally contained 50 nM SiR-Hoechst or 50–100 nM SiR-tubulin (as specified in the respective figure legends), and cells were preincubated in it for >2 h. Cells were maintained at 37°C in a humidified atmosphere of 5% CO 2 , provided by incubation chambers (European Molecular Biology Laboratory) installed on every microscope used. To study the spatial distributions of EB3-EGFP–labeled MT plus ends, α-tubulin–labeled MTs, and SiR-tubulin–stained MTs, fast time-lapse imaging was performed on a spinning-disk confocal microscope (UltraView VoX) controlled by Volocity software with a 100x/1.45 NA oil objective. Images were recorded with a Hamamatsu EMCCD 9100–13 camera. Single z-sections were acquired at 1–2 s/frame for a total of 30 s to 1 min (as indicated in the respective figure legends). To investigate the timing of SiR-tubulin binding to growing MT lattices, cells stably expressing EGFP-α-tubulin were imaged on a Zeiss LSM880 AxioObserver scanning confocal microscope equipped with an Airyscan detector and controlled by ZEN 2011 software, with a Plan-Apochromat 63×/1.4 NA oil objective (Zeiss). Single z-sections were acquired at 1 s/frame, for a total of 2 min, in superresolution mode. To quantify Mad2 levels at KTs, cells were imaged on a Zeiss LSM780 AxioObserver scanning confocal microscope controlled by ZEN 2011 software, with a Plan-Apochromat 63×/1.4 NA oil objective. Cells were found in prophase, based on the morphology of SiR-Hoechst stained chromosomes, and their progression through mitosis monitored. Two 3D volumes (7 z-sections, 3 µm total thickness) of EGFP-Mad2 and mCherry-CENPA were acquired 15 min after nuclear envelope disassembly by sequentially illuminating each scanned line with 488-nm and 561-nm lasers.
Lattice light-sheet microscopy
Cells were grown on precleaned 5-mm coverslips and maintained in DMEM containing 10% (vol/vol) FBS and 1% (vol/vol) penicillin–streptomycin, but without phenol red, at 37°C. Lattice light sheet microscopy was performed on the instrument described previously ( Chen et al., 2014 ). Briefly, the coverslips were mounted on the microscope in CO 2 -independent L15 medium containing 10% FBS, without phenol red, and maintained at 37°C for the duration of the experiment. In experiments where unperturbed cells were imaged ( Figs. 1 , 5 , and 6 ), we first identified prophase cells based on increased EB3-EGFP density around asters; the exclusion of soluble EB3-EGFP from nuclear areas indicated that the nuclear envelope was still intact. Using widefield time-lapse microscopy, we monitored mitotic progression for every cell. We recorded the onset of prometaphase, defined by the influx of cytoplasmic EB3-EGFP into the nucleus due to nuclear envelope disassembly. We then switched to fast 3D lattice light-sheet imaging, performed using a 15-µm-long square excitation lattice pattern of outer NA equal to 0.50 and inner NA equal to 0.42. For each cell, 3D two color volumes of EB3-EGFP and mCherry-CENPA were acquired by sequentially illuminating each plane with 488-nm and 560-nm lasers. 75–150 time points were acquired at a volumetric imaging rate of 1 Hz. After imaging, 44 of 45 cells subsequently entered anaphase, indicating minimal phototoxicity. For analysis of HAUS6-depleted spindles ( Fig. 2 ), we identified metaphase cells based on spindle morphology and KT congression to the equatorial plane. 3D lattice light-sheet imaging was performed using an excitation pattern of outer NA equal to 0.55 and inner NA equal to 0.44. For each cell, 3D two color volumes of EB3-EGFP and mCherry-CENPA were acquired by sequentially illuminating each plane with 488-nm and 589-nm lasers. 150 time points were acquired at a volumetric imaging rate of 1 Hz. All images were recorded with an Orca Flash 4.0 v2 sCMOS camera (C11440-22C; Hamamatsu). Images were acquired in sample-scan imaging mode with a lateral translation of 0.4 µm and subsequently deskewed in postprocessing, as described in detail previously ( Chen et al., 2014 ). Final voxel dimensions for all lattice light-sheet image datasets were 104 nm × 104 nm × 210–217 nm. The microscope was controlled by custom-made software.
Processing and analysis of confocal microscopy images Spindle registration
Wherever confocal time-lapse videos were recorded for analysis of the average spatial distribution of fluorescent markers in the metaphase spindle, the video frames were first registered using the MultiStackReg Fiji plugin ( Thévenaz et al., 1998 ) to correct for translation and rotation of the spindle (rigid body transformation). See Video 3 for an example. Registration of EB3-EGFP videos was first performed on filtered images (Gaussian blur: σ = 5 pixels) to make sure individual plus ends did not impact the transformation. If EB3-EGFP videos were collected, then registration was performed on them and the transformation matrices obtained subsequently applied to unfiltered images of all channels. Where EB3 was not imaged ( Fig. 3, D–F ; and Fig. S5 A), registration was based on the EGFP-α-tubulin instead.
Fluorescence intensity profiles from the spindle pole
To study the spatial distribution of fluorescent markers in spindles imaged by live-cell microscopy, we quantified the respective fluorescence intensities in average temporal projections of the registered time-lapse videos. Only cells that had both poles in the same focal plane were imaged. To study the distribution of acetylated tubulin and HAUS6 in immunofluorescence images, we quantified fluorescence intensities in the central plane of suitably oriented spindles, with both poles in focus. We analyzed the distribution of fluorescence intensity in a polar coordinate system centered on one of the spindle poles ( d = 0). The reference axis is a manually drawn line extending toward the second pole. The fluorescence intensity was measured along a series of circumferential line profiles (radius increment of 1 pixel = 130 nm) placed between the first spindle pole and the cell equator. The mean and total intensities measured within the inner one-third (interpolar) section of the profiles were normalized to the cytoplasm of individual cells and then to the mean value measured at d = 520 nm (or 4 pixels), taken as the rim of the centrosome. Fraction of MT plus ends not attributable to the pole The number of MT plus ends in imaged spindles could not be directly measured by detection of individual EB3-EGFP spots, as detection accuracy was limited by spot density and unreliable in pole-proximal regions of the metaphase spindle. Therefore, we inferred the relative number of MT plus ends from the mean EB3-EGFP fluorescence intensity I , measured as a function of distance from the pole ( d ), as described above. The measured curves should reflect the distribution of plus end density D along the spindle axis: D ( d ) D ( r i m ) ≈ I ( d ) I ( r i m ) . The spherical geometry of centrosomal MT growth predicts that MT plus end density decreases by the inverse of the squared distance from the origin ( d = rim ). Thus, the relative number of plus ends N is given by N ( d ) ≈ N ( r i m ) × I ( d ) I ( r i m ) × d 2 r i m 2 . The probability that a dynamically instable MT nucleated at the centrosome grows to a certain length depends on the catastrophe and growth rescue rates, which are in turn thought to be length dependent ( Foethke et al., 2009 ; Wordeman and Stumpff, 2009 ). If this were the case, then the number of MT plus ends growing from centrosomes is expected to decrease exponentially as a function of distance from the pole. If the number of growing MT plus ends at the centrosome rim is N ( rim ), then the number expected at any given distance d is N p r e d i c t e d ( d ) = N ( r i m ) × e − ( d − r i m ) / λ . The characteristic MT length λ is itself a function of the parameters describing the dynamic instability behavior, namely, the frequencies of catastrophe ( f cat ) and rescue ( f res ) over time: λ = v g r o w t h × v s h r i n k f c a t v s h r i n k − f r e s v g r o w t h , where v growth and v shrink are the growth and shrinkage rates of dynamic MTs ( Verde et al., 1992 ). The decay constant k that governs the distribution of plus end number is 1/λ. We calculated a decay constant k of 0.08 µm −1 based on catastrophe and rescue frequencies measured in the outer spindle regions of LLCPK-1α cells ( Rusan et al., 2001 ). At any given distance d , the fraction of plus ends that cannot be explained by this model of dynamic instability is thus: N ( d ) − N p r e d i c t e d ( d ) N ( d ) = 1 − r i m 2 . I ( r i m ) d 2 . I ( d ) × e − 0.08 × ( d − r i m ) . EB3-EGFP and SiR-Hoechst intensities from the metaphase plate The fluorescence intensities were measured in average temporal projections of registered time-lapse videos and normalized to the cytoplasm of individual cells. Mean intensity profiles were taken along a 10-pixel-thick line connecting the center of the spindle (i.e., the midpoint of the interpolar axis) to one of the poles. Measurements were then taken along a line of the same length and thickness, also parallel to the interpolar axis, displaced sideways to the spindle periphery. Both profiles were normalized to the mean of the first five values measured inside the spindle body. EB3-EGFP intensity along pole–KT trajectories To minimize distortions caused by KT motion, we quantified EB3-EGFP fluorescence in projections of 6-s intervals of our registered videos. Maximum-intensity projections were generated for three sequential frames using the Running ZProjector Fiji plugin. In selected frames of the projections, 5-pixel-wide segmented lines were drawn, connecting selected KT pairs to one of the spindle poles ( Fig. 1 F ). To avoid measurement artifacts resulting from the periodic KT oscillations, CENPA loci that showed little motion blur were selected; the drawn lines were typically curved, following the natural curvature of k-fibers. The fluorescence intensities measured along the lines were normalized to the cytoplasm of individual cells in all three imaged channels. All profiles were aligned to the midpoint between the two sister KTs, identified as local maxima in the mCherry-CENPA profile. Fluorescence intensities were normalized to the average values measured in a 5-pixel-wide window around the last local maxima, i.e., the KT closest to the spindle pole. Models of MT amplification At any given distance from the spindle pole ( d ), the total number of MT plus ends attributable to centrosomal activity is predicted to be N ( r i m ) × e − k ( d − r i m ) , where rim is the estimated radius of the centrosome. Due to the spherical geometry of centrosomal MT arrays, a decreasing fraction of these plus ends is visible in the thin optical planes we analyze: N c ( d ) = r i m d × N ( r i m ) × e − k ( d − r i m ) . Our models add to this array of centrosome-generated plus ends those expected to result from MT branching, i.e., de novo generation on the lattices of preexisting MTs, N b : N p r e d i c t e d ( d ) = N c ( d ) + N b ( d ) . While the component N c ( d ) is solely a function of the number of MT plus ends generated at the spindle poles (and directly inferred from the mean EB3-EGFP fluorescence measured at d = rim ), N b (d) will depend on the frequency of MT plus end generation across the entire spindle. It has been proposed that the activity of MT nucleation factors can be spatially modulated by chromatin-generated molecular gradients. Notably, the RanGTP effector TPX2 has been shown to stimulate Augmin-mediated MT branching in vitro ( Petry et al., 2013 ). By interacting with preexisting MTs, Ran-activated factors like TPX2 can reach high concentrations in the main body of human mitotic spindles ( Oh et al., 2016 ). However, it remains unclear whether TPX2 activity varies significantly within the spindle body and how acentrosomal MT nucleation rates may vary as a result. The concentration gradients of both RanGTP and TPX2 appear rather diffuse, reaching all the way from chromosomes to the spindle poles ( Kalab et al., 2006 ; Oh et al., 2016 ). In summary, there is currently no evidence of a differential in acentrosomal nucleation activity along the axis of human mitotic spindles. Hence, for simplicity, we assumed in our model that the MT branching frequency Bra is not spatially modulated, not depending on distance from the pole but only on the local abundance of branching factors. In our static model of MT amplification ( Fig. 4 and respective supplemental panels), we estimate steady-state template distributions by quantifying either EGFP-α-tubulin or SiR-tubulin fluorescence in metaphase cells. We then assume that the branching factors continuously redistribute across template MTs to drive local generation of MT plus ends. The local branching activity Bra ( d ) is then a linear function of the template distribution Template ( d ), depending only on the total amount of branching factors available ( Aug ): B r a ( d ) = T e m p l a t e ( d ) × A u g Σ d ∈ [ 0 , D ] d T e m p l a t e ( d ) . It is crucial to consider not only Bra ( d ), the plus ends generated at d in any given instant of time, but also the plus ends that were generated in preceding instants (at all distances from the pole a , a ∈ [ rim, d ]) and grew to reach d in the intervening time. Since Augmin is known to nucleate MTs at shallow angles, with the same polarity as the parent lattices ( Kamasaki et al., 2013 ; Petry et al., 2013 ), we assumed that plus ends generated by branching share the directionality of the template network, their angle to the centrosome remaining constant. Further, we assumed that their growth is governed by the same dynamic instability parameters as centrosomal MTs. The probability that a MT generated by branching at d = a reaches any given distance from pole is thus p ( d ) = e − k × ( d − a ) , where k is the decay constant that depends on catastrophe and rescue rates. The total number or plus ends generated by branching is given by N b ( d ) = Σ a ∈ ] r i m , d ] a B r a ( a ) × e − k × ( d − a ) . The two components combine to generate a total number of plus ends given by N p r e d i c t e d ( d ) = r i m d × N ( r i m ) × e − k ( d − r i m ) + Σ a ∈ ] r i m , d ] a B r a ( a ) × e − k ( d − a ) . Since we do not know how the measured fluorescence units relate to MT number, both Template ( d ) and Bra ( d ) are unitless. Consequently, the amount of branching factors Aug is also an abstract quantity and the one free parameter in the model. In every simulation, we predicted plus end distributions for a range of Aug values (0–5 in 0.1 increments) and chose the one that minimized the mean standard error of the estimate ( MSE ; see Fig. S5 D for an example): M S E = Σ d ∈ [ r i m , D ] d [ N ( d ) − N p r e d i c t e d ( d ) ] 2 D − r i m . A Kolmogorov–Smirnov test (nonparametric, not assuming normality) was used to compare the best-fitting predicted distribution with the total EB3-EGFP fluorescence measured in cells. The resulting statistics are given in the respective figure legends. To test whether this model could explain MT plus end distributions in a dynamic steady-state spindle (Fig. S5, I and J), we ran computational simulations that further considered the net poleward flux of spindle MTs, as well as a dynamic binding and unbinding of Augmin to preexisting lattices. We define each MT by the distance of its minus and plus ends to the spindle pole ( d m and d p , respectively). Thus, MTs are here considered to move in one-dimensional space. For simplicity, all MTs are set to move poleward at a constant rate v f = 0.57 µm/min. MT minus ends that reach the pole (d m = 0) start depolymerizing at the same rate. Growing MT plus ends move at a speed of ( v p − v f ), where v p is the polymerization rate; shrinking MT plus ends move at (− v s − v f ), where v s is the depolymerization rate. v p and v s were set to values measured in spindles of LLCPK-1α cells ( Rusan et al., 2001 ): 12.76 and 14.14 µm/min, respectively. Catastrophe and rescue rates were set to 0.058 and 0.045 s −1 , as determined in the same study. MT plus ends are not allowed to grow past the spindle equator (estimated in our cells at d p = 6 µm). As in the static model described above, an Augmin pool of limited size is set to distribute across all available MT lattices. We assume unbound Augmin can bind to any MT, anywhere along the MT lattice ( d p − d m ), at a fixed rate k b . Bound Augmin generates additional MTs at a fixed rate k bra before dissociating from lattices at a rate of k u . The distribution of bound Augmin, Aug b , is thus, at any given time t , A u g b ( d , t ) = ( 1 − k u ) × A u g b ( d + v f , t − 1 ) + k b A u g − ∑ d ∈ [ r i m , D ] d A u g b ( d , t − 1 ) ∑ d ∈ [ r i m , D ] d L a t ( d , t ) , where Lat ( d, t ) is the distribution of MT lattices. In this extended model, the local branching activity Bra is a linear function of Aug b rather than any directly measured template distribution: Bra ( d,t ) = k bra Aug b ( d,t ). In every simulation, we predicted plus end distributions for a range of Aug and k bra values. Because we are interested in steady-state solutions, we chose the one that minimized the mean standard error of the estimate averaged across the last half of the iterations (3.5 min). Both our models were implemented in custom written MATLAB code (available upon request). Described data fitting and statistical testing were also done in MATLAB.
Quantification of SiR-tubulin binding to MT lattices in interphase cells
Instances where an EGFP-α-tubulin–labeled lattice grew into a region of low MT density were identified by visual inspection. Mean EGFP-α-tubulin and SiR-tubulin fluorescence intensities were then measured in rectangular ROIs placed in front of the growth event (each 350 nm in width and 1.4–1.6 µm in length, as depicted in Fig. 3 A ) in each of the subsequent 60 frames. The background fluorescence values measured at t = 0 s (when the lattice has not yet grown into the ROI) was subtracted from each of the two channels, respectively. The profiles were finally normalized to the mean value measured at t > 30 s.
Quantification of Mad2-EGFP intensities on individual KTs Mean
Mad2-EGFP fluorescence intensities were measured in individual optical sections, inside circular ROIs (≈420 nm radius) manually placed on CENPA-positive KTs. For each cell, the median EGFP intensity across all KTs was normalized to the median fluorescence measured in the cytoplasm. All measurements were then normalized to the mean of all control cells. Differences observed were tested for statistical significance not assuming a normal distribution, with a Kolmogorov–Smirnov test, in Prism 7 software.
Analysis of lattice light-sheet microscopy data
The analyses of lattice light-sheet microscopy data were performed with the U-track 3D framework ( Roudot et al., 2017 ) developed in MATLAB (MathWorks). Of a dataset of 65 cells imaged by lattice-light sheet microscopy, 39 contained the entire spindle volume and had sufficiently homogeneous signal-to-background ratio for automated MT plus end detection. These were considered for further analysis. Each video represented 1- to 2-min intervals and together covered mitotic stages from 2 min before nuclear envelope disassembly until 16 min after nuclear envelope disassembly. The automatic analysis pipeline consists of three steps: (1) definition of dynamic ROI (dROI) inside the spindle, (2) MT plus end detection or intensity sampling, and (3) measurement mapping in dROI to interrogate MT plus end statistics and integration across nonsynchronous videos. dROI definition The high concentration of MT plus ends at the spindle pole results in a bright signal that moves with the whole spindle. As such, these large clusters are excellent fiducials to build a dROI for the spindle and associated frame of reference. The spindle poles are detected in a statistical framework that first establishes a set of candidate objects using the size of detected clusters in the 3D volume. A scale map is estimated using 3D Laplacian of Gaussian filtering at multiple scales ( Lindeberg, 1998 ). The scales range from twice the size of a diffraction limited spot (see MT plus end detection) to 2 µm, using steps of 100 nm. The candidate locations are the local maximum across all filtered scales. Those candidate locations are then tracked over time using a Brownian motion prior with a maximal interframe displacement of 1 µm and allowing temporary disappearance of up to one frame ( Jaqaman et al., 2008 ). Each resulting track is then scored according to the product of its lifetime and median intensity. The two best candidates are selected as the spindle poles. KTs are also tracked over time in order to interrogate MT plus end location statistics between the spindle poles and moving KTs. Each KT’s location is estimated using a 3D implementation of an algorithm described previously ( Aguet et al., 2013 ). Sharp transitions in KT motion between pre- and post-MT capture make trajectory estimation difficult with conventional methods. To solve this problem, we applied a recent algorithm for tracking erratic motion via piecewise-stationary motion modeling to each KT trajectory ( Roudot et al., 2017 ). The combination of pole and KT trajectories enables the creation of multiple dROIs and associated frame of reference for quality control in 3D data and statistical analysis.
MT plus end detection
MT plus ends are detected using the centroid of the region masked with an adaptive thresholding algorithm described previously ( Aguet et al., 2013 ). This algorithm requires a single parameter, an estimate of the scale of the diffraction-limited objects. To estimate the scale of a diffraction limited MT plus end, the scale of each object is approximated using the fitting of a 3D Gaussian function and the set of resulting scales is fitted with a Gaussian mixture model. The mode of the resulting distribution is kept as the estimated scale. Quality control was performed by automatic rendering of dROI and detection overlay in MATLAB. All MT plus ends were counted, regardless of their growth direction. 3D measurements of fluorescence intensity in lattice light-sheet microscopy videos Intensity measurements inside the spindle are performed through random sampling inside the 3D ROI with a constant density of 100 loci/µm 3 .
Quantification of MT plus end densities facing KTs and outward
The definition of ROIs “facing KT” and “facing outward” to study MT plus end density at different distances from spindle poles was performed using a collection of cylindrical ROIs between the spindle poles and each KT with a radius of 500 nm. Each KT is associated to only one pole (the closest pole at the end of the trajectory), resulting in two sets of dROIs R 1 ( t ) = { R 1 1 ( t ) , … , R 1 n ( t ) } and R 2 ( t ) = { R 2 1 ( t ) , … , R 2 n ( t ) } . Outward-facing areas are defined through point reflection of each dROI using the spindle pole as a center. Let us denote P the set of labeled plus end and x * the coordinate of plus end in the frame of reference associated to its closest dROI R p * . The histogram of distance from spindle pole of detected MT plus end is defined as C ( d , t ) = ∑ | { x ∈ P ∪ R 1 ( t ) ∪ R 2 ( t ) | x * − d | } < ϵ | , where |.| denotes the set cardinality, d is the polar distance ranging from 2 to 6 µm, and ϵ is a binning parameter set to 150 nm. To make measurement comparable and interpretable, relative frequencies counts rather than probability distributions are shown: N ' ( d , t ) = C ( d , t ) C ( 2 , t ) . Integrating count statistics of multiple ROI also has to take into account the different length of each ROI. To do so, each relative count according to the number of dROI sampling the respective distance was taken into account: N ( d , t ) = N ' ( d , t ) × | { R ( t ) ∈ R 1 ( t ) ∪ R 2 ( t ) } | | { R ( t ) ∈ R 1 ( t ) ∪ R 2 ( t ) l [ R ( t ) ] < d } | , where l [.] denotes the length of the dROI. Quality control for this normalization process was performed on multiple videos presenting stationary metaphase. The same process was performed symmetrically for outward-facing dROIs.
Quantification of MT growth direction relative to the pole–KT axis
To determine the density of MTs growing along the pole–KT axis relative to adjacent regions, KTs were analyzed individually as illustrated in Fig. 6 , using conical dROIs with an angle of 0.5 radian. Let us denote θ p i , the elevation of a MT plus end detected in the dROI R p i . The angle histogram is then defined as A ( θ , t ) = ∑ p ∈ { 1 , 2 } ∑ i ∈ { 1 , ... , n } A p i ( θ , t ) , with A p i ( θ , t ) = | { x ∈ P ∪ R p i ( t ) | θ p i − θ | < ϵ } | . θ ranges from 0 to 0.5 radian and ε is a binning parameter set to 0.025 radian. As MT plus ends can be counted multiple times and the changes in dROI shape over time must be taken into account considering the volume of a 3D cone, let us denote angular histograms normalized as A p i ' ( θ , t ) = A p i ( θ , t ) π l [ R p i ( t ) ] 3 × [ tan ( θ + ϵ 2 ) 2 − tan ( θ − ϵ 2 ) 2 ] . This normalization enables to integrate thousands of dROI across space, time, and acquisitions. The probability distributions, A ( θ , t ), were then computed for different time intervals relative to nuclear envelope disassembly as shown in Fig. 6 .
Data visualization
Data were plotted using GraphPad Prism 7 software. 3D renderings shown in Figs. 1 I , 5 (B and C), and S1 F were generated using Amira (Thermo Fisher Scientific) for visualization purposes only. In Fig. 5 D , the EB3-EGFP signal was deconvolved (Richardson–Lucy deconvolution with a scale of 1.5 and 10 iterations). Online supplemental material Fig. S1 shows validation experiments related to Fig. 1 , including the quantification of MT plus end distributions in metaphase spindles of hTERT-RPE1 cells and the raw MT plus end counts in HeLa cells imaged by 3D lattice light-sheet microscopy. Fig. S2 shows that Katanin depletion does not impact MT plus end distributions. Fig. S3 shows the quantification of Mad2 levels on KTs of Augmin-depleted cells. Fig. S4 contains validation experiments related to Fig. 2 , showing that MT plus end densities are also severely reduced in HAUS6-depleted hTERP-RPE1 cells and HAUS4-depleted HeLa cells; Fig. S4 (F and G) also shows that the Augmin-depletion phenotype can be suppressed by expressing siRNA-resistant HAUS6. Fig. S5 shows the mathematical modeling of plus end generation by amplification of the EGFP-α-tubulin–labeled MT network (A–D). Fig. S5 also shows the distribution of immunostained HAUS6 in metaphase spindles (E and F), and Fig. S5 (G–J) contains additional results for our modeling of age-dependent MT amplification (related to Figs. 3 and 4 ).
Table
S1 lists all the key resources and reagents used in this study. Videos 1 and 2 show growing MT plus ends in live HeLa and hTERT-RPE1 cells (respectively). Video 3 shows another example, meant to illustrate the effect of movie registration. Video 4 shows MTs growing in the presence of SiR-tubulin. Videos 5 and 6 show MT plus ends and KTs in a prometaphase cell imaged by 3D lattice light-sheet microscopy.
Online supplemental material Fig. S1 shows validation experiments related to Fig. 1 , including the quantification of MT plus end distributions in metaphase spindles of hTERT-RPE1 cells and the raw MT plus end counts in HeLa cells imaged by 3D lattice light-sheet microscopy. Fig. S2 shows that Katanin depletion does not impact MT plus end distributions. Fig. S3 shows the quantification of Mad2 levels on KTs of Augmin-depleted cells. Fig. S4 contains validation experiments related to Fig. 2 , showing that MT plus end densities are also severely reduced in HAUS6-depleted hTERP-RPE1 cells and HAUS4-depleted HeLa cells; Fig. S4 (F and G) also shows that the Augmin-depletion phenotype can be suppressed by expressing siRNA-resistant HAUS6. Fig. S5 shows the mathematical modeling of plus end generation by amplification of the EGFP-α-tubulin–labeled MT network (A–D). Fig. S5 also shows the distribution of immunostained HAUS6 in metaphase spindles (E and F), and Fig. S5 (G–J) contains additional results for our modeling of age-dependent MT amplification (related to Figs. 3 and 4 ).
Table
S1 lists all the key resources and reagents used in this study. Videos 1 and 2 show growing MT plus ends in live HeLa and hTERT-RPE1 cells (respectively). Video 3 shows another example, meant to illustrate the effect of movie registration. Video 4 shows MTs growing in the presence of SiR-tubulin. Videos 5 and 6 show MT plus ends and KTs in a prometaphase cell imaged by 3D lattice light-sheet microscopy.
Supplementary Material Supplemental Materials (PDF) Video 1 Video 2 Video 3 Video 4 Video 5 Video 6
📊 Figures
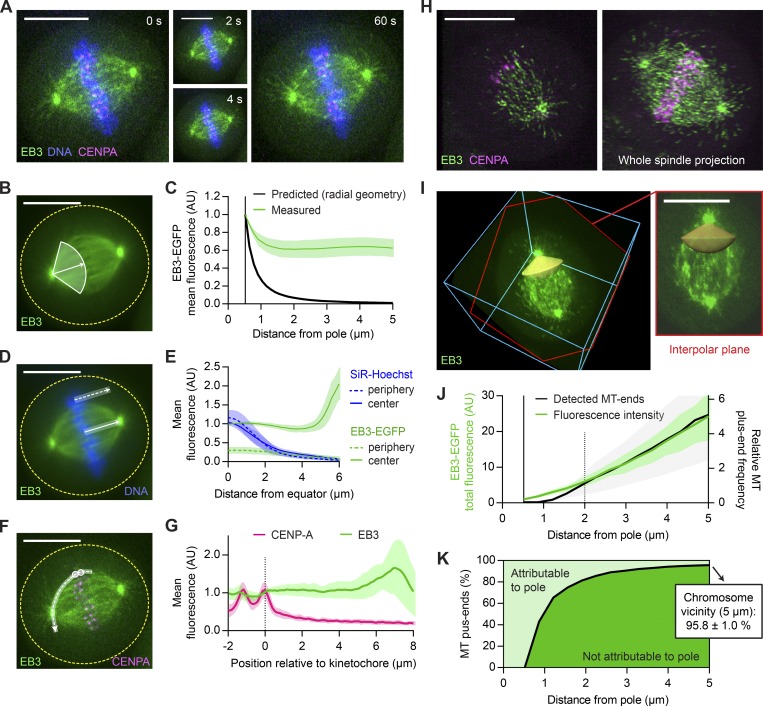
Figure 1.
The majority of MT plus ends that reach metaphase chromosomes do not originate from spindle poles. (Au2013G) Live-cell confocal microscopy of HeLa cells expressing EB3-EGFP (green) and mCherry-CENPA (...
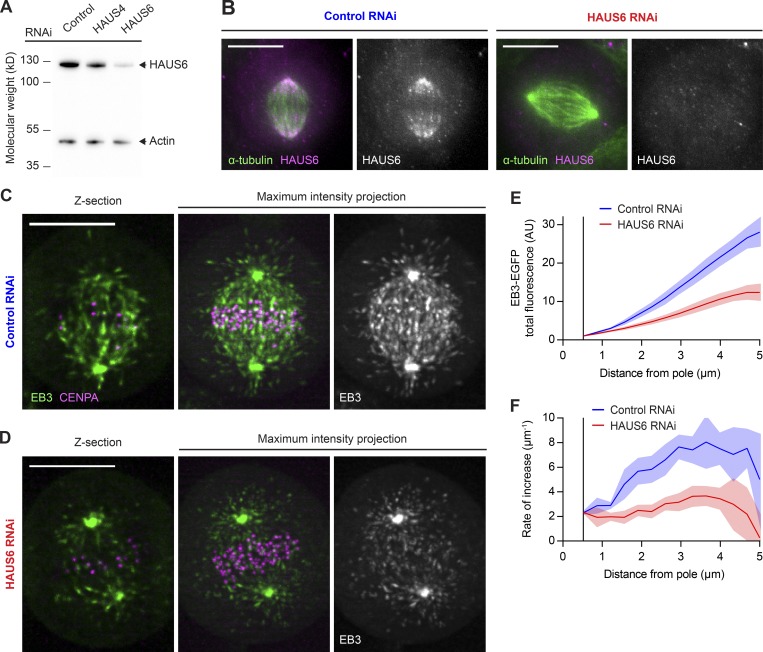
Figure 2.
Most MT plus ends in metaphase spindles are generated in an Augmin-dependent manner. (A) HAUS6 protein levels analyzed by Western blotting in HeLa cells transfected with control, HAUS4-targeting, or H...
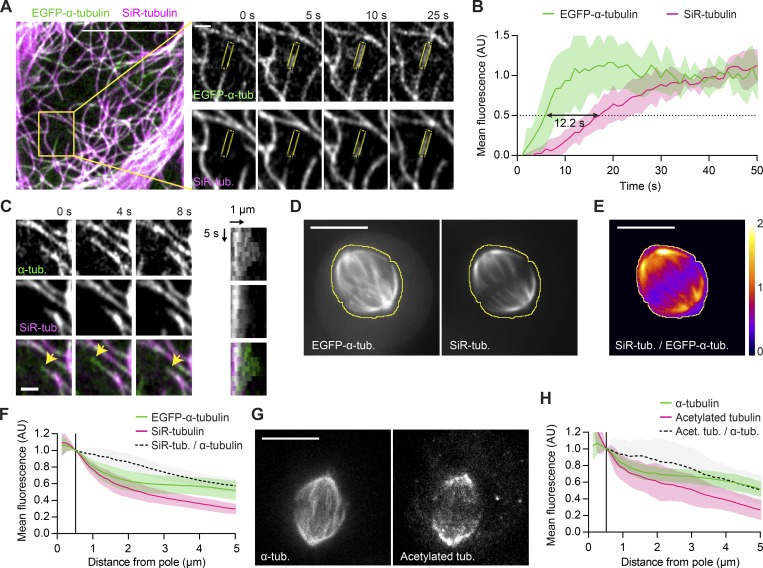
Figure 3.
SiR-tubulin is a live-cell marker for long-lived MT stretches. (A) Live interphase HeLa cell expressing EGFP-u03b1-tubulin incubated with 100 nM SiR-tubulin imaged at 1 s/frame (see Video 4). Insets s...
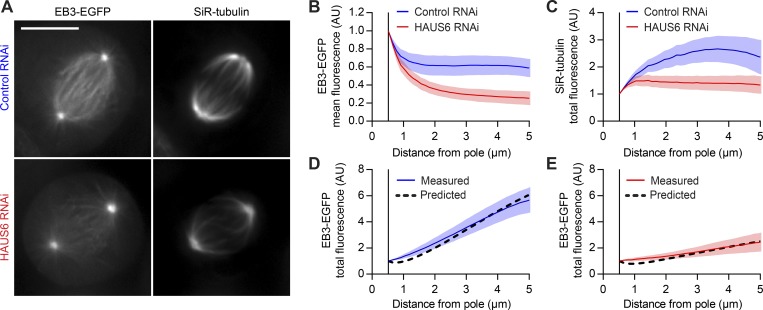
Figure 4.
Augmin-mediated MT amplification explains most of the plus end distribution in the metaphase spindle. (A) EB3-EGFPu2013expressing HeLa cells transfected with either nontargeting (control) or HAUS6-tar...
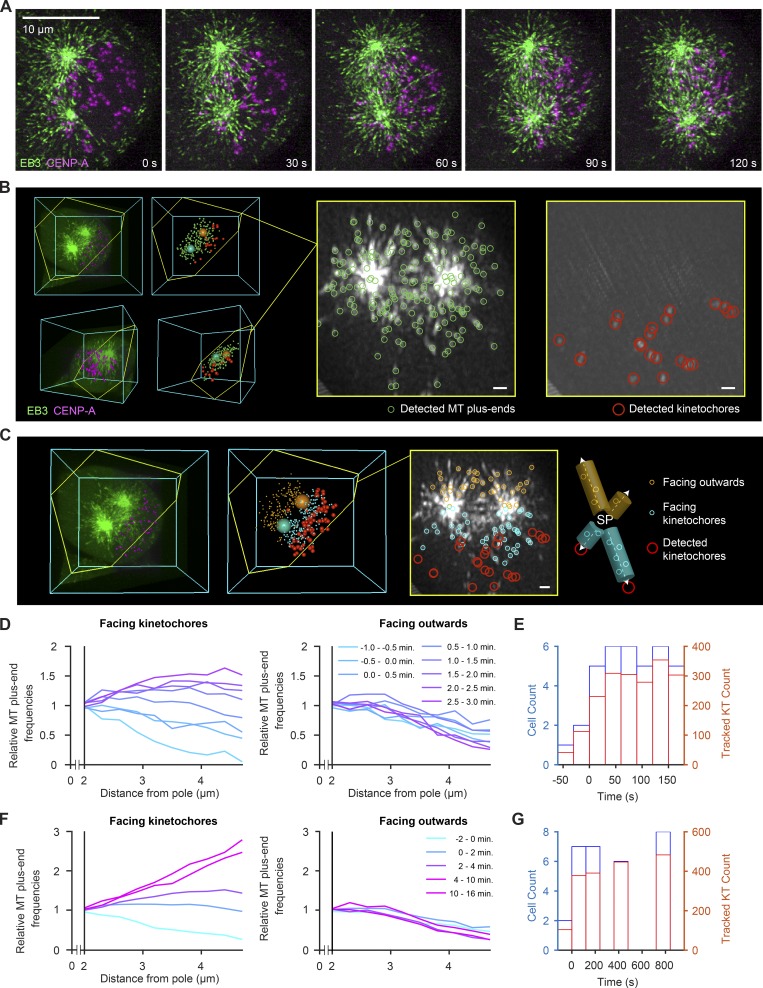
Figure 5.
Noncentrosomal MTs increase in spindle regions facing toward KT already during early prometaphase. (Au2013C) HeLa cell expressing EB3-EGFP (green) and mCherry-CENPA (magenta), imaged during prometapha...
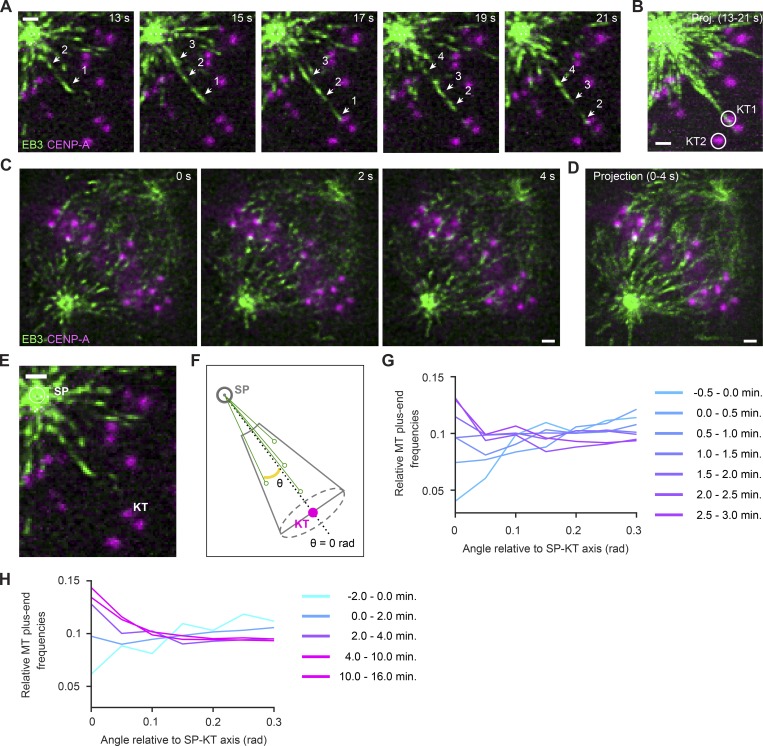
Figure 6.
MT growth direction is highly biased toward KTs. (Au2013E) Lattice light-sheet microscopy of EB3-EGFP and mCherry-CENPAu2013expressing HeLa cells. Scale bars, 1 u00b5m. (A and B) KT-directed MT growth...
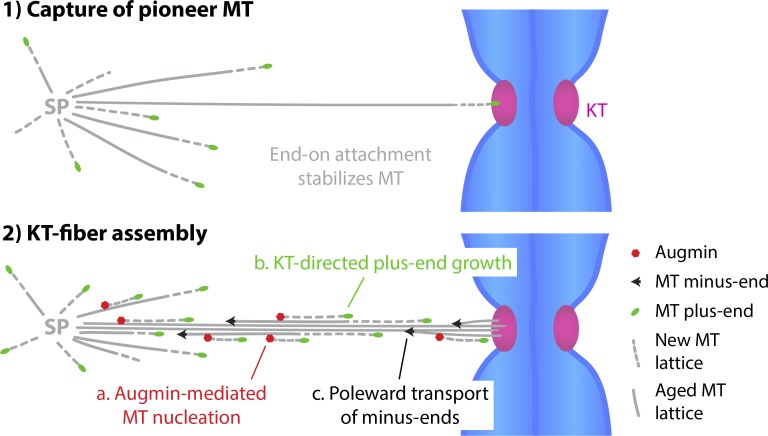
Figure 7.
Model for k-fiber assembly. Once u201cpioneeru201d MTs generated at the spindle poles (SPs) attach to KTs, they become templates for Augmin-mediated amplification. Augmin accumulates on long-lived MT ...
Figure images are served from the NIH/NLM PubMed Central Open Access Subset or Europe PMC; copyright remains with the publishers and authors.
💬 Discussion
0 commentsNo comments yet. Be the first to start a discussion!
Leave a Comment