Abstract
Abstract Understanding the nano-architecture of protein machines in diverse subcellular compartments remains a challenge despite rapid progress in super-resolution microscopy. While single-molecule localization microscopy techniques allow the visualization and identification of cellular structures with near-molecular resolution, multiplex-labeling of tens of target proteins within the same sample has not yet been achieved routinely. However, single sample multiplexing is essential to detect patterns that threaten to get lost in multi-sample averaging. Here, we report maS 3 TORM (multiplexed automated serial staining stochastic optical reconstruction microscopy), a microscopy approach capable of fully automated 3D direct STORM ( d STORM) imaging and solution exchange employing a re-staining protocol to achieve highly multiplexed protein localization within individual biological samples. We demonstrate 3D super-resolution images of 15 targets in single cultured cells and 16 targets in individual neuronal tissue samples with <10 nm localization precision, allowing us to define distinct nano-architectural features of protein distribution within the presynaptic nerve terminal.
🔬 Techniques
🔭 Microscopes
🧬 Organisms
💻 Software
✨ Fluorophores
🧪 Sample Preparation
🔬 Cell Lines
🏭 Microscope Brands
🧪 Reagent Suppliers
📷 Detectors
💻 Software Details
💾 Data Repositories
🏛️ Research Organizations (ROR)
Affiliated research institutions:
📋 Methods
Methods maS 3 TORM setup The custom-built 3D d STORM setup (Supplementary Fig. 1 , parts referenced here as #x and summarized in Supplementary Table 4 ) is equipped with 405 nm (#1; Cube, Coherent), 488 nm (#2; Obis, Coherent), 561 nm (#3; Obis, Coherent), and 661 nm (#4; Cube, Coherent) lasers. For excitation, lasers were focused onto the back focal plane of a ×100 total internal reflection fluorescence objective with a numerical aperture of 1.49 (#9; Olympus). Emission light is collected by a multi-bandpass filter (#8; ZT405/488/561/647rpc, Chroma) and passes a cylindrical lens (#10; Thorlabs) that is used for astigmatism-based 3D imaging. Dual-color d STORM imaging was performed by illumination with the 661 nm laser. Light emitted from the sample was filtered through the 700/75 ET bandpass filter, split into two beams by a custom-built dichroic filter (#13; 690 nm, Chroma), and focused onto the EMCCD camera (#15; iXon Ultra 897, Andor) with each channel occupying one half of the camera chip. The z -focus was stabilized by a feedback loop. The beam of an infrared diode (#16; 785 nm, Thorlabs) is reflected at the edge of the cover glass surface and the sample medium and projected onto a quadrant photodiode (#18; Laser Components). Depending on the position at which the beam illuminates the quadrant diode, a respective signal is sent to a motorized objective positioner (Physik Instrumente) to move the objective along the z axis, thereby correcting for changes of the focal plane. To move the sample laterally, we used a custom-built motorized xy stage (SmarAct). To enable an automated on-microscope staining and elution procedure, we complemented the microscope setup by the pipetting robot PAL3 RTC (Axel Semrau). Our robot is equipped with three vial trays and two syringes (100 µl and 1000 µl) and allows pre-mixing of solutions and their application onto the sample as well as their precise and reliable removal from the glass bottom dish. For fully automated microscopy and re-staining procedure, both microscope hardware elements as well as the pipetting robot were integrated into one custom-written control software, called Experiment Editor that can be conveniently addressed by the user via the corresponding graphical user interface (GUI). To this end, all microscope components were implemented into the device manager of the open source software µManager (Open Imaging) 37 . To conveniently use functionality of the hardware, initially, on top of µManager, the custom-written Microscope Control software was developed. The pipetting robot, in turn, can be controlled by the commercially available Chronos software (Axel Semrau). Although the Microscope Control software can be directly addressed by the Experiment Editor, the pipetting robot is controlled and synchronized indirectly by employing a custom-written plugin that enabled Chronos to obtain tasks generated by the Experiment Editor in an exchange folder (Supplementary Fig. 4a ).
Show full methods section
Methods maS 3 TORM setup The custom-built 3D d STORM setup (Supplementary Fig. 1 , parts referenced here as #x and summarized in Supplementary Table 4 ) is equipped with 405 nm (#1; Cube, Coherent), 488 nm (#2; Obis, Coherent), 561 nm (#3; Obis, Coherent), and 661 nm (#4; Cube, Coherent) lasers. For excitation, lasers were focused onto the back focal plane of a ×100 total internal reflection fluorescence objective with a numerical aperture of 1.49 (#9; Olympus). Emission light is collected by a multi-bandpass filter (#8; ZT405/488/561/647rpc, Chroma) and passes a cylindrical lens (#10; Thorlabs) that is used for astigmatism-based 3D imaging. Dual-color d STORM imaging was performed by illumination with the 661 nm laser. Light emitted from the sample was filtered through the 700/75 ET bandpass filter, split into two beams by a custom-built dichroic filter (#13; 690 nm, Chroma), and focused onto the EMCCD camera (#15; iXon Ultra 897, Andor) with each channel occupying one half of the camera chip. The z -focus was stabilized by a feedback loop. The beam of an infrared diode (#16; 785 nm, Thorlabs) is reflected at the edge of the cover glass surface and the sample medium and projected onto a quadrant photodiode (#18; Laser Components). Depending on the position at which the beam illuminates the quadrant diode, a respective signal is sent to a motorized objective positioner (Physik Instrumente) to move the objective along the z axis, thereby correcting for changes of the focal plane. To move the sample laterally, we used a custom-built motorized xy stage (SmarAct). To enable an automated on-microscope staining and elution procedure, we complemented the microscope setup by the pipetting robot PAL3 RTC (Axel Semrau). Our robot is equipped with three vial trays and two syringes (100 µl and 1000 µl) and allows pre-mixing of solutions and their application onto the sample as well as their precise and reliable removal from the glass bottom dish. For fully automated microscopy and re-staining procedure, both microscope hardware elements as well as the pipetting robot were integrated into one custom-written control software, called Experiment Editor that can be conveniently addressed by the user via the corresponding graphical user interface (GUI). To this end, all microscope components were implemented into the device manager of the open source software µManager (Open Imaging) 37 . To conveniently use functionality of the hardware, initially, on top of µManager, the custom-written Microscope Control software was developed. The pipetting robot, in turn, can be controlled by the commercially available Chronos software (Axel Semrau). Although the Microscope Control software can be directly addressed by the Experiment Editor, the pipetting robot is controlled and synchronized indirectly by employing a custom-written plugin that enabled Chronos to obtain tasks generated by the Experiment Editor in an exchange folder (Supplementary Fig. 4a ).
Cell preparation
U2OS human bone osteosarcoma epithelial cells constitutively expressing Nup133-Ypet (Ypet is a YFP variant detectable by GFP nanobodies 49 ) were cultured in DMEM/F-12 (Gibco) supplemented with 10% FCS (Gibco) and 2% GlutaMAX (Gibco) at 37 °C in 5% CO 2 . Cells were transferred to glass bottom dishes (P35G-0-14-C, MatTek) pretreated with 50 µg/ml fibronectin (Sigma) and 1:500 Tetraspeck fluorescent beads (T7279, Invitrogen). After 24 h cells were washed twice with PSB and chemically fixed with 4% paraformaldehyde/4% sucrose dissolved in phosphate-buffered saline (PBS) for 15 min. After three washing steps with PBS, cells were permeabilized using 0.1% Triton in PBS for 10 min at room temperature (RT).
Tissue preparation
All experiments on animals were conducted in compliance with the German animal welfare guidelines according to protocol G-75/15, and approved by the Regierungspraesidium Karlsruhe. Young (12 days old) Sprague-Dawley rats (Charles River) were anesthetized and transcardially perfused using ~20 ml PBS, followed by ~30 ml 4% paraformaldehyde/PBS. Brains were removed and post-fixed in 4% paraformaldehyde/PBS for 24 h at 4 °C. The brain stem was cut into 200 µm thick slices using a vibratome (SLICER HR2, Sigmann-Elektronik). Using a scalpel, the medial nucleus of the trapezoid body (MNTB) was cut out, resulting in a ~(200 µm)³ tissue block that was infiltrated in 2.1 M sucrose in 0.1 M cacodylic acid buffer (pH 7.4) for 1 h at RT. The tissue was placed on a specimen holder, plunge-frozen in liquid nitrogen, and further sliced into 400 nm sections using a cryo-ultramicrotome (Ultracut S with cryo-chamber EM FCS, Leica). Thin sections were picked up using a 2.3 M sucrose (in cacodylic acid buffer) droplet in a metal loop and transferred to glass bottom dishes that were previously incubated with 1:500 Tetraspeck beads. Prior to staining, tissue was thawed for 10 min at RT and sucrose was removed by three washing steps with PBS for 15 min. This method of tissue preparation ensures good tissue preservation and direct access of antibodies to epitopes within the cell without the use of detergents 26 . Accessibility to the intracellular space is established by cutting the tissue into thin sections of 400 nm thickness, thereby opening all cells and even their sub-compartments such as dendritic processes or presynaptic terminals. Series of steps in an automated imaging session Each experiment consists of a series of steps illustrated in Fig. 1c . After preparing and fixing the sample (1), the experimental design is programmed using the custom-written Experiment Editor (2), the sample is stained for the first time (staining round 1) either manually or semi-automatically using the pipetting robot (3), and vials with solutions for labeling, washing, and elution are prepared. Subsequently, ROIs are selected for acquisition (4). To prevent focus loss during a long-term experiment, an automated refocusing approach maintains the focal plane based on a preselected region containing fluorescent bead fiducials (5). Then, d STORM 3D images of two channels are acquired and spectrally demixed (6). The new round starts with the acquisition of bead fiducials for subsequent registration of images from different staining rounds (7). To remove labeling from the imaged staining round, depending on the type of labels used, chemical elution (8) and/or photo-bleaching (9) is performed. Thereafter, the sample is re-stained using a new set of labels. (10) Refocusing (11) precedes d STORM 3D image acquisition. Finally, the procedure can be repeated as many times as desired by resuming with step 7. After a completed multiplex session, data sets were individually evaluated regarding labeling and image quality, and high-quality SMLM images were qualified for further analysis. Experiment Editor All steps described below were carried out using the custom-written Experiment Editor software (Supplementary Fig. 2 ). Its GUI allows convenient and coordinated operation of microscope components and the pipetting robot (Supplementary Fig. 3 ). Microscope control was realized via custom-written Microscope Control software, which, in turn, addresses µManager, an open source software, where all microscope hardware components were integrated. The pipetting robot was operated using a handshake procedure communicating via a specific exchange folder (Supplementary Fig. 4 ). A plugin that was custom-written for the commercial Chronos software constantly checks the content of an exchange folder for a path to a Chronos-tailored task list generated by Experiment Editor. The task list consists of a set of commands that is loaded into Chronos and executed by the robot. After the tasks are successfully completed, a text file with specific key words is saved to the exchange folder by the Chronos plugin. This file, in turn, instructs the Experiment Editor to continue with the execution of the next workflow module.
Staining and re-staining procedure
Cells and cryo-sections were both blocked in 5% fetal calf serum (FCS) for 10 min. For immunohistochemistry, antibodies were applied in 0.5% FCS for 1 h. After each application of antibodies or other labels, samples were washed three times with PBS for a total of 15 min. Alexa Fluor 647 conjugated nanobodies against GFP and CHC17 against clathrin heavy chain 1 were applied for 1 h in 0.5% FCS. Alexa Fluor 647 conjugated phalloidin and CF680 conjugated WGA were applied in PBS for 20 min. JF 646 -Hoechst was directly added to the imaging buffer. For the precise multiplexed STORM workflow used for U2OS cells (Fig. 2a ) and for MNTB slices (Fig. 3c ), see Supplementary Tables 1 and 2 , respectively. All antibodies and other staining reagents used for cells and neuronal tissue are summarized in Supplementary Table 3 . In cells and neuronal tissue, re-staining was realized by photo-bleaching and/or chemical elution. Elution of antibodies was performed using 0.1% SDS at pH 13 for 15 min (modified from Collman et al. 39 . To ensure the desired concentration, the sample was once washed with elution buffer before it was applied for a second time for incubation. After elution, the sample was washed with PBS six times in total. Bleaching was realized in PBS using the 661 nm laser at 100% power (~2 kW cm −2 ) and 405 nm laser at 50% power (0.7 kW cm −1 ) for 4 min 10 . All staining, bleaching, and elution procedures were carried out by the pipetting robot at RT (21 °C).
SMLM image acquisition
For all imaging rounds, β-mercaptoethylamine (MEA) buffer at pH 8 containing 100 m m MEA and 15 m m KOH in PBS was freshly prepared by the pipetting robot. To prevent dilution of MEA buffer by residual liquid inside the glass bottom dish, before imaging, the sample was once washed with MEA buffer. Conventional wide field images were acquired using 661 nm laser at low power (~1 W cm −2 ) with an exposure time of 200 ms. For d STORM images, photoswitching of fluorophores was initiated by 10 s exposure to 661 nm laser at high power (~2 kW cm −2 ), followed by the acquisition of 20,000 frames at an exposure time of 30 ms. PAINT imaging with JF 646 -Hoechst was performed at an exposure time of 50 ms. All images were recorded in astigmatism-based 3D mode and automatically, via a Python script, redirected to and processed by rapidSTORM.
Fiducial imaging
For precise registration of images from distinct staining rounds, we imaged fluorescent bead fiducials (excitable at 560 nm, 660 nm, and other wavelengths; Tetraspeck beads T7279, Invitrogen). To ensure maximal immobilization, we seeded the fiducials onto glass bottom dishes underneath the cells or tissue. As STORM images are performed at very high 661 nm laser intensity, bead fluorophores with an excitation maximum of 660 nm are bleached after approximately two STORM and two bleaching rounds. To preserve fiducials for >10 imaging and bleaching rounds, we used weak excitation by the 561 nm laser. Recording through a filter (700/75 ET Bandpass, AHF: F47-700) optimized for the 661 nm laser allowed us to minimize chromatic aberration. ROIs for SMLM imaging were chosen such that they contained at least five fiducials to allow precise registration.
Auto-refocusing system
In addition to the infrared diode-based focus stabilization system (described in the first paragraph of Methods) that ensures a constant basic position of the objective relative to upper edge of the cover glass, an automated focus recovery was implemented based on Tetraspeck fiducials. A reference region with at least five fluorescent beads in focus (without cells or tissue) was selected and its coordinates were transferred to the automated refocusing module. Subsequently, the major multiplex workflow was launched. In our design applied for cells and nervous tissue, initially the bead-reference region is approached, images are taken, automatically processed by rapidSTORM, and the mean z values for the beads are extracted. After that, the Auto Focus module moves the objective through six focus positions (customized step size); for each position the mean z value is determined. Finally, the z position with a z value closest to the reference z value is selected. Next, STORM images of the preselected ROIs (five in our experiment design) are acquired. As long as the infrared diode-based focus stabilization stays within its working range of 50 µm (which is only exceeded if the glass bottom dish is strongly inclined toward the objective), the distance between the sets of beads and the particular ROI is not relevant for focus reliability.
Imaging experiments on U2OS cells
U2OS cells constitutively expressing the nuclear pore component Nup133 tagged with Ypet were successively stained (Fig. 2a , Supplementary Table 1 ) with Alexa Fluor 647 conjugated nanobodies against GFP that bind Ypet (SR1/Ch1), phalloidin binding actin (SR2/Ch1), WGA-CF680 binding sialic acid and N -acetylglucosaminyl sugar residues at the plasma membrane, at the Golgi trans face and in the center of nuclear pores (SR2/Ch2), Alexa Fluor 647 conjugated clathrin antibodies (SR3/Ch1), anti-tubulin (SR4/Ch1), anti-paxillin (SR4/Ch2), anti-vimentin (SR5/Ch1), cis -Golgi recognizing anti-GM130 (SR5/Ch2), anti-fibrillarin (SR6/Ch2), mitochondria-specific anti-Tom20 (SR7/Ch1), anti-lamin A/C (SR8/Ch1), ER recognizing anti-PDI (SR8/Ch2) antibodies, as well as early endosome anti-Rab5 (SR9/Ch2) and anti-EEA1 (SR10/Ch1) antibodies, and a JF 646 -Hoechst conjugate that reversibly binds DNA (SR11/Ch1). In addition to this representative experiment, another three experiments were carried out with similar designs and outcomes.
Imaging experiments at the calyx of Held giant synapse
Tissue was labeled with antibodies against bassoon (SR1/Ch1) and homer1/2/3 (SR1/Ch2), phalloidin Alexa Fluor 647 (SR2/Ch1), WGA-CF680 (SR2/Ch2), Alexa Fluor 647 labeled CHC17 primary antibody (SR3/Ch1), and antibodies against MAP2 (SR4/Ch1) VGlut1 SR4/Ch2), GM130 (SR5/Ch2), Rab3a (SR6/Ch1), Tom20 (SR6/Ch2), α-tubulin (SR7/Ch2), γ-actin (SR8/Ch1), synaptophsin 1 (SR8/Ch2), α/β-synuclein (SR9/Ch1), and PDI (SR9/Ch2), as well as JF 646 -Hoechst conjugate that reversibly binds DNA (SR10/Ch1) (Fig. 3c , Supplementary Table 2 ). In addition to this representative experiment, another six experiments were carried out with similar designs and outcomes.
SMLM image reconstruction and registration
Directly after SMLM acquisition, employing a Python script, image frames were automatically redirected to rapidSTORM software for single-molecule localization and image reconstruction. For subsequent SMLM processing steps, including spectral demixing, drift correction, and 2D as well as 3D rendering, the Post-Processing software was developed. To allow custom data processing, we complemented the software by a GUI with modular design. Fast and standardized image analysis was possible using the batch processing function. SMLM images from consecutive staining rounds were registered based on fluorescent bead fiducials (at least five). SMLM images were linearly transformed based on mean distances along x and y axes between corresponding fiducials from different imaging rounds. To determine the linear registration error, we first calculated the distances (Δ x ) between x coordinates of each bead i in an image from round A and bead i in an image from round B : documentclass[12pt]{minimal} usepackage{amsmath} usepackage{wasysym} usepackage{amsfonts} usepackage{amssymb} usepackage{amsbsy} usepackage{mathrsfs} usepackage{upgreek} setlength{oddsidemargin}{-69pt} begin{document}$$Delta x_i = x_{A,i} - x_{B,i}.$$end{document} Δ x i = x A , i − x B , i . Subsequently, based on Δ x of all beads n , we calculated the registration error (RE) along the x axis: documentclass[12pt]{minimal} usepackage{amsmath} usepackage{wasysym} usepackage{amsfonts} usepackage{amssymb} usepackage{amsbsy} usepackage{mathrsfs} usepackage{upgreek} setlength{oddsidemargin}{-69pt} begin{document}$$RE_x = frac{1}{n}mathop {sum}limits_{i = 1}^n {left| {overline {Delta x} - Delta x_i} right|}$$end{document} R E x = 1 n ∑ i = 1 n Δ x ¯ − Δ x i with documentclass[12pt]{minimal} usepackage{amsmath} usepackage{wasysym} usepackage{amsfonts} usepackage{amssymb} usepackage{amsbsy} usepackage{mathrsfs} usepackage{upgreek} setlength{oddsidemargin}{-69pt} begin{document}$$overline {Delta x}$$end{document} Δ x ¯ being the average ∆x over all beads. RE along the y axis was calculated analogously. Fiducial coordinates were semi-automatically determined in ImageJ 50 and imported to Excel (Microsoft) where RE x and RE y were calculated as described above and visualized as a heatmap. For registration with image from round A, images from round B were linearly transformed by documentclass[12pt]{minimal} usepackage{amsmath} usepackage{wasysym} usepackage{amsfonts} usepackage{amssymb} usepackage{amsbsy} usepackage{mathrsfs} usepackage{upgreek} setlength{oddsidemargin}{-69pt} begin{document}$$overline {Delta x}$$end{document} Δ x ¯ and documentclass[12pt]{minimal} usepackage{amsmath} usepackage{wasysym} usepackage{amsfonts} usepackage{amssymb} usepackage{amsbsy} usepackage{mathrsfs} usepackage{upgreek} setlength{oddsidemargin}{-69pt} begin{document}$$overline {Delta y}$$end{document} Δ y ¯ .
Analysis of protein distribution at the calyx synapse
The protein distribution within the calyx of Held was analyzed using discrete line profiles manually drawn in ImageJ (Supplementary Fig. 12 ). Initially, the tightly apposed pre- and postsynaptic membranes labeled by WGA were traced by the “segmented line selection tool”. Using a custom-written ImageJ macro, the line was automatically interpolated, split into 1 µm segments, and rotated by a 90° angle. This ensured an orientation of line profiles perpendicular to the synaptic membrane. The line selections were elongated and the line thickness was set to 700 nm. To ensure reliable analysis, we considered contiguous membranes, which we defined as a clearly discernible WGA staining at both membranes (outer and inner) of the synapse that is traceable in at least 70% of the analyzed selection. Correct identification of synaptic membranes was additionally confirmed by AZ and SV markers. For all calyx segments that passed our criteria, multi-line plots were automatically generated and saved as tables. Data tables from five experiments (with three calyces per experiment and 4–16 line profiles per calyx; for n numbers see also Supplementary Table 5 ) were collected and imported to Matlab for further analysis. We define the outer and inner (synaptic) borders of the calyx as presynaptic membrane not facing the postsynaptic cell and presynaptic membrane facing the postsynaptic cell, respectively. The pre- and postsynaptic membranes constituting the inner border cannot be discriminated because they are separated by
📊 Figures
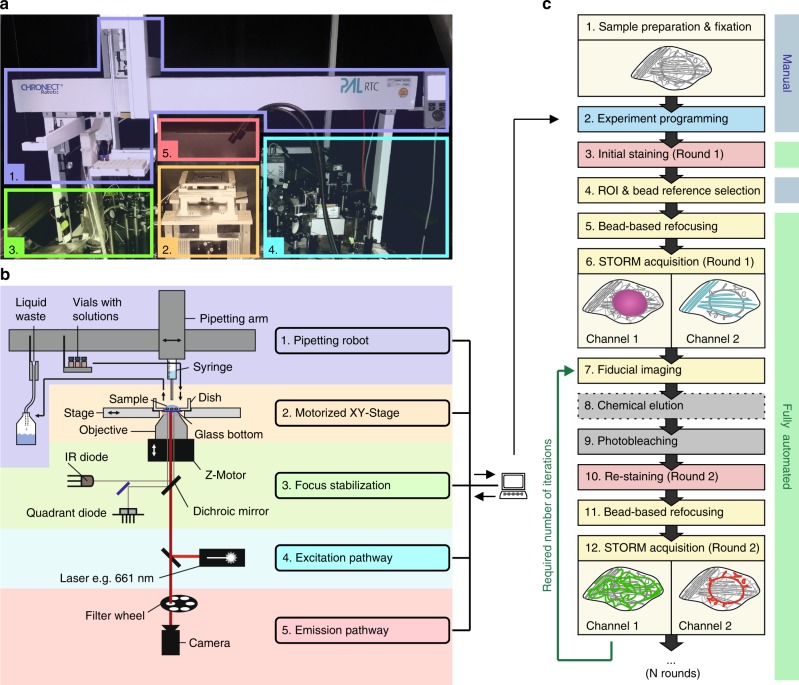
Fig. 1
Automated maS 3 TORM multiplex setup and experimental workflow.
Photographic a and schematic overview b of the setup body comprising the pipetting robot (1, purple), the motorized stage on top of the inverted 1.49 NA 100x objective (2, yellow), the focus stabiliza...
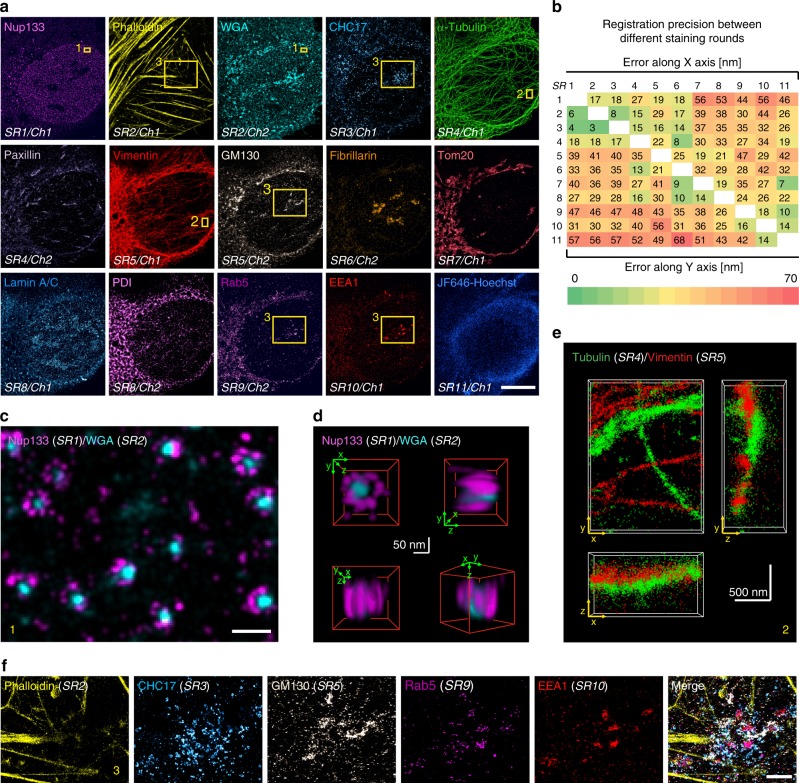
Fig. 2
Multi-target 3D dSTORM of a single U2OS cell.
a A U2OS cell with 15 targets labeled and acquired by 11 staining rounds (SR). Two channels (Ch) can be detected per SR, but not always each channel can be used for final analysis. In addition, to get...
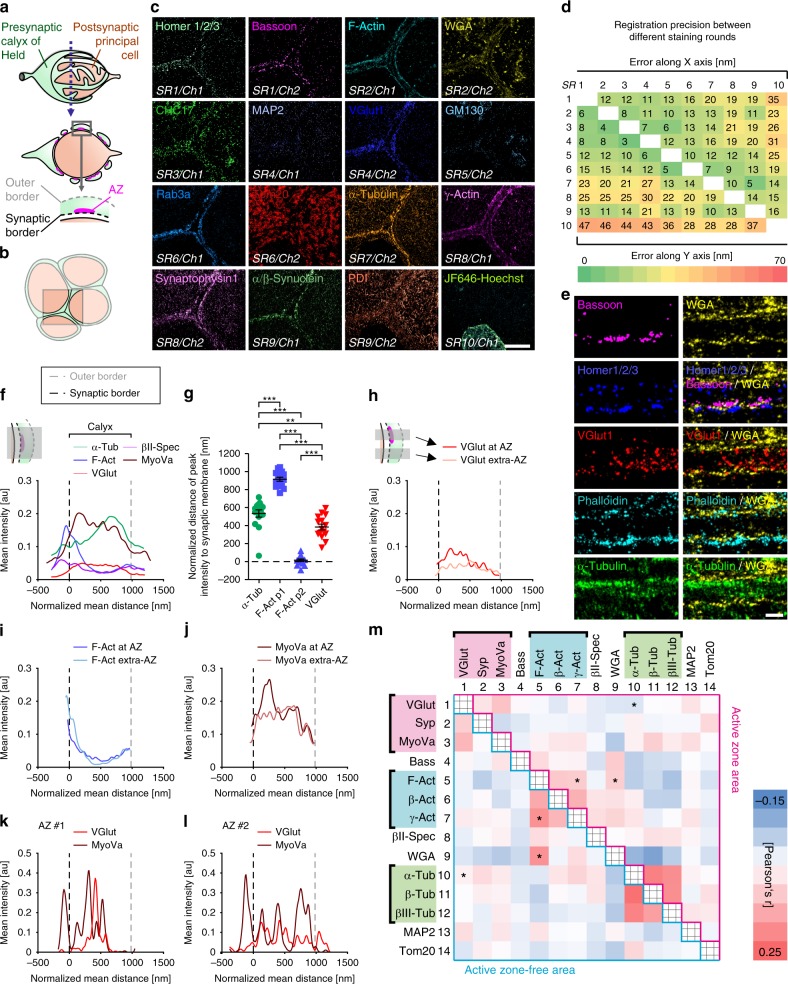
Fig. 3
Multiplex dSTORM of the calyx of Held synapse.
a Schematic representation of the calyx of Held synapse with the cross-section revealing multiple swellings with active zones (AZ) and zoom-in delineating borders relevant for analysis. b Cartoon illu...
Fig. 4
Model of protein distribution in the calyx of Held synapse.
a Distribution of proteins examined in Fig. 3 and Supplementary Fig. 13 indicated by color gradient. Distribution at active zone (AZ)-positive regions are indicated by dark gray rectangles at the bott...
Figure images are served from the NIH/NLM PubMed Central Open Access Subset or Europe PMC; copyright remains with the publishers and authors.
💬 Discussion
0 commentsNo comments yet. Be the first to start a discussion!
Leave a Comment