Abstract
AbstractThe bacterial division apparatus catalyses the synthesis and remodelling of septal peptidoglycan (sPG) to build the cell wall layer that fortifies the daughter cell poles. Understanding of this essential process has been limited by the lack of native three-dimensional views of developing septa. Here, we apply state-of-the-art cryogenic electron tomography (cryo-ET) and fluorescence microscopy to visualize the division site architecture and sPG biogenesis dynamics of the Gram-negative bacterium Escherichia coli. We identify a wedge-like sPG structure that fortifies the ingrowing septum. Experiments with strains defective in sPG biogenesis revealed that the septal architecture and mode of division can be modified to more closely resemble that of other Gram-negative (Caulobacter crescentus) or Gram-positive (Staphylococcus aureus) bacteria, suggesting that a conserved mechanism underlies the formation of different septal morphologies. Finally, analysis of mutants impaired in amidase activation (ΔenvC ΔnlpD) showed that cell wall remodelling affects the placement and stability of the cytokinetic ring. Taken together, our results support a model in which competition between the cell elongation and division machineries determines the shape of cell constrictions and the poles they form. They also highlight how the activity of the division system can be modulated to help generate the diverse array of shapes observed in the bacterial domain.
🔬 Techniques
🔭 Microscopes
🧬 Organisms
✨ Fluorophores
🧪 Sample Preparation
🔬 Cell Lines
🏭 Microscope Brands
🧪 Reagent Suppliers
📷 Detectors
🎨 Filters
💻 Software Details
🏛️ Research Organizations (ROR)
Affiliated research institutions:
📋 Methods
Media, bacterial strains and mutagenesis Indicated strain derivatives of E. coli MG1655 used in this study are listed in Supplementary Tables 4 and 5 . Bacteria were grown in LB (1% Tryptone, 0.5% yeast extract, 0.5% NaCl) or M9 media 54 each supplemented with 0.2% d -glucose and casamino acids. For selection, antibiotics were used at 10 µg ml −1 (tetracycline), 25 µg ml −1 (chloramphenicol) and 50 µg ml −1 (kanamycin, ampicillin). Mutant alleles were moved between strains using phage P1 transduction. If necessary, the antibiotic cassette was removed using FLP recombinase expressed from pCP20 55 . All mutagenesis procedures were confirmed by PCR. Cryo-EM specimen preparation Extended Data Fig. 1 summarizes the cryo-FIB/cryo-ET pipeline utilized in this study. Bacterial strains were grown overnight in LB media, back diluted 1:1,000 and incubated with shaking at 37 °C and 250 r.p.m. to optical density (OD) 600 = 0.3. Cells were collected by centrifugation (2 min, 5,000 × g , r.t.) and resuspended in LB media to a final OD 600 = 0.6. This cell suspension (3 µl) was applied to Cflat-2/1 200 mesh copper or gold grids (Electron Microscopy Sciences) that were glow discharged for 30 s at 15 mA. Grids were plunge-frozen in liquid ethane 56 with an FEI Vitrobot Mark IV (Thermo Fisher Scientific) at r.t., 100% humidity with a waiting time of 10 s, one-side blotting time of 13 s and blotting force of 10. Customized parafilm sheets were used for one-side blotting. All subsequent grid handling and transfers were performed in liquid nitrogen. Grids were clipped onto cryo-FIB autogrids (Thermo Fisher Scientific). Cryo-FIB milling Grids were loaded in an Aquilos 2 Cryo-FIB (Thermo Fisher Scientific). The specimen was sputter coated inside the cryo-FIB chamber with inorganic platinum, and an integrated gas injection system was used to deposit an organometallic platinum layer to protect the specimen surface and avoid uneven thinning of cells. Cryo-FIB milling was performed on the specimen using two rectangular patterns to mill top and bottom parts of cells, and two extra rectangular patterns were used to create micro-expansion joints to improve lamellae instability 57 . Cryo-FIB milling was performed at a nominal tilt angle of 14°−18°, which translates into a milling angle of 7°−11° 58 . Cryo-FIB milling was performed in several steps of decreasing ion beam currents ranging from 0.5 nA to 10 pA and decreasing thickness to obtain 100–200 nm lamellae. Cryo-ET All imaging was done on an FEI Titan Krios (Thermo Fisher Scientific) transmission electron microscope operated at 300 KeV and equipped with a Gatan BioQuantum K3 energy filter (20 eV zero-loss filtering) and a Gatan K3 direct electron detector. Before data acquisition, a full K3 gain reference was acquired, and ZLP and BioQuantum energy filters were finely tuned. The nominal magnification for data collection was ×42,000 or ×33,000, giving a calibrated 4 K pixel size of 2.193 Å and 2.565/2.758 Å, respectively. Data collection was performed in the nanoprobe mode using the SerialEM 59 or Thermo Scientific Tomography 5.3 software. The tilt range varied depending on the lamella, but was generally from −70° to 70° in 2° steps following the dose-symmetric tilt scheme 60 . Tilt images were acquired as 8 K × 11 K super-resolution movies of 4–8 frames with a set dose rate of 1.5–3 e − Å −1 s −1 . Tilt series were collected at a range of nominal defoci between −3.5 and −5.0 µm and a target total dose of 80–180 e − Å −2 (Supplementary Table 1 ).
Show full methods section
Media, bacterial strains and mutagenesis Indicated strain derivatives of E. coli MG1655 used in this study are listed in Supplementary Tables 4 and 5 . Bacteria were grown in LB (1% Tryptone, 0.5% yeast extract, 0.5% NaCl) or M9 media 54 each supplemented with 0.2% d -glucose and casamino acids. For selection, antibiotics were used at 10 µg ml −1 (tetracycline), 25 µg ml −1 (chloramphenicol) and 50 µg ml −1 (kanamycin, ampicillin). Mutant alleles were moved between strains using phage P1 transduction. If necessary, the antibiotic cassette was removed using FLP recombinase expressed from pCP20 55 . All mutagenesis procedures were confirmed by PCR. Cryo-EM specimen preparation Extended Data Fig. 1 summarizes the cryo-FIB/cryo-ET pipeline utilized in this study. Bacterial strains were grown overnight in LB media, back diluted 1:1,000 and incubated with shaking at 37 °C and 250 r.p.m. to optical density (OD) 600 = 0.3. Cells were collected by centrifugation (2 min, 5,000 × g , r.t.) and resuspended in LB media to a final OD 600 = 0.6. This cell suspension (3 µl) was applied to Cflat-2/1 200 mesh copper or gold grids (Electron Microscopy Sciences) that were glow discharged for 30 s at 15 mA. Grids were plunge-frozen in liquid ethane 56 with an FEI Vitrobot Mark IV (Thermo Fisher Scientific) at r.t., 100% humidity with a waiting time of 10 s, one-side blotting time of 13 s and blotting force of 10. Customized parafilm sheets were used for one-side blotting. All subsequent grid handling and transfers were performed in liquid nitrogen. Grids were clipped onto cryo-FIB autogrids (Thermo Fisher Scientific). Cryo-FIB milling Grids were loaded in an Aquilos 2 Cryo-FIB (Thermo Fisher Scientific). The specimen was sputter coated inside the cryo-FIB chamber with inorganic platinum, and an integrated gas injection system was used to deposit an organometallic platinum layer to protect the specimen surface and avoid uneven thinning of cells. Cryo-FIB milling was performed on the specimen using two rectangular patterns to mill top and bottom parts of cells, and two extra rectangular patterns were used to create micro-expansion joints to improve lamellae instability 57 . Cryo-FIB milling was performed at a nominal tilt angle of 14°−18°, which translates into a milling angle of 7°−11° 58 . Cryo-FIB milling was performed in several steps of decreasing ion beam currents ranging from 0.5 nA to 10 pA and decreasing thickness to obtain 100–200 nm lamellae. Cryo-ET All imaging was done on an FEI Titan Krios (Thermo Fisher Scientific) transmission electron microscope operated at 300 KeV and equipped with a Gatan BioQuantum K3 energy filter (20 eV zero-loss filtering) and a Gatan K3 direct electron detector. Before data acquisition, a full K3 gain reference was acquired, and ZLP and BioQuantum energy filters were finely tuned. The nominal magnification for data collection was ×42,000 or ×33,000, giving a calibrated 4 K pixel size of 2.193 Å and 2.565/2.758 Å, respectively. Data collection was performed in the nanoprobe mode using the SerialEM 59 or Thermo Scientific Tomography 5.3 software. The tilt range varied depending on the lamella, but was generally from −70° to 70° in 2° steps following the dose-symmetric tilt scheme 60 . Tilt images were acquired as 8 K × 11 K super-resolution movies of 4–8 frames with a set dose rate of 1.5–3 e − Å −1 s −1 . Tilt series were collected at a range of nominal defoci between −3.5 and −5.0 µm and a target total dose of 80–180 e − Å −2 (Supplementary Table 1 ).
Cryo-ET image processing
Acquired tilted super-resolution movies were motion corrected and Fourier cropped to 4 K × 5 K stacks, using ‘framealign’ from IMOD 61 . Tilt series were aligned using ‘etomo’ in IMOD 62 and ‘Dynamo’. Contrast transfer function (CTF) estimation was performed in IMOD. CTF correction was performed using the ‘ctfphaseflip’ programme in IMOD 63 . CTF-corrected unbinned tomograms were reconstructed by weighted back projection with and without a SIRT-like filter and subsequently 2x, 4x and 8x binned in IMOD 62 . Bandpass filtering and summed projection of cryo-tomogram slices were performed in Dynamo 64 – 67 complemented with customized MATLAB scripts. Gaussian and NAD-filtering were performed in Amira (Thermo Fisher Scientific) for visualization purposes. NAD-filtering was applied using the command ‘Anisotropic Diffusion’ in 3D mode for 5 iterations. Gaussian filtering was done by applying the command ‘Gaussian Filter’ under 3D mode with a kernel size factor of 3. Whole 3D-volume FFT filtering was performed in IMOD.
Segmentation
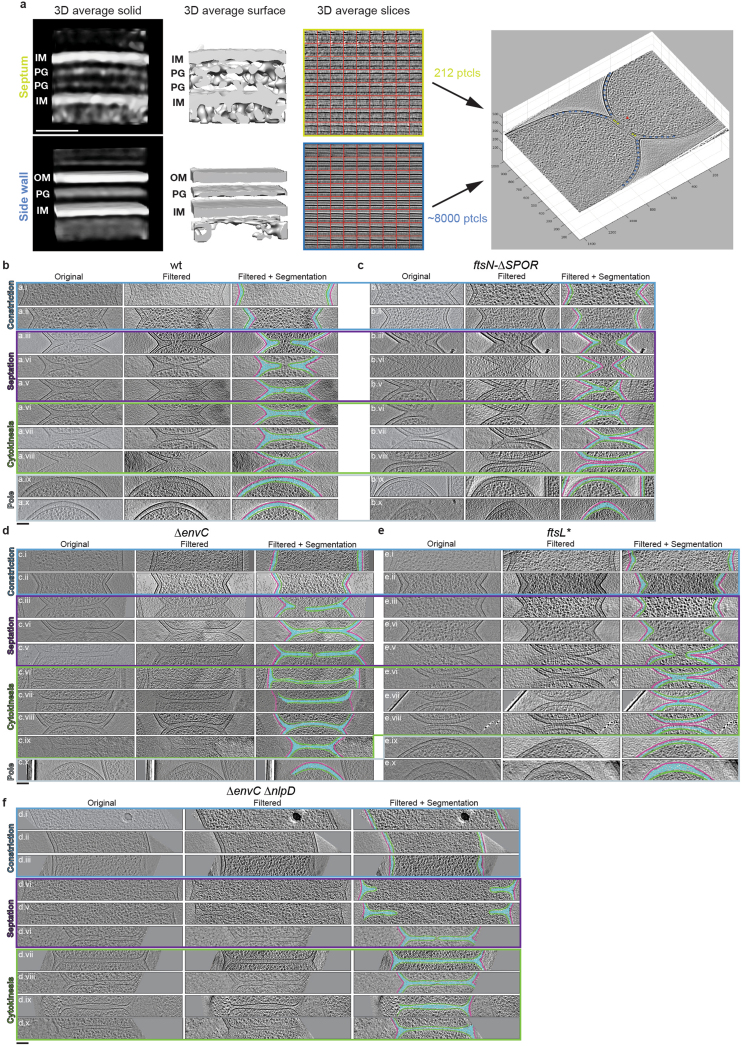
Segmentation was performed on FFT filtered and NAD-filtered tomograms using Amira (Thermo Fisher Scientific) by non-biased semi-automatic approaches. Manual annotation was required every 10 slices, then Amira’s interpolation function was applied to automatically trace slices in between. Annotation was done in two-dimensional (2D) slices where features of interest were visible by eye. The segmented PG signal is not indicative of specific glycan strand network, but rather serves as a visual guide to relevant cell wall features. Curvature Three-dimensional pole curvature rendering was performed in Amira by applying the command ‘Curvature’ on the basis of the triangulated 3D mesh and ‘Shape Index’ as implemented in Amira 68 . Shape index (SI) computes the surface scalar field, which is calculated as documentclass[12pt]{minimal} usepackage{amsmath} usepackage{wasysym} usepackage{amsfonts} usepackage{amssymb} usepackage{amsbsy} usepackage{mathrsfs} usepackage{upgreek} setlength{oddsidemargin}{-69pt} begin{document}$$mathrm{SI} = frac{pi }{2}mathrm{atan}frac{{C_1 + C_2}}{{C_1 + C_2}}$$end{document} S I = π 2 a t a n C 1 + C 2 C 1 + C 2 where C 1 and C 2 are the two principal curvatures. Shape index ranges from −1 to 1, negative values indicate negative curvature, positive values indicate positive curvature and values close to 0 indicate flatness of the surface. Values are normalized with respect to neighbouring triangles’ SI values 68 (Fig. 5d ).
Quantification of cryo-ET data Division site dimensions
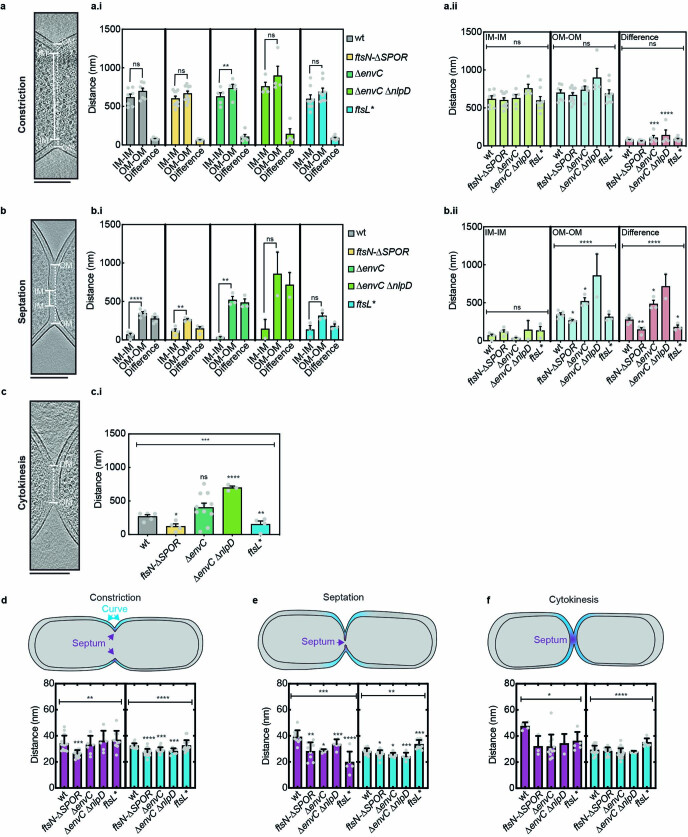
Summed projection images of cryo-ET tomograms were used to quantitatively measure cell dimensions at the division site 69 . Measurements were performed in Fiji 70 using the ‘point to point’ measuring tool. Measurements were from IM to IM and from OM to OM. Periplasmic space Measurements of periplasmic space thickness were performed from the centre of the OM to the centre of the IM in the cell areas referred to here as ‘side wall’, ‘pole’ and ‘curve’ as well as the invagination tip of the OM to the IM at the constriction division stage. Measurements from centre to centre of opposing IMs were performed in the cell area defined in this study as the septum (Supplementary Figs. 2 and 5 ) . We used a customized macro in Fiji that measures 30 Euclidean distances from surface-to-surface areas 71 in nm, for example, from IM to IM at the septum and from IM to OM at the rest of the areas (side wall, pole, curve and initiation). For these 30 single measurements, the mean was calculated, yielding a final single value per defined subcellular localization, for example, septum, curve, pole and side wall.
Subtomogram averaging
Subtomogram averaging was performed in Dynamo 64 . From the full wild-type cryo-ET data set, particles were identified using ‘dtmslice’ interface in Dynamo 66 , 67 , 72 . In 4x-binned tomograms, subtomograms with a size of (777.6) 3 Å were extracted from 4x-binned tomograms. Initial angles were assigned following the normal of the IM. A starting reference generated from a random set of particles was used for both side wall and septum particles. A total of 16 iterations were used to align particles and obtain final averages. Final averages were generated from 8,076 subtomograms for the side wall and 212 particles for the septum. Notice that side wall regions were much more abundant in the cell than septum regions. EM densities were visualized in Chimera 73 .
Sample preparation for live cell imaging Overnight cultures of indicated
E. coli strains were grown in LB supplemented with appropriate antibiotics at 37 °C. The next day, cells were collected by centrifugation (2 min, 5,000 × g , r.t.) and washed 2× with M9 medium. Day cultures were back diluted (1:1,000) and grown in M9 (0.2% d -glucose, 0.2% casamino acids) supplemented with 50 µM Isopropyl β-D-1-thiogalactopyranoside (IPTG) and appropriate antibiotics at 30 °C until OD 600 = 0.2–0.4. For filamentation experiments, SulA was produced from pNP146 74 by the addition of 0.2% l -arabinose during the last 10 min of the incubation period. Cells were collected (2 min, 5,000 × g , r.t.) and resuspended in 1/10th of the original volume. Two microlitres of this cell suspension were added onto a 1% (w/v) agarose in M9 (0.2% d -glucose, casamino acids) pad supplemented with 50 µM IPTG and covered with a #1.5 coverslip. For filamentation experiments, the agar pad was also supplemented with 0.2% l -arabinose.
Live-cell imaging
All samples were imaged on a Nikon Ti-E inverted widefield microscope equipped with a fully motorized stage and perfect focus system. Images were acquired using a 1.45 NA Plan Apo ×100 Ph3 DM objective lens with Cargille Type 37 immersion oil. Fluorescence was excited using a Lumencore SpectraX LED light engine and filtered using ET-GFP (Chroma, 49002) and ET-mCherry (Chroma, 49008) filter sets. Images were recorded on an Andor Zyla 4.2 Plus sCMOS camera (65 nm pixel size) using Nikon Elements (v5.10) acquisition software. For subsequent deconvolution procedures, three 200 nm spaced Z -planes were acquired for both fluorescence channels using 100% LED output power and 50 ms exposure. Temperature was maintained at 30 °C using a custom-made environmental enclosure. After a 20 min acclimatization period, cells were imaged at a 2.5 min acquisition frame rate for a total observation time of 1–4 h.
Image processing for fluorescence microscopy
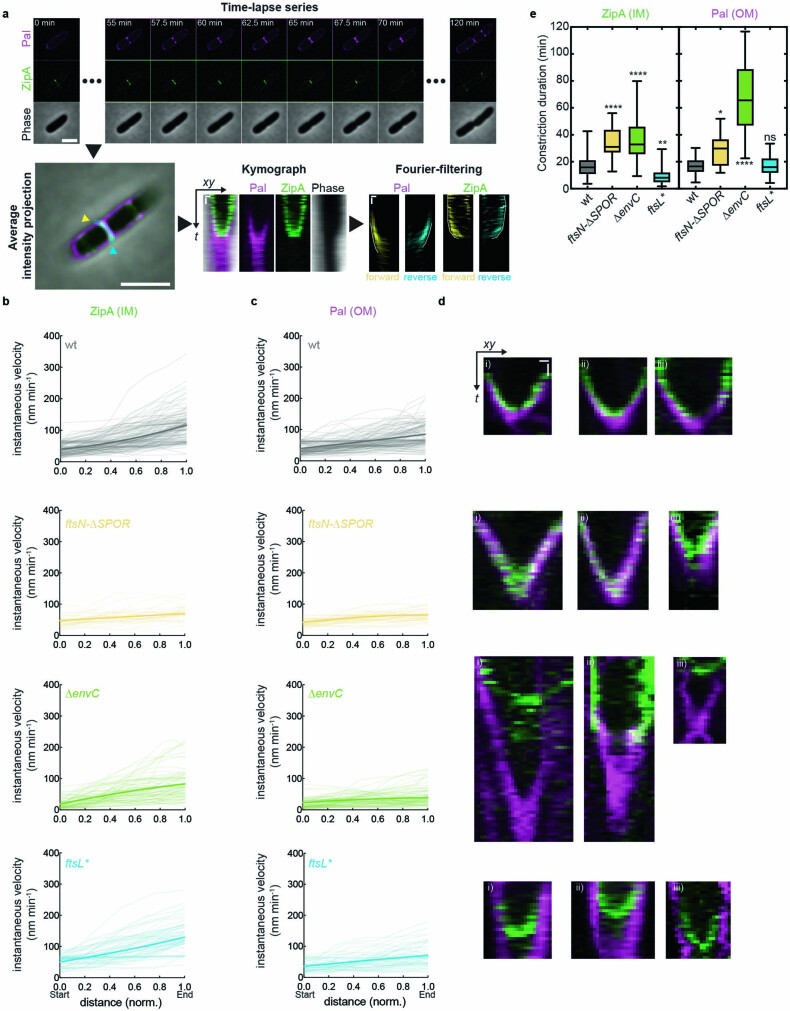
First, time-lapse series and Z -stacks were drift corrected using a customized StackReg plugin in Fiji 70 , 75 . Subsequently, fluorescence images were deconvolved using the classical maximum likelihood estimation algorithm in Huygens Essential v19.10 (SVI), employing an experimentally derived point spread function (PSF) from 100 nm TetraSpeck beads (Thermo Fisher Scientific). Image reconstruction was performed over 50 iterations with a quality threshold of 0.01 and a signal-to-noise ratio set to 20 for live-cell imaging and 40 for fluorescent cell wall probes in fixed samples. Background removal was set to 0 to preserve fluorescence intensity values best among different images. Chromatic aberrations between different fluorescent wavelengths were post-corrected using the chromatic aberration corrector in Huygens from the TetraSpeck bead template. The same image reconstruction parameters and chromatic aberration templates were applied to images that were compared to each other. Last, reconstructed fluorescence images were merged back to phase-contrast images and rendered for figure or movie display with Fiji. Measuring cell envelope constriction dynamics Fluorescent fusions to IM-anchored protein ZipA and OM-lipoprotein Pal allowed us to determine the respective positions of the different cell envelope layers during division. These cell envelope fiducial markers accumulate specifically during cytokinesis at the division site, which was critical for the generation of kymographs. Constriction dynamics of IM and OM were derived from kymographs generated using the Fiji plugin ‘KymographClear’ 76 and automatically split into forward and reverse trajectories using Fourier filtering. This filtering step allowed us to measure the constriction rate for each side independently. Constriction kinetics were derived by automatically extracting the fluorescent trajectories for ZipA and Pal using ‘KymographDirect’ 76 (Extended Data Fig. 4a ). Anisotropy of the division process was determined by taking the ratio of the constriction velocities between the forward and reverse trajectories. Only cells where the division site displayed minimal signs of displacement except for constriction were analysed to eliminate confounding effects on the analysis by excessive cell movement (for example, pushing). This manual exclusion resulted in the rejection of approximately 15–20% of the cell division events. Applying these procedures, we found the constriction rate of the OM to be increasing over time, in contrast to a previously reported constant rate 77 . This might be explained by different image analysis procedures (for example, kymographs vs width measurements, Pal-mCh marker vs a combination of phase-contrast and FM4-64 dyes).
Measuring division site circularity of vertically imaged cells
For vertical imaging of bacterial cells undergoing division, similar procedures as described previously 78 , 79 were applied. A silicon wafer containing 5.5 µm long and 1.5 µm wide photo-resist pillars was generated following high aspect ratio photolithography procedures with an adhesion layer. The dimension of these pillars reaches the practically feasible aspect ratio for photolithography designs and thus impedes increasing pillar length without concomitantly increasing width, precluding use of elongated or chaining division mutants for this imaging mode. A modified silanization surface treatment with plasma cleaning was applied to increase the surface hydrophobicity of the silicon wafer to minimize agarose accumulation. Agarose micro holes were generated by pouring degassed 6% agarose (w/v) in H 2 O on the silicon wafer. Agarose was allowed to solidify for 40 min at r.t., was peeled off, cut into 5 ×5 mm pieces, and incubated in M9 medium supplemented with 0.2% d -glucose, casamino acids, 25 µg ml −1 chloramphenicol and 50 µg ml −1 ampicillin overnight. Cells were grown as described for sample preparation for live-cell imaging and added on agarose pads. Cells that were not trapped in micro holes were washed off gently using 1 ml of growth medium. Five micrometre spanning Z -stacks (at a 200 nm step size) were acquired and subsequently deconvolved. Circularity quantification was carried using the software package ‘Morphometrics’ 80 . Fluorescence signals were segmented using Laplacian algorithm in combination with the peripheral fluorescence setting. Circularity ( C ) is calculated in Morphometrics as: documentclass[12pt]{minimal} usepackage{amsmath} usepackage{wasysym} usepackage{amsfonts} usepackage{amssymb} usepackage{amsbsy} usepackage{mathrsfs} usepackage{upgreek} setlength{oddsidemargin}{-69pt} begin{document}$$C = frac{{P^2}}{{4{Pi} times A}}$$end{document} C = P 2 4 Π × A where P is the perimeter and A is the area enclosed by the circle and is a dimensionless measure. A perfect circle displays a circularity of 1, while increasing values correspond to less circular objects. Cells that were trapped tilted in agar holes were manually excluded from the analysis (15 out of 573 analysed cells).
Measuring Z-ring condensation from time-lapse data
Condensation of cytoskeletal elements was addressed using previously described procedures 40 . Briefly, five frames (corresponding to 10 min) from recorded time-lapse series were sum-projected in Fiji. Z-rings in these sum-projected images were then aligned along the length axis and average-intensity-projected into a single image. Fluorescence intensity was measured across the full width along the horizontal axis of the averaged projection image. Intensity values were normalized and their corresponding full width at half maximum (FWHM) values were calculated in MATLAB.
Measuring Z-ring condensation from 3D data
Similar procedures as outlined for measuring Z-ring condensation in time-lapse series were applied. Two micrometre spanning Z -stacks (at a 200 nm step size) were acquired to capture a full 3D view of a cell. Images were restored in Huygens as described above. Image volumes were sum-projected into a single plane, Z-rings extracted, aligned and averaged as described above. Fluorescence intensity profiles were measured identically as for time-lapse data. Snapshots for 3D maximum intensity projections were rendered in Huygens.
Measuring cell wall synthesis rates by biorthogonal MurNAc-alkyne probes
Septal cell wall synthesis rates were measured as described previously 81 , 82 . MurNAc-alkyne was purchased as a custom synthesis product from Tocris following the procedures of ref. 81 . All experiments were carried out in ∆murQ background and in the presence of pCF436 83 for IPTG-inducible expression of AmgK and MurU. Filamentation was induced by expressing the FtsZ antagonist sulA from arabinose-inducible plasmid pNP146 74 . Overnight cultures were back diluted 1:1,000 into fresh LB containing 15 µg ml −1 gentamycin. Cells were grown at 37 °C until OD 600 = 0.4. Subsequently, 1.5 ml of cells were collected (2 min, 5,000 × g , r.t.) and resuspended in 300 µl LB containing 1 mM IPTG and 0.5 mM HADA to label all cell wall material with FDAAs. For filamentation experiments, SulA expression was induced by the addition of 0.2% l -arabinose. Samples were incubated by rotating at 37 °C for 30 min. Endogenous UDP-MurNAc production was inhibited by the addition of 200 µg ml −1 fosfomycin. After 10 min incubation, cells were washed twice in 1.5 ml LB, 1 mM IPTG and 200 µg ml −1 fosfomycin. Next, cells were incubated for 15 min in the presence of 0.2% (w/v) MurNAc-alkyne, 1 mM IPTG and 200 µg ml −1 fosfomycin at 37 °C. Cells were fixed using ice-cold 70% (w/v) ethanol for 20 min at 4 °C. Next, cell pellets were washed 3× with 1x PBS. Biorthogonal MurNAc-alkyne probes were labelled by click chemistry using 5 µM Alexa488 azide substrate according to the manufacturer's instruction. Samples were stored in 20 µl PBS at 4 °C and imaged within 48 h of the labelling experiment. Samples were imaged on a Nikon Ti2-E inverted widefield microscope equipped with a Lumencor Spectra III light engine, Semrock dichroics (LED-CFP/YFP/mCherry-3X-A-000, LED-DA/FI/TR/Cy5/Cy7-5X-A-000) and emission filters (FF01-432/36, FF01-515/30, FF01-544/24). Images were recorded using a 1.45 NA Plan Apo ×100 PH3 oil objective with Olympus Type F immersion oil and a pco.edge 4.2bi back illuminated cooled sCMOS camera using Nikon Elements 5.2. One micrometre spanning Z -stacks (separated by 200 nm) were acquired and subsequently deconvolved as described above. Z -stacks were sum-projected using Fiji. De novo septal PG synthesis was assessed by measuring the mean fluorescence intensity of NAM-Alexa488 along the division site using the line tool (width, 3 pixels). Levels of cell wall hydrolysis were assessed by measuring the overall reduction in HADA fluorescence as compared to baseline signal intensity derived from fixing cells before MurNAc-alkyne chase. Reduction in fluorescence intensity of FDAAs is indicative of cell wall remodelling mediated by amidases, endopeptidases or transglycosylases. Measuring cell wall remodelling by FDAA incorporation For FDAA pulse-chase experiments, cells grown overnight were back diluted 1:1,000 in fresh LB and grown until OD 600 = 0.4 at 37 °C. For the filamentation experiment, sulA was expressed from pNP146 74 by the addition of 0.2% l -arabinose to cultures during the last 10 min of the incubation period. Subsequently, 1.5 ml of cells were collected (2 min, 5,000 × g , r.t.) and resuspended in 300 µl LB containing 0.5 mM YADA. Samples were incubated while rotating at 37 °C for 40 min. Cells were washed once in 1.5 ml LB and resuspended in 300 µl LB containing 0.5 mM HADA. Samples were incubated at 37 °C for either 2 min, 4 min or 8 min before immediate fixation with 70% ethanol. After fixation, cells were washed 3× in PBS, stored in the dark at 4 °C and imaged within 48 h. The same image acquisition and analyses procedures were carried out as described for MurNAc-alkyne probes. Fluorescence intensity values were fit to a linear regression for HADA and an exponential one-phase decay for YADA. Levels of cell wall hydrolysis were assessed by subtracting the average fluorescence intensity from cells fixed before chase (0 min) and the respective time point, and fit to a linear regression model. Reduction in fluorescence intensity of FDAAs is indicative of cell wall remodelling mediated by amidases, endopeptidases or transglycosylases. In addition to the division site, fluorescence intensity measurements were also performed along the side wall and polar region of the cells at the 8 min time point. For filamenting cells, HADA fluorescence intensity values were fit to a Malthusian exponential equation, assuming cells keep elongation at the same rate before SulA induction.
Bulk growth curve measurements
Overnight cultures of indicated E. coli strains were grown in LB supplemented with appropriate antibiotics at 37 °C. The next day, cells were collected by centrifugation (2 min, 5,000 × g , r.t.) and washed 2× with the respective growth medium (M9 or LB). Day cultures were back diluted (1:1,000) and grown in the respective media supplemented with corresponding IPTG concentration (50 µM for ZipA-sfGFP induction, 1 mM for AmgK/MurU expression) and appropriate antibiotics at 30 °C until OD 600 = 0.3. Cells were collected (2 min, 5,000 × g , r.t.) and resuspended to an initial OD 600 of 0.01 in a final volume of 100 µl. Growth curves were measured in a Tecan M-plex 96-well plate reader by OD 600 read out. Plates were incubated with shaking at 30 °C for a total of 18 h.
Cell shape quantification analyses
Bacterial cells were segmented and analysed from phase-contrast images using the software package ‘Morphometrics’ 80 . Results from Morphometrics were post-processed using customized MATLAB scripts to exclude erroneously segmented cell debris in live-image data on the basis of area. Cell width, length and pole curvature per segmented cell were directly extracted from Morphometrics. Since curvature ( documentclass[12pt]{minimal} usepackage{amsmath} usepackage{wasysym} usepackage{amsfonts} usepackage{amssymb} usepackage{amsbsy} usepackage{mathrsfs} usepackage{upgreek} setlength{oddsidemargin}{-69pt} begin{document}$$k = frac{1}{r}$$end{document} k = 1 r , where r is the radius of the cell cylinder) is dependent on the cell cylinder width, curvature values were normalized by multiplying half-cell width to each respective curvature value. Thus, spherical poles display curvature values of k = 1, while pointy (elongated) poles display elevated curvature values ( k > 1) and flat (shortened) poles display reduced curvature values k < 1, respectively. We obtained division site curvature from both sides of the cell at the invagination site. The invagination site is defined as the narrowest segment of the cell, for example, lowest cell width value, that presents negative curvature on both sides of the cell body. Division site curvature was normalized to the half-cell width of the invagination site.
SIM-TIRF microscopy and MreB tracking
Samples were prepared as described for live-cell imaging. To block cell division, sulA was expressed from pNP146 74 by the addition of 0.2% l -arabinose during the last 10 min of the incubation period. Cells were added to high precision #1.5 coverslips (Marienfeld) and placed on a 1% (w/v) agarose pad in M9 (0.2% d -glucose, casamino acids, supplemented with 0.2% l -arabinose for filamentation experiments) and imaged at room temperature on a Nikon Ti2 N-SIM microscope equipped with N-SIM spatial light modulator illuminator, TIRF Lun-F laser combiner with 488 and 561 nm laser lines, an N-SIM 488/561 dual band dichroic mirror, SR HP Apo TIRF ×100 1.5 NA oil objective with automated correction collar and a Hamamatsu Orca Flash 4.0 camera attached to a Cairn Research Twimcam splitter with an ET525/50m or an ET605/70m emission filter (for MreB-sw-mNeonGreen or Pal-mCherry fusion, respectively). The refractive index of the immersion oil (1.512) (GE Healthcare) was optimized for MreB-sw-mNeonGreen signal and corrected using the automated correction collar for the Pal-mCherry fusion. Alignment of the 488 and 561 lasers for SIM-TIRF and 3D-SIM, and of the N-SIM optics and illumination was performed before each experiment at the image plane. First, a 3 min time-lapse series (at 3 s acquisition frame rate) in SIM-TIRF mode was collected using 20% laser power with 100 ms exposure time to follow MreB-sw-mNeonGreen dynamics. Then, a single slice of a 3D-SIM Pal-mCherry (40% laser power, 100 ms exposure) and a brightfield reference image was acquired. Raw fluorescence images were reconstructed using Nikon Elements 5.11 acquisition software with indicated settings: MreB illumination contrast 0.8, noise suppression 0.3 and blur suppression 0.05; Pal illumination contrast 3.75, noise suppression 0.1 and blur suppression 0.5. Only reconstructed images with a quality score ≥8 and passed SIMcheck quality test 84 were used for further analysis. Subsequently, MreB time-lapse series were overlayed over the reference channels in Fiji. Particle tracking was performed in Fiji using the TrackMate v6.0.1 plugin 85 . MreB filaments were detected using the LoG-detector with an estimated radius of 0.3 µm. Spurious spots were filtered using a quality threshold of 50. Spots were linked using a Kalman filter with an initial search radius of 0.2 µm and search radius of 0.1 µm. No frame gaps were allowed. Only tracks consisting of ≥4 continuous spots (12 s) and that travelled less than 1 µm in total distance were kept for further analysis. To analyse the nature of the displacement of each track, the mean square displacement (MSD) was calculated using the MATLAB class msdanalyzer 86 . Slopes ( α ) of the individual MSD curves were extracted using the log-log fit of the MSD and the delay time τ . As the maximum delay time of 75% of the track length was used, tracks with an documentclass[12pt]{minimal} usepackage{amsmath} usepackage{wasysym} usepackage{amsfonts} usepackage{amssymb} usepackage{amsbsy} usepackage{mathrsfs} usepackage{upgreek} setlength{oddsidemargin}{-69pt} begin{document}$$R^2,{{{mathrm{for}}}},{{{mathrm{log}}}}left[ {mathrm{MSD}} right]$$end{document} R 2 for log MSD versus log[ t ] below 0.95 indicative of a poor fit to the MSD curve were excluded from the analysis. MreB filaments engaged in active cell wall synthesis are displaced by the enzymatic activities of RodA and PBP2b 41 – 43 , hence their MSD curves display slopes of α ≈ 2 indicative of a transported particle motion above the rate of Brownian diffusion (Extended Data Fig. 10b). MreB filaments in constricting cells, as determined by the presence of Pal-mCherry foci at the division site, were analysed by fitting a 200 nm wide region of interest to the cell division site. Directional MreB tracks were deemed to contribute to the elongation of the division site. Early and late division stages were distinguished by the presence of two separated Pal foci or a continuous fluorescent signal across the cell, respectively.
Statistical analysis
All data measurements were plotted and analysed using GraphPad Prism 9 (Version 9.3.1). In general, (log-) normal distribution was tested using Shapiro-Wilk test. For comparisons of two groups, significance was determined by two-tailed, unpaired Student’s t -test with Welch correction and F -test for variance analysis. One-way analysis of variance (ANOVA) was used for comparison of more than two groups using the recommended post-test for selected pairwise comparisons. All experiments were carried out with at least 3 independent biological replicates. P values less than 0.05 were considered statistically significant. Reporting summary Further information on research design is available in the Nature Research Reporting Summary linked to this article.
Supplementary information Supplementary Information Supplementary Figs. 1–10, Tables 1–6 and Video legends 1–8. Reporting Summary Supplementary Video 1 Supplementary Video 1. In situ cell division of wild-type E. coli .
Cryo-electron tomograms of wt
E. coli . Time-lapse series were acquired at a rate of 7 fps in the compressed format m4v for visualization purposes. Green, cyan and magenta layers indicate segmented IM, PG and OM, respectively. Scale bars, 100 nm. Supplementary Video 2 Supplementary Video 2. Fluorescence live-cell imaging of cell envelope constriction in E. coli division mutants. Three time-lapse series of each indicated E. coli mutants acquired at a 2:30 min:sec acquisition interval are shown. Bacteria were imaged at 30 °C on 1% agarose in M9 supplemented with 0.2% casamino acids and d -glucose. Fluorescence channels (Pal-mCherry, magenta; ZipA-sfGFP, green) were deconvolved. The video was rendered at 12 fps. Scale bar, 2 µm. Supplementary Video 3 Supplementary Video 3. In situ cell division of ftsN-∆SPOR. Cryo-electron tomograms of ftsN-∆SPOR mutant. Time-lapse series were acquired at a rate of 7 fps in the compressed format m4v for visualization purposes. Green, cyan and magenta layers indicate segmented IM, PG and OM, respectively. Scale bars, 100 nm. Supplementary Video 4 Supplementary Video 4. In situ cell division of ∆envC ∆nlpD . Cryo-electron tomograms of ∆envC ∆nlpD mutant. Time-lapse series were acquired at a rate of 7 fps in the compressed format m4v for visualization purposes. Green, cyan and magenta layers indicate segmented IM, PG and OM, respectively. Scale bars, 100 nm. Supplementary Video 5 Supplementary Video 5. In situ cell division of ftsL* . Cryo-electron tomograms of ftsL* mutant. Time-lapse series were acquired at a rate of 7 fps in the compressed format m4v for visualization purposes. Green, cyan and magenta layers indicate segmented IM, PG and OM, respectively. Scale bars, 100 nm. Supplementary Video 6 Supplementary Video 6. Cell wall hydrolysis contributes to Z -ring condensation. Three-dimensional maximum intensity projections rendered in Huygens (SVI) of indicated E. coli strain expressing Pal-mCherry (magenta) and ZipA-sfGFP (green) are shown. The video was rendered at 12 fps. Scale bar, 2 µm. Supplementary Video 7 Supplementary Video 7. MreB filament increase in cells with blocked cell division. Cell division was inhibited by expressing SulA using 0.2% l -arabinose. A three-minute SIM-TIRF time-lapse series of MreB-sw-mNeonGreen (green) was overlayed over a bright field reference image. The video was rendered at 12 fps. Scale bar, 2 µm. Supplementary Video 8 Supplementary Video 8. MreB filaments regularly pass either through or in direct proximity of the cell division site. A three-minute SIM-TIRF time-lapse series of MreB-sw-mNeonGreen (green) was overlayed over a 3D-SIM image of Pal-mCherry (magenta) and bright field reference image. On the right side, tracking results from TrackMate are overlayed. The video was rendered at 12 fps. Scale bar, 1 µm.
Supplementary information The online version contains supplementary material available at 10.1038/s41564-022-01210-z.
📊 Figures
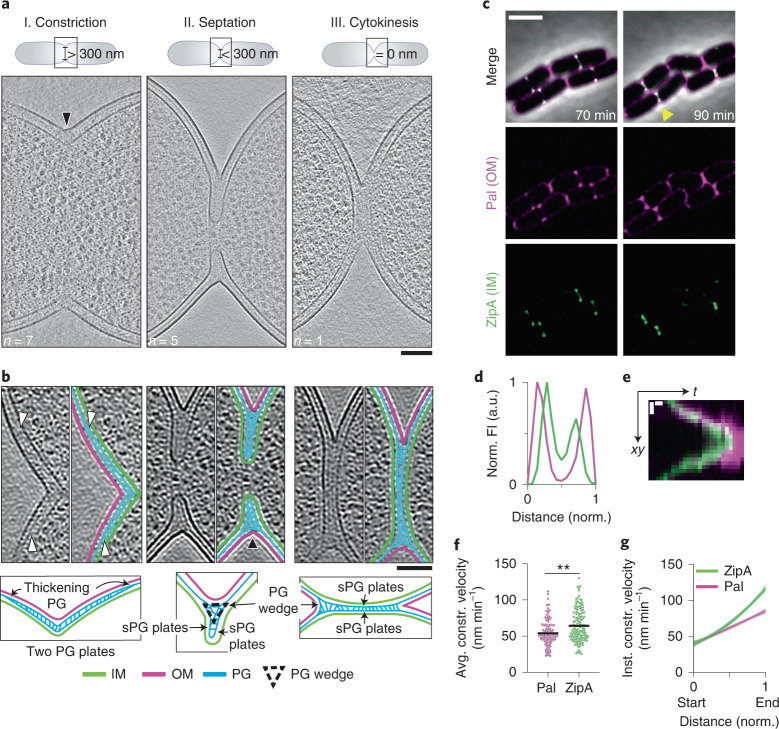
Fig. 1
In situ cell envelope architecture and dynamics during E. coli cell division.
a , Overview of different stages of cell division. Summed, projected central slices of cryo-electron tomograms visualizing different stages in division of wild-type E. coli are shown. Black arrowhead ...
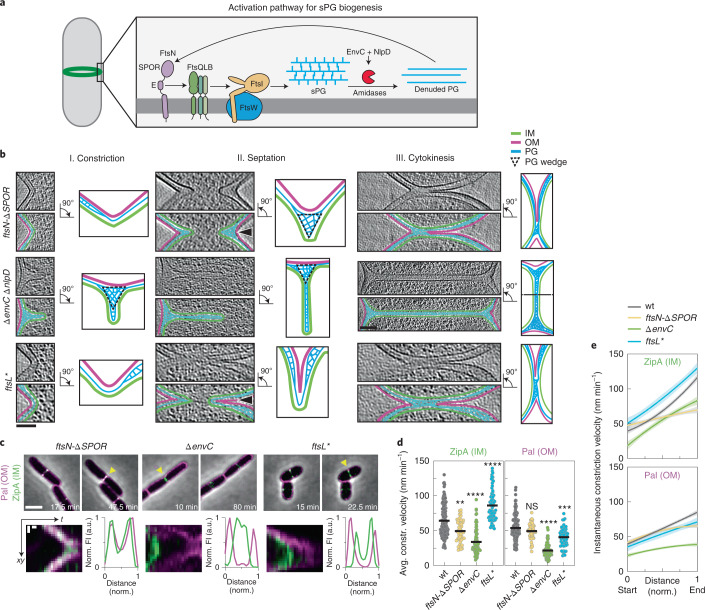
Fig. 2
Divisome mutants display altered division site ultrastructure and constriction kinetics in E. coli .
a , Schematic overview of the septal PG loop pathway for the activation of sPG synthesis (see text for details). b , Left: NAD-filtered cryo-electron tomograms of division sites in the indicated divis...
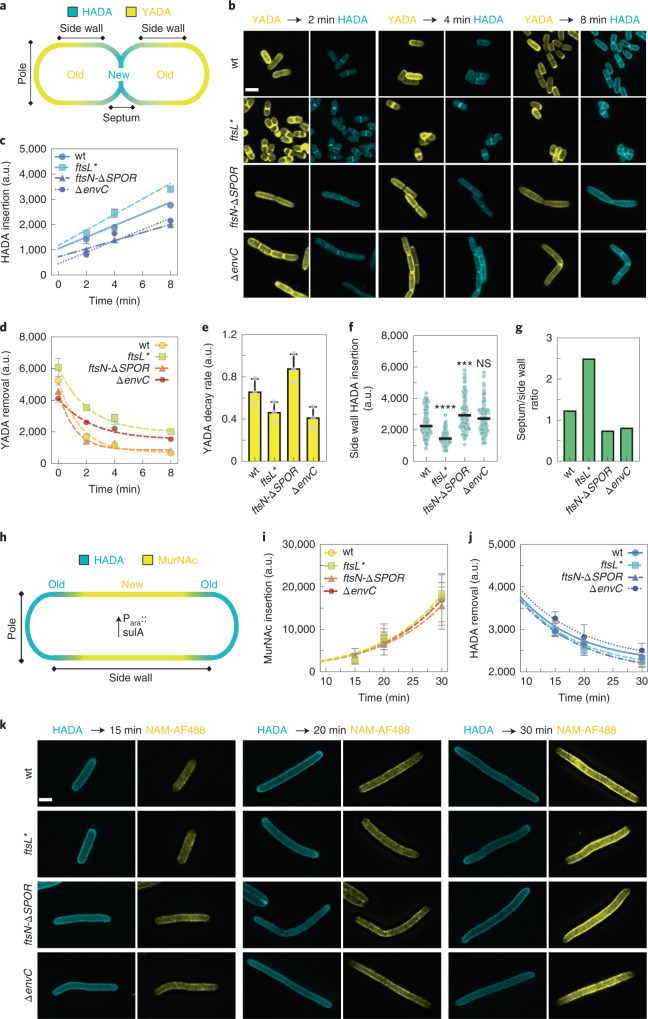
Fig. 3
Measuring cell wall synthesis and hydrolysis rates during division and elongation in E. coli .
a , Labelling patterns observed for an FDAA pulse-chase experiment. New cell wall material is labelled with HADA (blue), while old material is stained with YADA (yellow). b , Representative images fro...
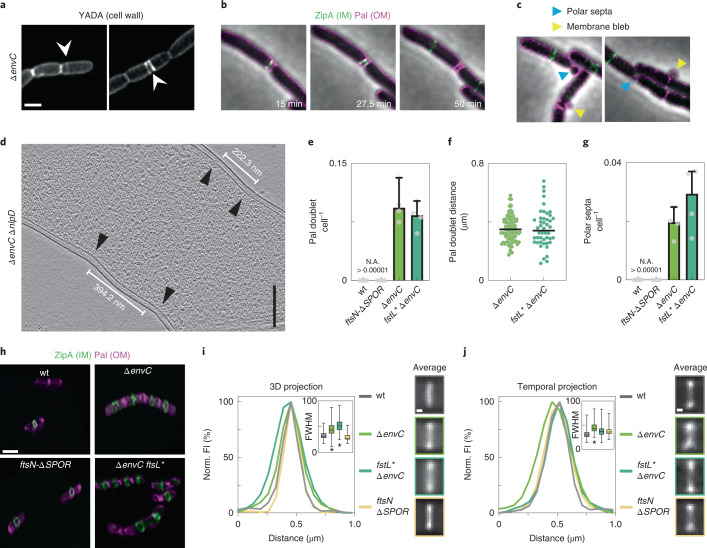
Fig. 4
sPG hydrolysis is required for normal Z-ring placement and condensation in E. coli .
a , Distribution of cell wall material in u2206envC cells was assessed by FDAA staining in 3 biological replicates. Images are sum-projections of a 1u2009u00b5m spanning z -stack and were deconvolved....
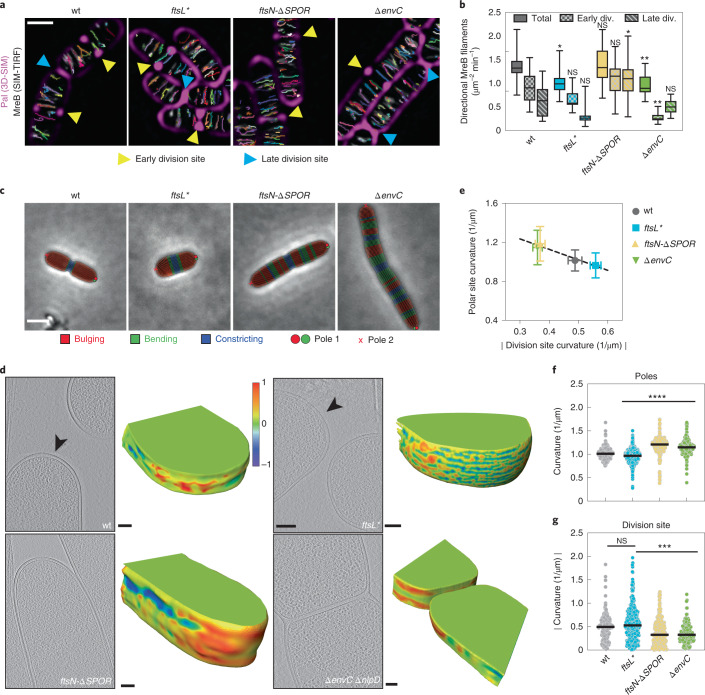
Fig. 5
Competition between the divisome and elongation machinery defines polar cell shape in E. coli .
a , MreB dynamics were followed by SIM-TIRF in indicated strains (see Methods). Time-lapse series were sum projected and overlayed with single-particle tracking results from TrackMate and 3D-SIM Pal-m...
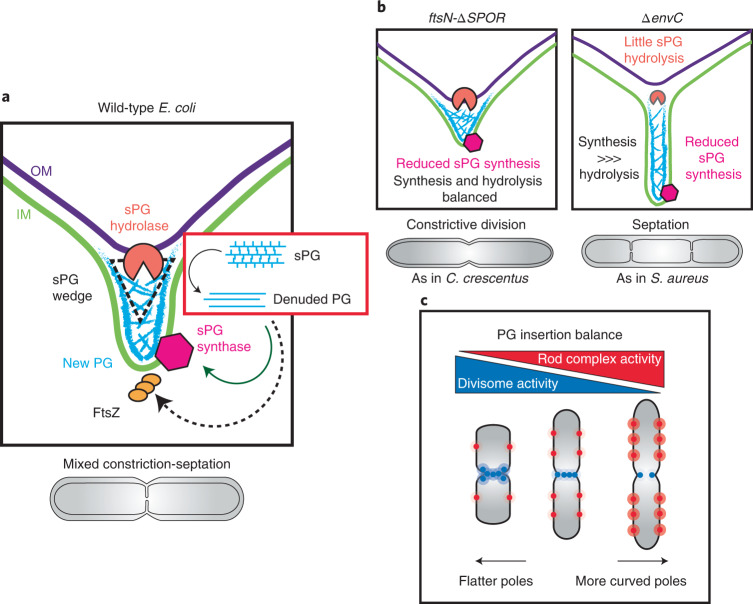
Fig. 6
Septal PG architecture and divisome activity modulate bacterial morphogenesis in E. coli .
a , Wild-type E. coli divides via a mixed constriction-septation mechanism in which a partial septum with two discernible plates of sPG is formed at later stages of the division process. A wedge struc...
Extended Data Fig. 1
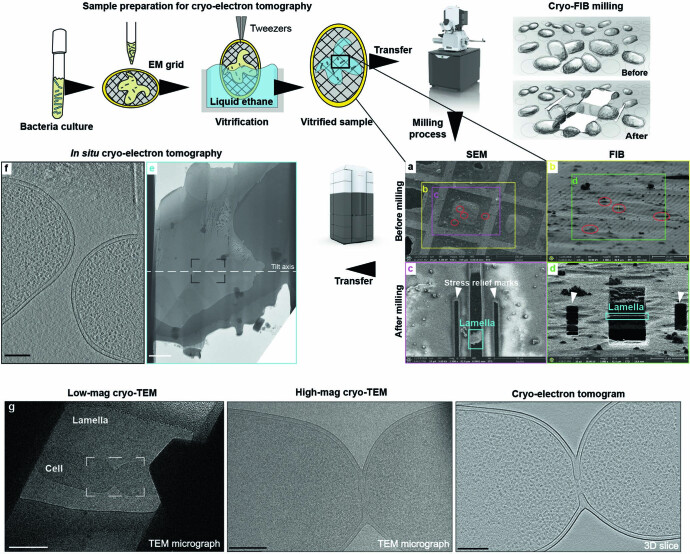
Cryo-FIB / cryo-ET pipeline utilized in this study.
Schematic cartoons showing the steps in sample preparation for cryo-ET. In brief, bacteria are grown to OD 600 =u20090.3 and applied onto an EM grid for vitrification in liquid ethane 56 . Cryo-EM gri...
Extended Data Fig. 2
Distance measurements in cryo-ET data of dividing E. coli cells.
Three dimensional slices visualizing the division site during ( a ) constriction, ( b ) septation and ( c ) cytokinesis. Dashed white line indicates OM-OM distance and white bold line indicates IM-IM ...
Extended Data Fig. 3
Subtomogram averaging, NAD filtering and segmentation of the cell envelope of E. coli .
( a ) STA 3D structure of the cell envelope at the septum and side wall are displayed in Chimera using solid and surface rendering. 3D slices of averages are shown. 212 particles contributed to the se...
Extended Data Fig. 4
Measuring cell envelope constriction from kymograph data.
( a ) Schematic representation of workflow for the generation of kymographs using Kymoclear and KymogrphaDirect software. Instantaneous constriction velocity for ( b ) IM (ZipA-sfGFP) and ( c ) OM (Pa...
Extended Data Fig. 5
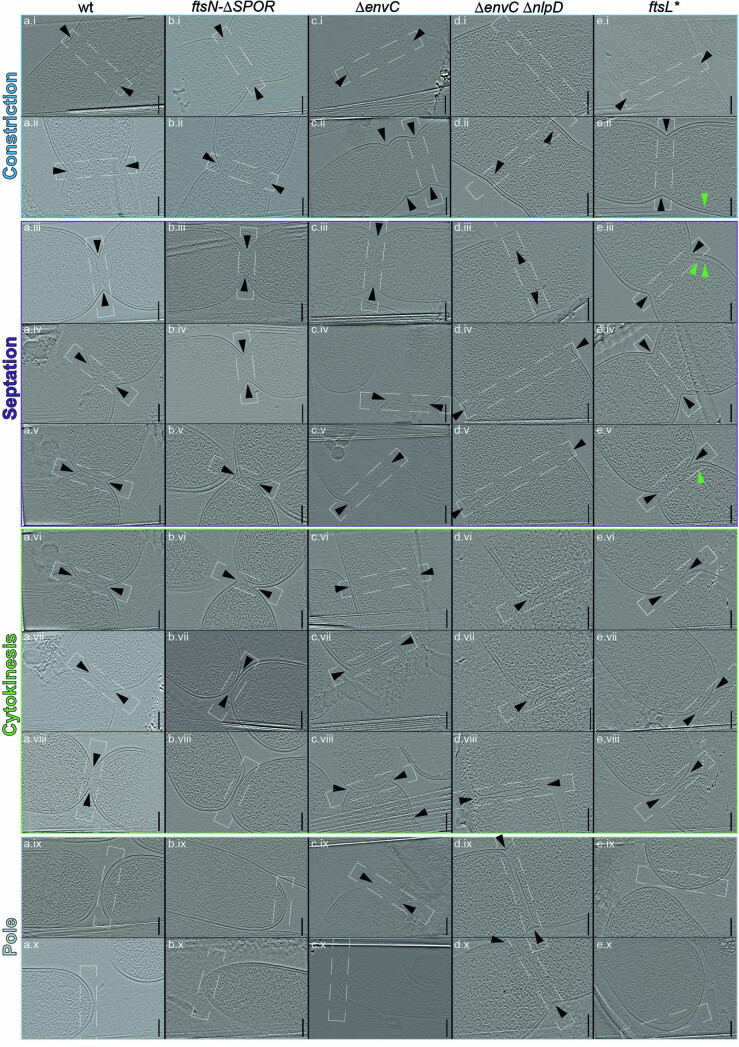
Cell division and polar morphology of E. coli viewed by cryo-ET.
Gallery of summed projected central slices of cryo-electron tomograms visualizing the indicated division mutants. Black arrowhead = division site; green arrowhead = envelope bulging. Dashed white box ...
Extended Data Fig. 6
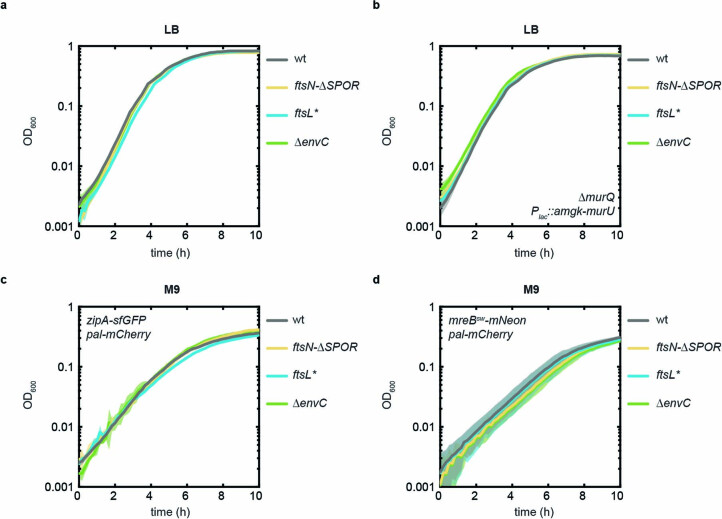
Measuring bulk growth rates of E. coli cell division mutants analyzed in this study.
Growth curves were measured in biological triplicates by OD 600 readings in a 96-well plate reader at 30 u00b0C. Data is represented as meanu2009u00b1u2009SD. ( a ) Untagged strains used for cryo-ET a...
Extended Data Fig. 7
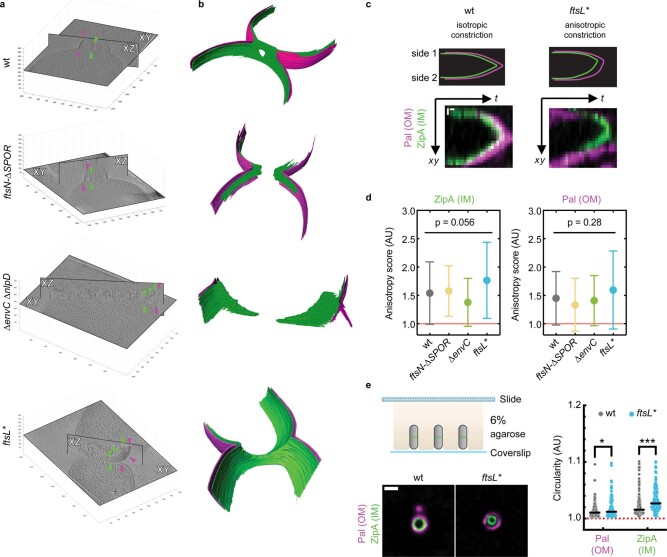
A hyperactivated divisome leads to anisotropic cell envelope constriction.
( a ) Orthogonal views of XZ and XY slices of 3D cryo-electron tomograms of the indicated division mutants. Magenta and green arrowheads indicate OM and IM, respectively. 3D volumes are displayed in c...
Extended Data Fig. 8
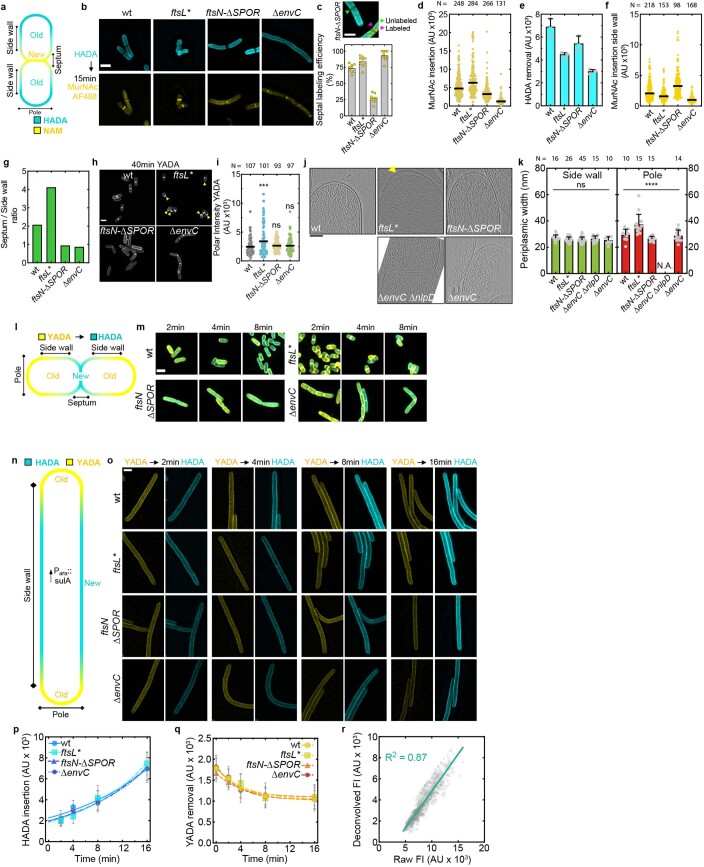
Cell wall synthesis and hydrolysis measurements.
( a ) New and old cell wall material were detected with Alexa488 labelled MurNAc-alykyne (yellow) or HADA (blue), respectively. ( b ) Representative images from labeling. ( c ) Label incorporation at ...
Extended Data Fig. 9
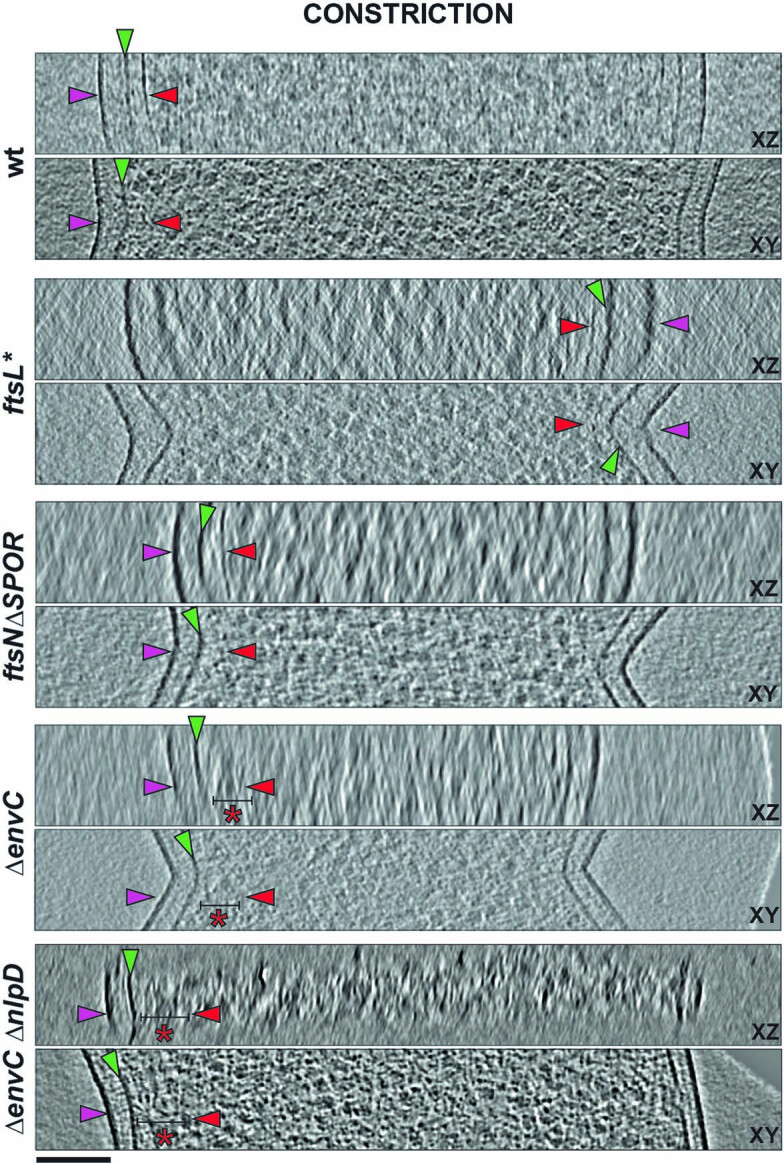
Z-ring views during constriction in cryo-electron tomograms of E. coli .
Summed projections of 10 slices of XZ and XY views during constriction of indicated strains. Representative examples of all strains are shown. Green arrowheads indicate IM, magenta arrowheads indicate...
Extended Data Fig. 10
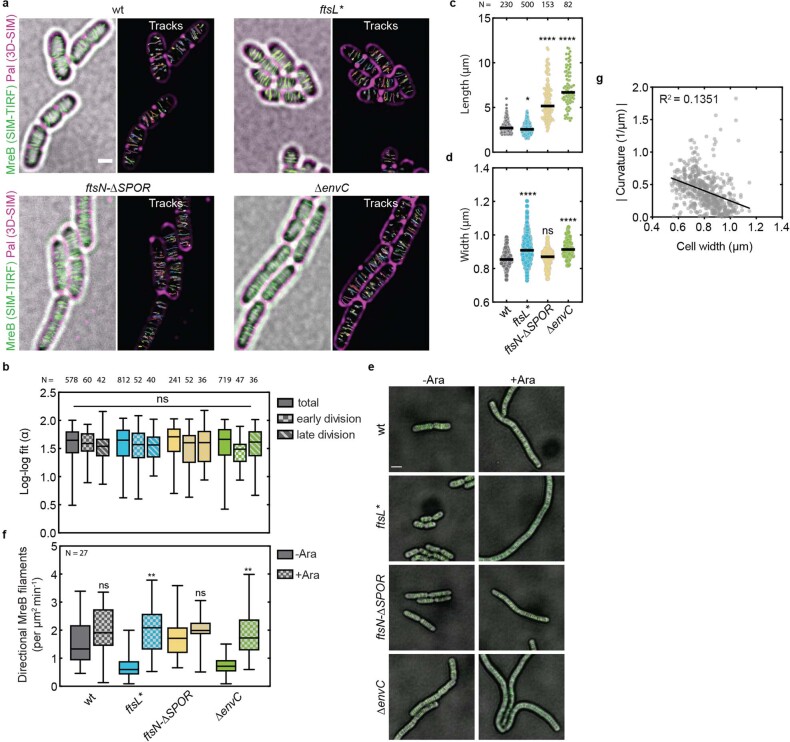
The balance between elongation and division affects cell morphology.
( a ) MreB-sw-mNeonGreen dynamics were followed by SIM-TRIF microscopy for 3u2009min at 3u2009s acquisitions per frame in indicated mutants. Time-lapse series was sum-projected and overlayed over a 3D...
Figure images are served from the NIH/NLM PubMed Central Open Access Subset or Europe PMC; copyright remains with the publishers and authors.
💬 Discussion
0 commentsNo comments yet. Be the first to start a discussion!
Leave a Comment