Abstract
The mechanisms by which the diffusion rate in the plasma membrane (PM) is regulated remain unresolved, despite their importance in spatially regulating the reaction rates in the PM. Proposed models include entrapment in nanoscale noncontiguous domains found in PtK2 cells, slow diffusion due to crowding, and actin-induced compartmentalization. Here, by applying single-particle tracking at high time resolutions, mainly to the PtK2-cell PM, we found confined diffusion plus hop movements (termed “hop diffusion”) for both a nonraft phospholipid and a transmembrane protein, transferrin receptor, and equal compartment sizes for these two molecules in all five of the cell lines used here (actual sizes were cell dependent), even after treatment with actin-modulating drugs. The cross-section size and the cytoplasmic domain size both affected the hop frequency. Electron tomography identified the actin-based membrane skeleton (MSK) located within 8.8 nm from the PM cytoplasmic surface of PtK2 cells and demonstrated that the MSK mesh size was the same as the compartment size for PM molecular diffusion. The extracellular matrix and extracellular domains of membrane proteins were not involved in hop diffusion. These results support a model of anchored TM-protein pickets lining actin-based MSK as a major mechanism for regulating diffusion.
🔬 Techniques
🔭 Microscopes
🧬 Organisms
💻 Software
✨ Fluorophores
🧪 Sample Preparation
🔬 Cell Lines
🏭 Microscope Brands
🧪 Reagent Suppliers
🔎 Objectives
💻 Software Details
🏛️ Research Organizations (ROR)
Affiliated research institutions:
📋 Methods
Cell culture NRK fibroblasts and human
T24 epithelial cells were grown in Ham’s F-12 medium (Sigma-Aldrich, St. Louis, MO) supplemented with 10% fetal bovine serum (FBS; Sigma-Aldrich). The T24 cells are the same as the ECV304 cells used in Murase et al . (2004) , which were erroneously regarded as an endothelial cell line but were previously reported to be a subclone of T24 epithelial cells ( Tanabe et al ., 1999 ). PtK2 (rat kangaroo kidney) epithelial cells and human HeLa epithelial cells were grown in Eagle’s MEM (Sigma-Aldrich) supplemented with 10% FBS, 0.1 mM nonessential amino acids (Gibco/Invitrogen, Carlsbad, CA), and 1 mM sodium pyruvate (Gibco/Invitrogen). Mouse kidney HEPA-OVA epithelial cells were grown in DMEM (Sigma-Aldrich) supplemented with 10% FBS. All cell lines were cultured on 12-mm-diameter glass-bottom dishes (IWAKI, Tokyo, Japan) for SFMT or 18 × 18–mm coverslips (IWAKI) for SPT, and single-molecule observations were performed 2 d after inoculation. For SFMT of the PtK2, HeLa, and HEPA-OVA cells, the MEM or DMEM was replaced by Ham’s F-12 medium containing 10% FBS at 1 d before observation. This procedure considerably decreased the level of autofluorescence in these cells. Cell treatments to remove cell-surface proteins with trypsin, modulate the actin cytoskeleton, and form PM blebs The extracellular domains of membrane proteins and the extracellular matrix were partially removed by treating cells with low concentrations of trypsin (the exact concentrations differed, depending on the cell type; see later description), in Hanks’ balanced salt solution (HBSS; Nissui, Tokyo, Japan) buffered with 2 mM 1,4-piperazinediethanesulfonic acid (PIPES), pH 7.2 (HP medium), which did not detach the cells from the coverslips, using the protocols described by Fujiwara et al . (2002) and Murase et al . (2004) . To monitor the extent of cleavage, the extracellular surface proteins, including both the extracellular domains of membrane proteins and extracellular matrix proteins, were first tagged with sulfosuccinimidyl-biotin (Sigma-Aldrich) and were visualized by Alexa 488–streptavidin (Molecular Probes, Eugene, OR) before and after trypsin treatment. Collagen type I was detected by the indirect immunofluorescence method, using a polyclonal rabbit anti–collagen type I antibody (Novus Biologicals, Littleton, CO) and a rhodamine–goat anti-rabbit antibody (Cappel, Irvine, CA). Chondroitin sulfate glycosaminoglycan was detected using CS-56 mouse anti–chondroitin sulfate immunoglobulin G (Seikagaku, Osaka, Japan) and a Rhodamine Red-X donkey anti-mouse antibody (Jackson ImmunoResearch, West Grove, PA). Epifluorescence images of cells were captured by MetaMorph software (Molecular Devices, Downingtown, PA), and fluorescence intensity was quantitated. When NRK cells were treated with 25 μg/ml trypsin at 37°C for 10 min, 61% of the extracellular surface proteins were removed. For the removal of 51% of the extracellular surface proteins of PtK2 cells, the required trypsin concentration was as high as 200 μg/ml (37°C for 10 min). Cytochalasin D, latrunculin A, and jasplakinolide, kindly provided by Gerard Marriott (University of California, Berkeley, CA), were used for the modulation of the actin cytoskeleton. Cytochalasin D caps the barbed end to block the interaction of actin with barbed end–binding proteins and inhibits the polymerization at both ends of actin filaments, whereas latrunculin A binds to actin monomers, inhibiting their participation in the actin polymerization reaction ( Ayscough, 1998 ) and thus reducing the level of actin polymerization. Jasplakinolide stabilizes actin filaments ( Bubb et al ., 2000 ). These drug treatments were performed during observation by microscopy at 37°C, and, unless otherwise stated, single-molecule tracking experiments were initiated 5 min after adding these drugs and were completed within 10, 15, and 30 min, depending on the type of experiment. PM blebs 5–20 μm in diameter in which the MSK was partially depleted were formed by incubating the cells with 1 mM menadione (2-methyl-1,4-naphthoquinone; Sigma-Aldrich) in HP medium at 37°C for 1 h ( Malorni et al ., 1991 ). To further remove the actin-based skeleton, the cells were then treated with latrunculin A as described. Preparation of the fluorescence probes (Cy3-Tf, Alexa 633–Tf, and Cy3-DOPE) and cell surface labeling Human and bovine holo-Tf were purchased from Sigma-Aldrich, Cy3-succinimidyl ester (monofunctional) was from GE Healthcare Biosciences (Pittsburgh, PA), and Alexa 633–succinimidyl ester was from Molecular Probes. To produce Cy3-Tf, 10 μl of a 6.5 mM Cy3 solution in dimethylformamide was added to 200 μl of a 0.5 mg/ml (6.3 μM) Tf solution in 0.1 M carbonate buffer (Na 2 CO 3 -NaHCO 3 , pH 9.0). After an incubation for 60 min at 25°C, the unreacted dye was removed by desalting column chromatography (PD-10; GE Healthcare Biosciences), and equilibrated and eluted with phosphate-buffered saline, and the fractions of the eluate with the dye/protein ratio of 3.9/1 were collected for SFMT observations. Alexa 633–Tf was prepared in the same manner, except that the concentration of Alexa 633 in the reaction mixture was twofold higher, and the eluate with the dye/protein ratio of 7.6/1 was collected. For SFMT observations of Cy3-Tf, after three washes with 1 ml of HP medium, the cells were incubated for 10 min at 37°C in the same medium to remove the Tf molecules prebound to TfR. Cy3-Tf (10 nM) was added to the cells to a final concentration (∼0.1 nM) appropriate for single-molecule observations. The translational diffusion of Cy3-Tf bound to TfR (Cy3-TfR) was observed on the apical cell membrane at 37 ± 1°C immediately after the addition of Cy3-Tf without exchanging the medium. Synthesis of DOPE (Avanti Polar Lipids, Alabaster, AL) conjugated with Cy3-succinimidyl ester (GE Healthcare Biosciences) in the head group region (Cy3-DOPE) and its incorporation into the PM were accomplished according to Fujiwara et al . (2002) and Murase et al . (2004) . SFMT of Cy3-Tf–labeled TfR (Cy3-TfR) and Cy3-DOPE All observations of the cells were performed at 37 ± 1°C for up to 30 min. Individual Cy3 molecules were monitored on the upper PM at video rate (30 Hz), using the oblique illumination mode of a home-built objective lens-type total internal reflection fluorescence microscope ( Iino et al ., 2001 ; Koyama-Honda et al ., 2005 ). Briefly, a 532-nm laser beam (the second harmonic of the Nd:YAG laser beam; model 4501-050; Uniphase, San Jose, CA) was attenuated with neutral density filters, circularly polarized, and then steered into the edge of a high–numerical aperture (NA) oil immersion objective lens (PlanApo 100×/NA 1.45; Olympus, Tokyo, Japan), with a focus at the back-focal plane of the objective lens on an Olympus inverted microscope (IX-70). The precision of the position determination was estimated from the SD of the coordinates of Cy3-Tf adsorbed to a poly- l -lysine–coated coverslip overlaid by a 15% polyacrylamide gel (5% cross-linker; Garcia-Parajo et al ., 2000 ) and was ∼20 nm at a time resolution of 33 ms. To monitor the recruitment of TfR molecules into clathrin-coated pits, T24 cells were transfected with mouse placental clathrin light chain fused to enhanced GFP at the N-terminus (GFP-clathrin; a gift from J. H. Keen, Thomas Jefferson University, Philadelphia, PA; Gaidarov et al ., 1999 ). Simultaneous observations of individual Alexa 633-Tf–labeled TfR and clusters of GFP-clathrin were performed by using the dual-color SFMT setup described by Koyama-Honda et al . (2005) . The two images were spatially corrected and overlaid with an accuracy of 13 nm ( Koyama-Honda et al ., 2005 ).
Show full methods section
Cell culture NRK fibroblasts and human
T24 epithelial cells were grown in Ham’s F-12 medium (Sigma-Aldrich, St. Louis, MO) supplemented with 10% fetal bovine serum (FBS; Sigma-Aldrich). The T24 cells are the same as the ECV304 cells used in Murase et al . (2004) , which were erroneously regarded as an endothelial cell line but were previously reported to be a subclone of T24 epithelial cells ( Tanabe et al ., 1999 ). PtK2 (rat kangaroo kidney) epithelial cells and human HeLa epithelial cells were grown in Eagle’s MEM (Sigma-Aldrich) supplemented with 10% FBS, 0.1 mM nonessential amino acids (Gibco/Invitrogen, Carlsbad, CA), and 1 mM sodium pyruvate (Gibco/Invitrogen). Mouse kidney HEPA-OVA epithelial cells were grown in DMEM (Sigma-Aldrich) supplemented with 10% FBS. All cell lines were cultured on 12-mm-diameter glass-bottom dishes (IWAKI, Tokyo, Japan) for SFMT or 18 × 18–mm coverslips (IWAKI) for SPT, and single-molecule observations were performed 2 d after inoculation. For SFMT of the PtK2, HeLa, and HEPA-OVA cells, the MEM or DMEM was replaced by Ham’s F-12 medium containing 10% FBS at 1 d before observation. This procedure considerably decreased the level of autofluorescence in these cells. Cell treatments to remove cell-surface proteins with trypsin, modulate the actin cytoskeleton, and form PM blebs The extracellular domains of membrane proteins and the extracellular matrix were partially removed by treating cells with low concentrations of trypsin (the exact concentrations differed, depending on the cell type; see later description), in Hanks’ balanced salt solution (HBSS; Nissui, Tokyo, Japan) buffered with 2 mM 1,4-piperazinediethanesulfonic acid (PIPES), pH 7.2 (HP medium), which did not detach the cells from the coverslips, using the protocols described by Fujiwara et al . (2002) and Murase et al . (2004) . To monitor the extent of cleavage, the extracellular surface proteins, including both the extracellular domains of membrane proteins and extracellular matrix proteins, were first tagged with sulfosuccinimidyl-biotin (Sigma-Aldrich) and were visualized by Alexa 488–streptavidin (Molecular Probes, Eugene, OR) before and after trypsin treatment. Collagen type I was detected by the indirect immunofluorescence method, using a polyclonal rabbit anti–collagen type I antibody (Novus Biologicals, Littleton, CO) and a rhodamine–goat anti-rabbit antibody (Cappel, Irvine, CA). Chondroitin sulfate glycosaminoglycan was detected using CS-56 mouse anti–chondroitin sulfate immunoglobulin G (Seikagaku, Osaka, Japan) and a Rhodamine Red-X donkey anti-mouse antibody (Jackson ImmunoResearch, West Grove, PA). Epifluorescence images of cells were captured by MetaMorph software (Molecular Devices, Downingtown, PA), and fluorescence intensity was quantitated. When NRK cells were treated with 25 μg/ml trypsin at 37°C for 10 min, 61% of the extracellular surface proteins were removed. For the removal of 51% of the extracellular surface proteins of PtK2 cells, the required trypsin concentration was as high as 200 μg/ml (37°C for 10 min). Cytochalasin D, latrunculin A, and jasplakinolide, kindly provided by Gerard Marriott (University of California, Berkeley, CA), were used for the modulation of the actin cytoskeleton. Cytochalasin D caps the barbed end to block the interaction of actin with barbed end–binding proteins and inhibits the polymerization at both ends of actin filaments, whereas latrunculin A binds to actin monomers, inhibiting their participation in the actin polymerization reaction ( Ayscough, 1998 ) and thus reducing the level of actin polymerization. Jasplakinolide stabilizes actin filaments ( Bubb et al ., 2000 ). These drug treatments were performed during observation by microscopy at 37°C, and, unless otherwise stated, single-molecule tracking experiments were initiated 5 min after adding these drugs and were completed within 10, 15, and 30 min, depending on the type of experiment. PM blebs 5–20 μm in diameter in which the MSK was partially depleted were formed by incubating the cells with 1 mM menadione (2-methyl-1,4-naphthoquinone; Sigma-Aldrich) in HP medium at 37°C for 1 h ( Malorni et al ., 1991 ). To further remove the actin-based skeleton, the cells were then treated with latrunculin A as described. Preparation of the fluorescence probes (Cy3-Tf, Alexa 633–Tf, and Cy3-DOPE) and cell surface labeling Human and bovine holo-Tf were purchased from Sigma-Aldrich, Cy3-succinimidyl ester (monofunctional) was from GE Healthcare Biosciences (Pittsburgh, PA), and Alexa 633–succinimidyl ester was from Molecular Probes. To produce Cy3-Tf, 10 μl of a 6.5 mM Cy3 solution in dimethylformamide was added to 200 μl of a 0.5 mg/ml (6.3 μM) Tf solution in 0.1 M carbonate buffer (Na 2 CO 3 -NaHCO 3 , pH 9.0). After an incubation for 60 min at 25°C, the unreacted dye was removed by desalting column chromatography (PD-10; GE Healthcare Biosciences), and equilibrated and eluted with phosphate-buffered saline, and the fractions of the eluate with the dye/protein ratio of 3.9/1 were collected for SFMT observations. Alexa 633–Tf was prepared in the same manner, except that the concentration of Alexa 633 in the reaction mixture was twofold higher, and the eluate with the dye/protein ratio of 7.6/1 was collected. For SFMT observations of Cy3-Tf, after three washes with 1 ml of HP medium, the cells were incubated for 10 min at 37°C in the same medium to remove the Tf molecules prebound to TfR. Cy3-Tf (10 nM) was added to the cells to a final concentration (∼0.1 nM) appropriate for single-molecule observations. The translational diffusion of Cy3-Tf bound to TfR (Cy3-TfR) was observed on the apical cell membrane at 37 ± 1°C immediately after the addition of Cy3-Tf without exchanging the medium. Synthesis of DOPE (Avanti Polar Lipids, Alabaster, AL) conjugated with Cy3-succinimidyl ester (GE Healthcare Biosciences) in the head group region (Cy3-DOPE) and its incorporation into the PM were accomplished according to Fujiwara et al . (2002) and Murase et al . (2004) . SFMT of Cy3-Tf–labeled TfR (Cy3-TfR) and Cy3-DOPE All observations of the cells were performed at 37 ± 1°C for up to 30 min. Individual Cy3 molecules were monitored on the upper PM at video rate (30 Hz), using the oblique illumination mode of a home-built objective lens-type total internal reflection fluorescence microscope ( Iino et al ., 2001 ; Koyama-Honda et al ., 2005 ). Briefly, a 532-nm laser beam (the second harmonic of the Nd:YAG laser beam; model 4501-050; Uniphase, San Jose, CA) was attenuated with neutral density filters, circularly polarized, and then steered into the edge of a high–numerical aperture (NA) oil immersion objective lens (PlanApo 100×/NA 1.45; Olympus, Tokyo, Japan), with a focus at the back-focal plane of the objective lens on an Olympus inverted microscope (IX-70). The precision of the position determination was estimated from the SD of the coordinates of Cy3-Tf adsorbed to a poly- l -lysine–coated coverslip overlaid by a 15% polyacrylamide gel (5% cross-linker; Garcia-Parajo et al ., 2000 ) and was ∼20 nm at a time resolution of 33 ms. To monitor the recruitment of TfR molecules into clathrin-coated pits, T24 cells were transfected with mouse placental clathrin light chain fused to enhanced GFP at the N-terminus (GFP-clathrin; a gift from J. H. Keen, Thomas Jefferson University, Philadelphia, PA; Gaidarov et al ., 1999 ). Simultaneous observations of individual Alexa 633-Tf–labeled TfR and clusters of GFP-clathrin were performed by using the dual-color SFMT setup described by Koyama-Honda et al . (2005) . The two images were spatially corrected and overlaid with an accuracy of 13 nm ( Koyama-Honda et al ., 2005 ).
Preparation of gold-Tf and cell surface labeling
Gold-Tf was prepared essentially as described by Fujiwara et al . (2002) . The 40-nm-diameter colloidal gold particles (British BioCell, Cardiff, UK) conjugated with bovine Tf were prepared by mixing 50 μl of 31 μg/ml bovine Tf in 2 mM phosphate buffer, pH 7.2, and 500 μl of colloidal gold suspension (2.8 μg/ml Tf in the mixture). After incubation of the mixture for 1 h at room temperature, the gold-Tf complex was further stabilized with 0.05% Carbowax 20M (Sigma-Aldrich). After two washes by centrifugation and resuspension in 0.05% Carbowax/2 mM phosphate buffer, pH 7.2, the conjugates were resuspended in 0.05% Carbowax 20M/HBSS buffered with 2 mM PIPES, pH 7.2 (observation medium). The gold probe suspension (∼0.05 nM of gold particles; 3 × 10 10 particles/ml) was added to the cells that had been incubated in HP medium for 10 min at 37°C to remove the Tf molecules prebound to TfR. To minimize the effect of cross-linking by the gold probe, the amount of Tf molecules conjugated to a gold particle was reduced until D eff (33ms) 100ms of TfR in PtK2 cells was maximized (PtK2 cells were used because they exhibited a smaller compartment size, ∼45 nm, in our preliminary studies, which would make the cross-linking effect more apparent) while maintaining the number of Gold-Tf molecules specifically bound to the cell surface at a sufficient level for experimental purposes. With a reduction in the Tf concentration incubated with colloidal gold particles, D eff (33 ms) 100 ms was increased and leveled off at 0.30 μm 2 /s at a Tf concentration of ∼2.8 μg/ml. These gold probes exhibited a ratio of specific (Tf-conjugated) versus nonspecific (without Tf conjugation) binding to the PtK2 cells of 4:1 (12.0 vs. 3.0 particles/cell on average). Further reduction of the number of Tf molecules on the gold particle did not substantially increase the diffusion coefficient but did decrease the fraction of specifically bound gold particles, and therefore we used these conditions for the preparation of Gold-Tf throughout this research. Preparation of colloidal gold probes for DOPE diffusion in the PM The preparation of 40-nm-diameter colloidal gold particles conjugated with the Fab fragments of anti-fluorescein antibodies (Molecular Probes), the fluorescein-DOPE synthesis, and the optimization of labeling conditions were performed according to Fujiwara et al . (2002) and Murase et al . (2004) . The gold probe suspension (∼0.05 nM of gold particles) was added to cells that had been preincubated with fluorescein-DOPE, and the translational diffusion of DOPE was recorded immediately after the binding of the gold probe to the fluorescein-DOPE incorporated in the PM. Murase et al . (2004) found that on longer time scales, such as 3 s, the average D eff (33 ms) 1.5 s for Gold-DOPE was smaller than that for Cy3-DOPE by a factor of two to three and concluded that this is induced by cross-linking of DOPE by colloidal gold probes. Therefore, in previous and present studies, the gold probes were optimized by reducing the number of molecules attached to the gold particle so that the effective diffusion coefficient was maximized under conditions in which the specificity of the probe binding was maintained (specific vs. nonspecific binding to the cell surface was 4:1; Fujiwara et al ., 2002 ; Murase et al ., 2004 ). The gold particles bound to DOPE did not interact with either the extracellular matrix proteins or the extracellular domains of membrane proteins, which might hinder the diffusion of gold-tagged DOPE more than nonlabeled DOPE, because Fujiwara et al . (2002) and Murase et al . (2004) found that the trypsin treatment, which removed ∼60–85% of the extracellular matrix proteins and the extracellular domains of membrane proteins, did not affect the diffusion of Gold-DOPE. SPT of gold-Tf–labeled TfR and gold-DOPE For the observations with enhanced frame rates, a digital high-speed camera with a C-MOS sensor was used (FASTCAM-ultima; Photron, Tokyo, Japan; Tomishige et al ., 1998 ; Fujiwara et al ., 2002 ). For high-speed videomicroscopy of colloidal gold–labeled molecules, bright-field optical microscopy was used, using a Zeiss Axioplan upright microscope equipped with an αPlan-Fluar 100× oil immersion objective lens (NA 1.45). The sequence of images was replayed at the video rate (30 Hz) with analogue and digital enhancement by an image processor (DVS-3000; Hamamatsu Photonics, Hamamatsu, Japan) and recorded on a digital videotape recorder (DSR-20; Sony, Tokyo, Japan). The precision of the position determination was estimated by the same method used in SFMT using 40-nm-diameter gold particles and was 17 nm at a time resolution of 25 μs ( Fujiwara et al ., 2002 ). Obtaining the trajectories of membrane molecules and plots of MSD versus time All of the probes observed in the image were used for analysis, without any arbitrary selection by the observers. The positions ( x- and y -coordinates) of each gold particle and each fluorescent molecule were determined by an in-house computer program that uses the method developed by Gelles et al . (1988) . For each trajectory, the MSD for every time interval was calculated according to the following formula ( Qian et al ., 1991 ; Kusumi et al ., 1993 ): ( 1 ) where δt is the video frame time; ( x ( j + n ), y ( j + n )) describes the particle position after a time interval nδt after starting at position ( x ( j ), y ( j )); N is the total number of frames in the video recording sequence; n and j are positive integers; and n determines the time increment. Classification of the mode of diffusion, calculation of the diffusion coefficient, and analysis of high-speed SPT trajectories For a detailed description of the data analysis methods, see Fujiwara et al . (2002) and Suzuki et al . (2005) . Anomaly in diffusion is often described using the anomality factor α, assuming that ln[MSD( t )] is proportional to α ln(t). However, this method generally neglects complicated causes of anomaly (and thus more complicated time dependence), and it almost always neglects the time scale for the analysis. Thus the types of anomalous diffusion for which it is useful are quite limited ( Saxton, 2012 ). Therefore, in the present research, we used the following method, which we developed previously. A statistical method for classifying each trajectory into the suppressed-diffusion mode, the simple-Brownian-diffusion mode, the mode of simple-Brownian diffusion with drift, or the immobile mode, based on the MSD –Δt plot was described by Kusumi et al . (1993) . Briefly, all of the trajectories were first classified into either the mobile or immobile mode, and the mode-of-motion classification was performed only for the trajectories that were classified as mobile (see Figure 2B and the related discussion in the Results section). The classification was performed based on the RD value, defined as ( 2 ) with D x = D y = D for simple-Brownian diffusion. The ensemble-averaged RD is 1 when the molecules are undergoing suppressed diffusion, simple-Brownian diffusion, or simple-Brownian diffusion with drift (directed diffusion mode), respectively. Figure 2B shows the theoretical curves for 1) simple-Brownian diffusion, for which MSD( Δt ) = 4 DΔt , 2) the directed-diffusion mode, in which a molecule moves in a direction at a constant drift velocity ( v x , v y ) with superimposed random diffusion, MSD( Δt ) = 4 DΔt + v 2 ( Δt ) 2 , where v 2 = v x 2 + v y 2 , and 3) suppressed (totally confined) diffusion, in which a molecule undergoes Brownian diffusion while totally confined within a limited area (compartment; 0 ≤ x ≤ L x , 0 ≤ y ≤ L y ) during the observation period. The MSD –Δt plot levels off and asymptotically approaches a constant value, as expressed by ( 3 ) For the analysis of the trajectories obtained by using high-speed SPT with 0.025-ms resolution and classified into the suppressed-diffusion mode (under the analysis conditions used therein), the MSD– Δt plots in the x- or y -direction was fitted with an in-house program based on the hop diffusion theory of Powles et al . (1992) , in which a particle undergoes diffusion in the presence of semipermeable barriers placed at an equal distance (termed “hop fitting” in the present article; Fujiwara et al ., 2002 ; Murase et al ., 2004 ; Suzuki et al ., 2005 ). See the Results for further details. The correct hop rate (or the residency time within a compartment) was evaluated from the macroscopic diffusion coefficient, determined by SFMT with a fluorescent probe, and the compartment size was determined by SPT with a gold probe. Individual compartments for each trajectory were automatically identified by the computer program ( Kusumi et al ., 2005 ; Suzuki et al ., 2005 ). The following points must be considered with any hop fitting, but they become especially important when very short residency times within each compartment or very small compartment sizes are expected. As discussed in Suzuki et al . (2005) , 1) the total period of the trajectory used for the MSD calculation must be long enough so that a target molecule exhibits a jump (jumps) between the compartments, and 2) the frame rate must be sufficiently high so that a target molecule stays in each compartment for a period of several tens of frames on average. Therefore, when the residency time within each compartment (τ) is expected to be as short as 1–10 ms, we argue that each observation period (total duration of the observation) should be >1.5–15 ms (1.5τ) and the frame rate should be greater than one frame per 0.03–0.3 ms (τ/30). In addition, 3) the time window of the MSD –Δt plot needs to be properly determined so that the contributions from D micro (the initial slope) and D MACRO (the slope toward the end of the plot) to the MSD –Δt curve are well balanced. Therefore, for TfR and DOPE molecules in PtK2 cells, the total observation period of 12 ms (to fulfill requirement 1), the time resolution of 0.025 ms (requirement 2), and the MSD –Δt time window of 1.5 ms (requirement 3) were selected. Although a 1.5-ms time window may seem too short to detect hops every ∼2 ms, all of the possible pairs in the whole 12-ms trajectory are used to calculate the MSD value for each time interval, and therefore this time window would contain sufficient information to successfully estimate the hop parameters. Finally, 4) the contribution from the Gaussian position determination errors to the MSD –Δt plot must be subtracted to estimate the compartment size correctly. Even in single-particle tracking with subpixel precision in particle positions, such as that used here, all of the MSDs include Gaussian position determination errors attributable to the systematic pixelation of the camera and the random noise derived from the optics, the detector, and the sample, and these errors must be subtracted. The SD of this Gaussian error for gold particles fixed on a coverslip was 17 nm on average at a 0.025-ms frame time (for one dimension; Fujiwara et al ., 2002 ). This means that the correct compartment sizes for TfR and DOPE molecules in PtK2 cells should be slightly smaller than those (100 nm or a little smaller) predicted from the visual inspection of the trajectories ( Figure 3A , bottom). When the trajectory is long enough so that the statistical variation in the MSD values is sufficiently reduced, this Gaussian position determination error appears on the MSD –Δt plot as an offset—a constant value irrespective of the time interval (2 × SD 2 for one dimension; Dietrich et al ., 2002 ; Martin et al ., 2002 ). Therefore, to estimate the correct (average) compartment size for each trajectory, the offset value was determined as the y -intercept ( x = 0) in the MSD –Δt plot and was subtracted (the intercept was found by extrapolating the linear-fit function for the first, second, and third data points in the MSD –Δt plot for each direction). The two-dimensional MSD –∆t plot shown in Figure 4A is that after the subtraction of the offset. The two-dimensional offset value is the sum of those for the x- and y- directions. The experimentally determined one-dimensional value was 742 nm 2 ( n = 108; i.e., x- and y -axes for 54 TfR trajectories), giving a position determination error of (742/2) 1/2 = 19.3 nm on average. This is in good agreement with the value of 17 nm obtained for gold particles fixed on a coverslip, thus showing that the offset values were properly determined on the PM. Theoretical distribution of RD values for particles undergoing simple-Brownian diffusion Here we describe an analytical approximation for the distribution of RD( N , n ) given in Eq. 2. To perform the calculations, we consider the large- N limit, where trajectories are long enough that the estimated values of D can be approximated by a constant. Therefore the distribution of RD( N , n ) is simply proportional to the distribution of MSD. MSD( N , n ) can be calculated in two ways ( Saxton, 1997 ): averaging squared displacements over a time interval nδt by either allowing overlapping intervals (as in Eq. 1) or using only nonoverlapping (independent) intervals. Here we employ the second strategy because it has the advantage that the distribution of the MSD can be calculated exactly ( Qian et al ., 1991 ; Saxton, 1997 ). In this case, the MSD is given by ( 4 ) where W z ( i , j ) is the displacement between the ( j + 1)th and i th frames along the z -axis ( j ≥ i ) and K is the number of nonoverlapping intervals, being the largest integer ≤( N − 1)/ n . Under the assumption of simple-Brownian motion, W z ( i , j ) is a Gaussian random variable whose mean is zero and variance is equal to 2( j − i + 1) Dδt , since the displacement between consecutive time steps is Gaussian with zero mean and variance equal to 2 Dδt . Because the W z in Eq. 4 can be treated as independent Gaussian random variables, we can write ( 5 ) where σ 2 = 2 Dδt and N ( a , b ) denotes a Gaussian random variable of mean a and variance b . Because N (0, nσ 2 )/( nσ 2 ) 1/2 is Gaussian distributed with unit variance, its square follows the chi-squared distribution, and the sum of m chi-squared variables is still chi-squared with m degrees of freedom. Therefore we finally have ( 6 ) where χ 2 ( m ) is a chi-squared distributed random variable with m degrees of freedom. Using the properties of χ 2 ( m ), we can express the probability density function of MSD′ as ( 7 ) Finally, we arrive at the distribution of RD( N , n ) by noting that RD( N , n ) = MSD/( 4Dnδt ), which means that the probability distribution function of RD( N , n ) can be obtained from Eq. 7 via rescaling x by the factor 1/(4 Dnδt ) and dividing the resulting expression by the same factor. Therefore the probability density function of RD( N , n ) is also chi-squared distributed and is explicitly given by ( 8 ) Note that the chi-squared distribution approaches a Gaussian distribution for large values of m , via the central limit theorem. Because RD( N , n ) is proportional to a chi-squared distribution with ∼2( N− 1)/ n degrees of freedom (see Eq. 6), we expect the RD( N , n ) distribution to look like a Gaussian distribution at small values of n (2( N− 1)/ n >> 1), and to be more skewed at large values of n (2( N− 1)/ n ∼ 1). In Supplemental Figure S2, we compare the distribution of RD( N , n ) obtained by using the results of Monte Carlo simulations of simple-Brownian motion to that calculated by Eq. 8. See the legend to the figure for parameter values. Rapid-freeze, deep-etch, and platinum-replica electron microscopy of the PM cytoplasmic surface The method used was virtually the same as that used previously ( Morone et al ., 2006 ). Briefly, the cytoplasmic surface of the upper PM (apical PM with scarce microvilli) of PtK2 cells (grown to ∼60% confluency) was exposed by removing the apical PM from the rest of the cell. This was performed in the following manner. After coverslips coated with positively charged Alcian blue 8GX (Wako, Tokyo, Japan) were placed on top of the cell layer and incubated at 4°C for 15 min, the coverslips were gently floated off from the cells using the surface tension of the buffer by slowly adding ice-cold PIPES buffer containing 1% paraformaldehyde/0.25% glutaraldehyde into the space between the culture dish and the coverslip. When the coverslip floated off, the cells were cleaved, and the upper PM remained attached to the coverslip. Each coverslip was placed on the plunger tip of the rapid-freezing device (Eiko, Tokyo, Japan) with the cytoplasmic surface of the membrane facing down. The specimen was slammed down (free fall) onto a polished, pure-copper block, which was prechilled by direct immersion in liquid helium. The excess ice on the cytoplasmic surface was shaved off, and the cytoplasmic surface was etched and then rotary shadowed with platinum at an angle of 22.5° from the surface (FR7000-S; Hitachi, Ibaraki, Japan). The replicas were removed from the glass surface and mounted on 100–200 mesh copper grids (Ted Pella) coated with polyvinyl formvar (Nisshin EM, Tokyo, Japan).
Electron tomography
For three-dimensional (3D) reconstruction, the replica was imaged at tilt angles of every 1.0° in the range ±70° (total 141 images) for a single field by a Tecnai Sphera F20 transmission electron microscope (FEI, Eindhoven, Netherlands) equipped with a charge-coupled device camera (1024 ×1024 pixels). The pixel size at the specimen was 1.1 nm. The image acquisition was fully automated, as previously described ( Medalia et al ., 2002 ). The 100–121 image sections of every 1.1 nm were obtained by a calculation based on the set of 141 tilt images using the IMOD software package ( Kremer et al ., 1996 ) running on Linux. Corrections for the tilt of the specimen and the long-wavelength undulations of the membrane were also accomplished with the IMOD software. The 3D rendering (displaying 3D images in different ways) was performed using the Mercury Computer Systems AMIRA DEV software package (San Diego, CA) operating on a Linux system. The thickness (width in the image) of the actin filament after platinum shadowing was between 9 and 11 nm ( Heuser, 1983 ), and the thickness of the platinum replica was ≤2 nm ( Heuser, 1983 ; Moritz et al ., 2000 ), and thus the height of the actin filament associated with the membrane was 7–9 nm (because the height is given by the actin thickness and one replica thickness, whereas the width in the image is determined by the actin thickness plus two replica thicknesses), with 8 nm being a reasonable estimate. In the series of electron tomography sections shown in Figure 5, A and B , two major classes of filaments with regard to the distance from the membrane surface can be discerned (a third class of filaments, localized >15.4 nm from the PM cytoplasmic surface, also exists but is not visible in Figure 5, A and B ). The first class of filaments is distinct even in the first 0- to 2.2-nm section in the computer-reconstructed sections (because the contrast is reversed in these micrographs, they look more lucent or white), but fade out in the sections of 8.8–11.0 or 11.0–13.2 nm from the PM inner surface. These filaments are colored green in Figure 5C . We consider these filaments to be in direct contact with the PM (the gap between the filament and the inner membrane surface is
📊 Figures
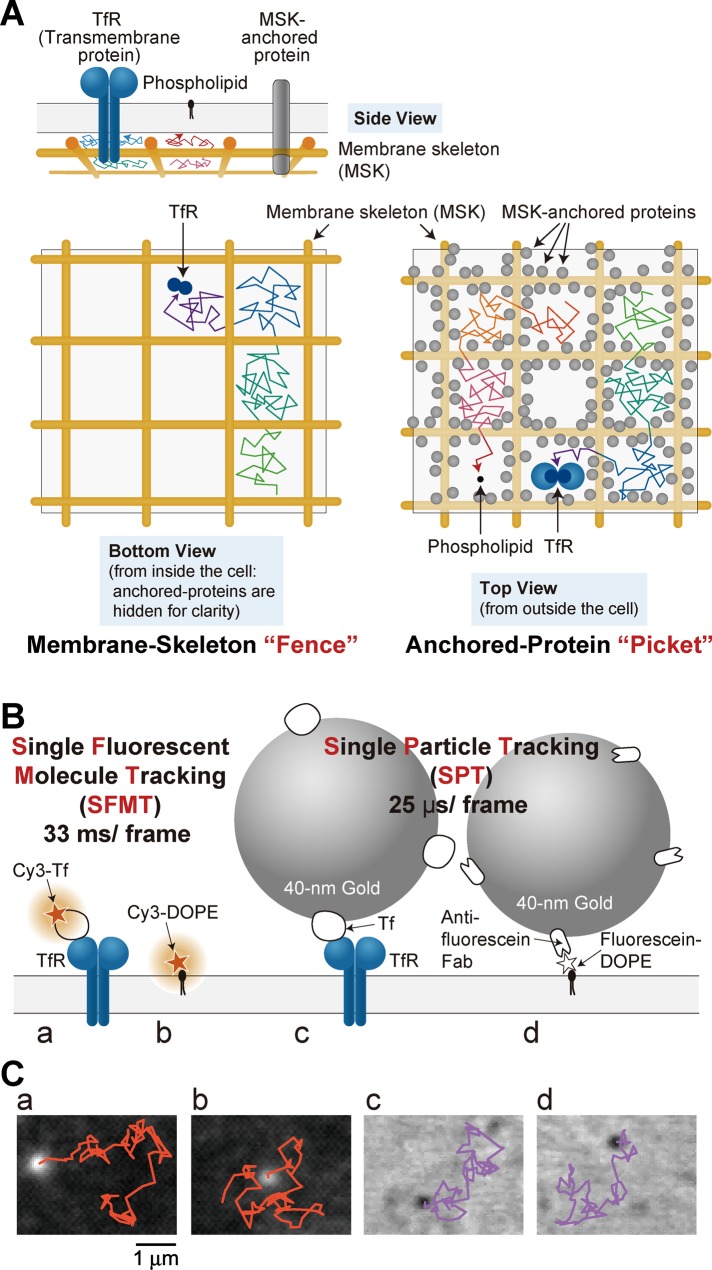
FIGURE 1:
The MSK fence and anchored-TM-protein picket model, and the single-molecule tracking methods used in this study. (A) Fence-and-pickets model. The PM can be partitioned into compartments, and both TM p...
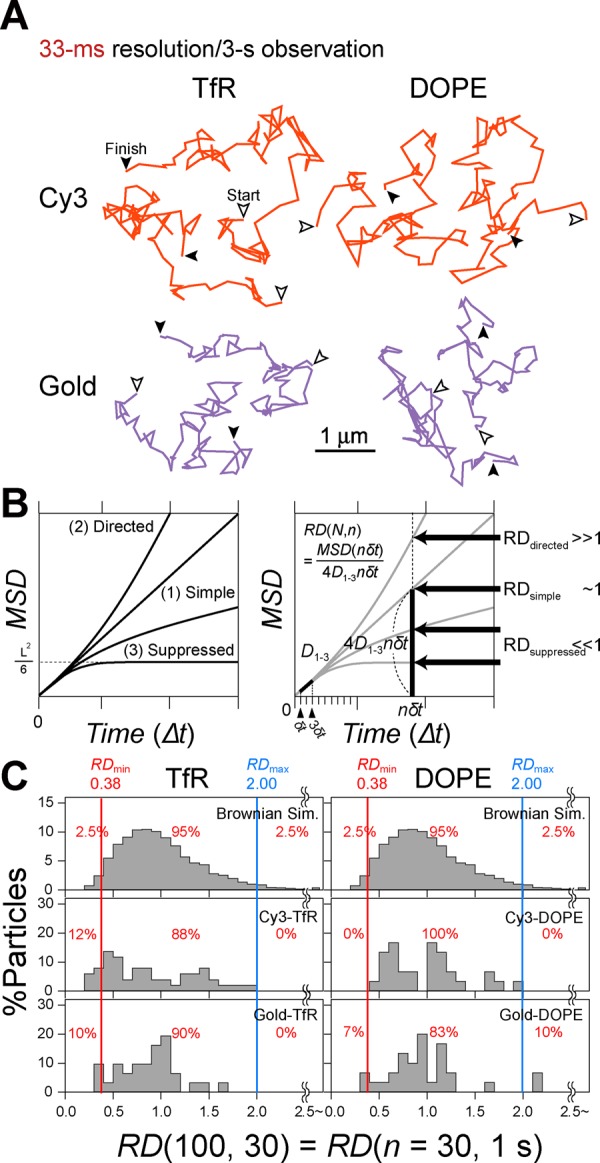
FIGURE 2:
Method for classifying the trajectories into simple-Brownian-, suppressed-, and directed-diffusion modes and its application to TfR and DOPE trajectories (with fluorescent and gold probes) obtained in...
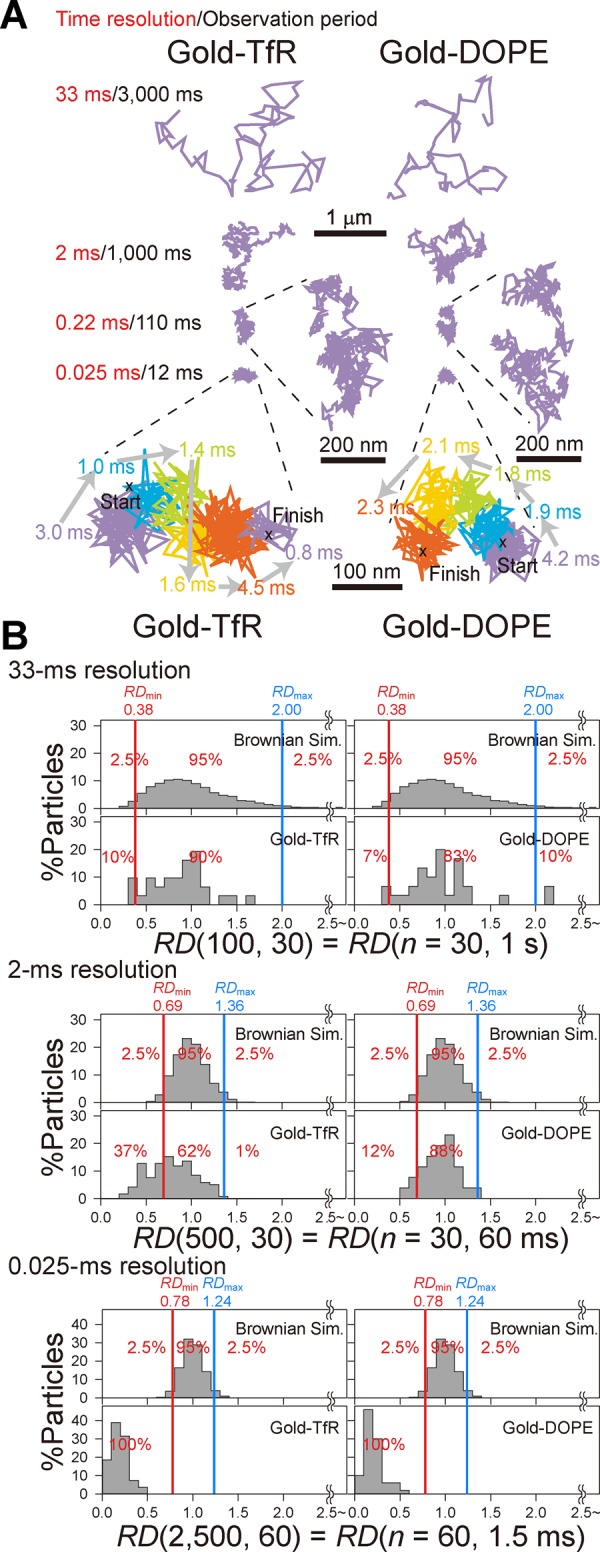
FIGURE 3:
Hop diffusion becomes visible only with enhanced frame rates (improved time resolution). (A) Representative trajectories of gold-TfR (left) and DOPE (right) in the PtK2-cell PM obtained at systematica...
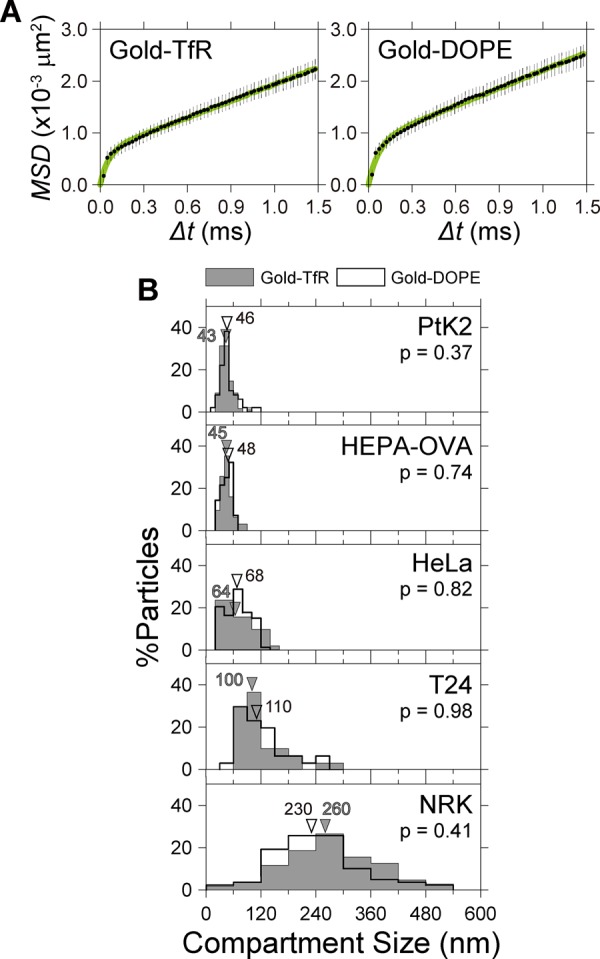
FIGURE 4:
The hop-diffusion fitting of the ensemble-averaged MSD u2013u2206t curves obtained at 0.025-ms resolution supports the proposal that suppressed diffusion is actually induced by hop diffusion (A), and ...
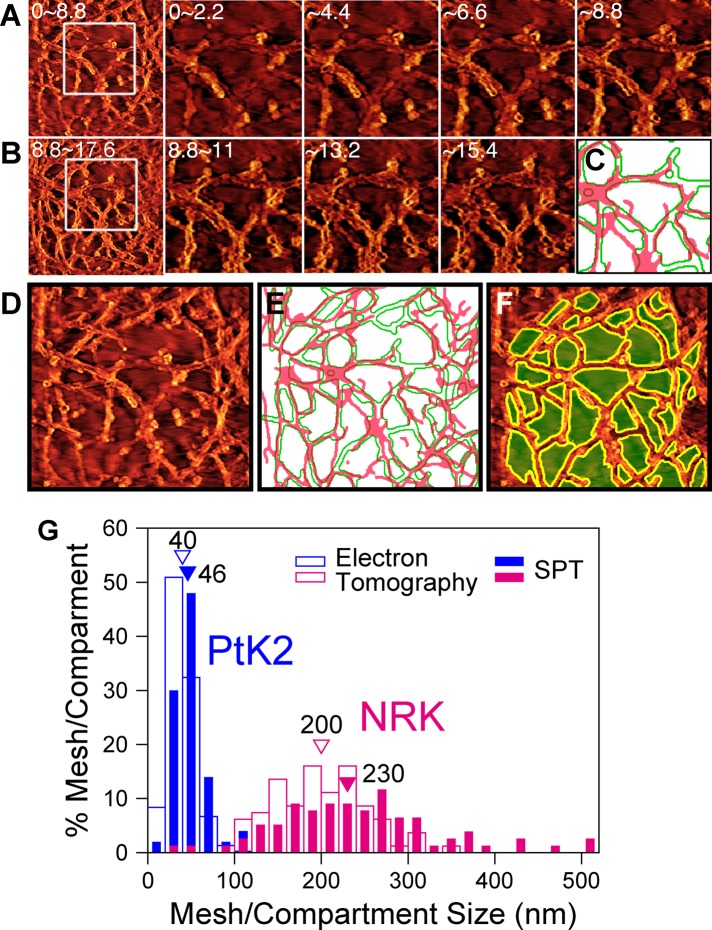
FIGURE 5:
The sizes of the MSK meshwork on the PM cytoplasmic surface determined by electron tomography agree well with the compartment sizes determined from the gold-DOPE diffusion measurements. (A, B) Electro...
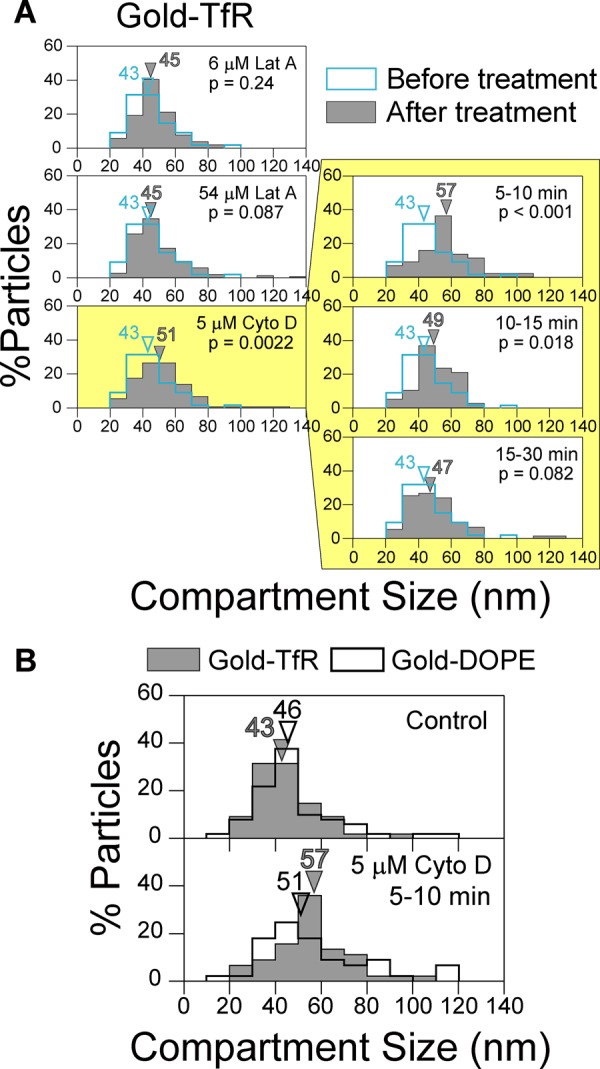
FIGURE 6:
Cytochalasin D, but not latrunculin A, increased the PM compartment size in PtK2 cells, and its effect was greatest 5u201310 min after its addition to the cells. Under these conditions, the compartmen...
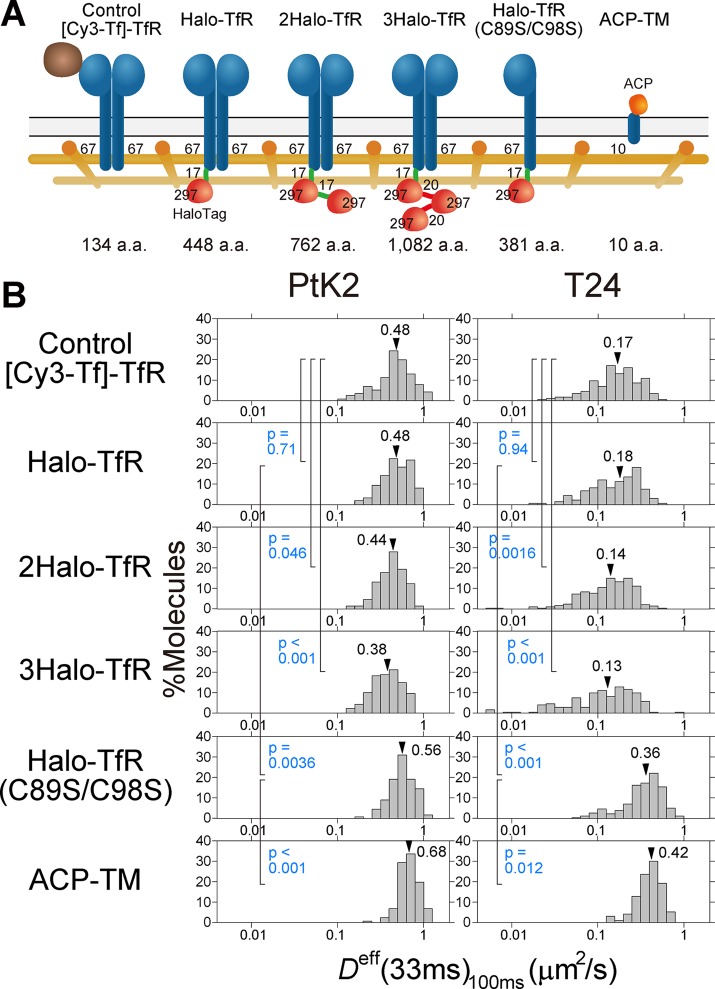
FIGURE 7:
TfRu2019s D eff (33 ms) 100 ms (and thus hop frequency) depends on both its cytoplasmic domain size and dimerization in both PtK2 and T24 cells. (A) Molecules used for this examination. Note that endo...
Figure images are served from the NIH/NLM PubMed Central Open Access Subset or Europe PMC; copyright remains with the publishers and authors.
💬 Discussion
0 commentsNo comments yet. Be the first to start a discussion!
Leave a Comment