Abstract
Glucose homeostasis and growth essentially depend on the hormone insulin engaging its receptor. Despite biochemical and structural advances, a fundamental contradiction has persisted in the current understanding of insulin ligand-receptor interactions. While biochemistry predicts two distinct insulin binding sites, 1 and 2, recent structural analyses have resolved only site 1. Using a combined approach of cryo-EM and atomistic molecular dynamics simulation, we present the structure of the entire dimeric insulin receptor ectodomain saturated with four insulin molecules. Complementing the previously described insulin-site 1 interaction, we present the first view of insulin bound to the discrete insulin receptor site 2. Insulin binding stabilizes the receptor ectodomain in a T-shaped conformation wherein the membrane-proximal domains converge and contact each other. These findings expand the current models of insulin binding to its receptor and of its regulation. In summary, we provide the structural basis for a comprehensive description of ligand-receptor interactions that ultimately will inform new approaches to structure-based drug design.
🔬 Techniques
🔭 Microscopes
🧬 Organisms
✨ Fluorophores
🧪 Sample Preparation
🏭 Microscope Brands
🧪 Reagent Suppliers
💻 Software Details
💾 Data Repositories
🏛️ Research Organizations (ROR)
Affiliated research institutions:
📋 Methods
Cloning and production of IR-ECD A gene encoding human IR-ECD (IR signal sequence followed by residues 1–917 of the mature IR isoform A; UniProt entry P06213-2 ) followed at its C terminus by the 25-residue sequence SSGPSGSHHHHHHHHGSLEVLFQGP (i.e., a protease-resistant linker, the 8xHis tag, and the human rhinovirus 3C protease cleavage site) and a tandem-affinity purification tag ( Rigaut et al., 1999 ) was cloned into the pTT6 vector, called pTT6-IRA.ECD-8xHis-TAP, for transient expression in mammalian cells. The pTT6 vector, which was derived from pTT3 ( Durocher et al., 2002 ), featuring a Kozak sequence and a modified multiple cloning site, was kindly provided by the Protein Expression Purification and Characterization facility at the Max Planck Institute of Molecular Cell Biology and Genetics, Dresden, Germany. FreeStyle HEK293F cells ( R79007 , Thermo Fisher Scientific; RRID:CVCL_D603) were maintained in suspension in protein-free, chemically defined FreeStyle 293 Expression Medium ( R79007 , Thermo Fisher Scientific) supplemented with 1× penicillin/streptavidin (15140122, Thermo Fisher Scientific) at 90 rpm, 8% CO 2 , 37°C. Before transfection, the medium was replaced with fresh antibiotic-free medium. 2 liters of FreeStyle HEK293F cells were transiently transfected with pTT6-IRA.ECD-8xHis-TAP at a density of 2 × 10 6 cells/ml by transfection with 2 mg endotoxin-free DNA precomplexed with polyethylenimine (at a ratio of 5:1 wt/wt to DNA; Longo et al., 2013 ). Upon transfection, cells were maintained for 64 h at 31°C, 8% CO 2 , 90 rpm. The conditioned medium was harvested by pelleting the cells at 300 g , 10 min, 25°C. Cells could be maintained for three more days in fresh medium for a second round of purification. Affinity purification of IR-ECD Human IR-ECD (i.e., IR(αβ 0 ) 2 ) was purified from a 2-liter batch of conditioned medium. The medium was cleared by centrifugation at 2,500 g , 10 min, 4°C, and the supernatant was then allowed to bind to 4 ml IgG Sepharose beads for 3 h at 4°C under constant agitation, and then loaded onto a 2.5 × 20-cm Econo-Column glass chromatography column (7372522, Bio-Rad Laboratories). The flow-through was collected and reloaded onto the column. Running buffers were all based on Hepes-buffered saline (HBS; 50 mM Hepes, pH 7.5, and 150 mM NaCl), and all purification steps were performed at 4°C. The IgG Sepharose beads were washed with 10 column volumes (CV) of running buffer (RB; 150 mM NaCl, 50 mM Hepes, pH 7.5, and 5% vol/vol glycerol), 2 CV RB-ATP (RB + 5 mM ATP and 10 mM MgCl 2 ), 2 CV RB-EDTA (RB + 20 mM EDTA), and then 20 CV elution buffer (RB + 15% vol/vol glycerol). For elution, IgG beads were incubated with glutathione S-transferase–tagged human rhinovirus 3C protease (50 µg protease per ml beads; provided by the Max Planck Institute of Molecular Cell Biology and Genetics) for TAP tag cleavage overnight at 4°C. After protease cleavage, IR-ECD was eluted in one step with 2.5 CV elution buffer. To remove coeluting protease and other impurities, the eluate was incubated with 1 ml Ni-NTA Superflow beads (Qiagen, 30430) for 3 h at 4°C on a rotating wheel for immobilized metal ion affinity chromatography (IMAC). The slurry of resin was then loaded onto a disposable conical 0.8 × 4-cm polypropylene column (Bio-Rad Laboratories). The flow-through was collected and reloaded onto the column. The resin was washed with 10 CV HBS including 10 mM imidazole (3899.3, Carl Roth) and eluted with HBS including 280 mM imidazole in 1-CV fractions. The pH of the wash and elution buffers was adjusted to 7.5. IMAC elution fractions were analyzed by reducing SDS-PAGE using precast NuPAGE 4–12% Bis-Tris gels (Thermo Fisher Scientific) with 1× MOPS buffer (Thermo Fisher Scientific) and subsequent Coomassie Brilliant Blue G-250 staining ( Fig. S1 A ). For biochemical studies, IMAC elution fractions were directly subjected to gel filtration using a Superdex 200 Increase 10/300 GL column equilibrated in HBS at a flow rate of 0.5 ml/min at room temperature to separate dimeric IR-ECD from monomeric IRαβ 0 . The peak fraction containing IR-ECD was stored at 4°C until further use, within 72 h. The apparent molecular weight of IR-ECD was estimated in SDS-PAGE with 3–8% Tris-Acetate gels (Life Technologies) using HiMark unstained protein standards (Thermo Fisher Scientific; Fig. S1 ). The IR-ECD concentration was estimated using a molar extinction coefficient for IR(αβ 0 ) 2 of 280,260 M −1 cm −1 at 280 nm absorbance (as calculated by ExPASy/ProtParam [ Gasteiger et al., 2003 ] assuming one free thiol group per monomer [ Chiacchia, 1991 ; Sparrow et al., 1997 ]). This concentration estimate was confirmed once with a BCA protein assay (Thermo Fisher Scientific). For cryo-EM studies, IMAC elution fractions containing most concentrated IR-ECD were immediately desalted after immobilized metal affinity chromatography elution using disposable 8.3-ml Sephadex G-25 PD-10 desalting columns, concentrated to 3 µM in Amicon Ultra-0.5 ml ultrafiltration units with Ultracel-100 membranes (Merck Chemicals), and kept on ice until further use within 24 h. The concentrated protein was gel-filtrated using a Superdex 200 10/300 GL column equilibrated in HBS at a flow rate of 0.5 ml/min and 4°C (GE Healthcare). The peak fraction containing IR-ECD was immediately used for cryo-EM sample preparation. MST to determine insulin binding to IR-ECD Recombinant human insulin was purchased from Sigma-Aldrich (I2643, lot SLBR9404V, expressed in yeast, 99% purity by HPLC, 0.4% zinc) and resuspended in 5 mM HCl at 3 mg/ml (20252.244, VWR Chemicals). The purity of insulin was confirmed by mass spectrometry under denaturing conditions where only monomeric and dimeric insulin with a mass of 5803.651 ± 0.003 Daltons was detectable, corresponding to the expected mass of insulin with all three disulfide bridges formed. Under native conditions, as expected, additional peaks corresponding to higher insulin oligomers appeared. Insulin binding to IR-ECD was analyzed by MST. First, IR-ECD was diluted to a final concentration of 100 nM in HBS-T (HBS, pH 7.5, and 0.05% Tween-20) and labeled with 25 nM tris-nitriloacetic acid conjugated to NT647 (red tris-NTA; Lata et al., 2005 ; Bartoschik et al., 2018 ), which was a kind gift of Jacob Piehler (University Osnabrück, Osnabrück, Germany). A label-to-IR(αβ 0 ) 2 molar ratio of 1:4 was chosen to circumvent interference of free dye. The reaction was incubated for 30 min in the dark at room temperature and was subsequently centrifuged at 14,000 g for 10 min at 4°C. For ligand binding assays, a 100-µM stock solution of recombinant human insulin in 5 mM HCl was diluted to a concentration of 5 µM in HBS-T. A serial dilution was prepared with ligand binding buffer (i.e., HBS with 25 µM HCl). 10 µl of the diluted ligand was incubated with 10 µl of 20 nM IR-ECD overnight at 4°C. Thus, the final assay concentrations were 10 nM IR-ECD and 2.5 nM red tris-NTA. MST was performed in standard capillaries (MO-K022, Nanotemper Technologies) on a Monolith NT.115 Pico instrument (Nanotemper Technologies) using the Pico-RED detector with 30% light-emitting diode power at 25°C. Data were analyzed with MO.Affinity Analysis 2.2.7 software (NanoTemper Technologies). The integral of thermophoresis traces from 1 to 20 s on-time was used for binding affinity determination, and the normalized fluorescence difference ΔF norm was plotted against ligand concentration for dose–response plots. To determine K d values, nonlinear regression (one-site binding) was performed using Prism version 7.0 for Windows (GraphPad Software). A concentration range, within which insulin did not appear to interact nonspecifically with the labeling reaction or with the dye itself, was determined by titrating insulin against a red tris-NTA–labeled control peptide (comprising an 8xHis tag and part of the HRV3C cleavage site, i.e., 2 HN-HHHHHHHHKLEVLF-CONH 2 ). Thermal stability by nano–differential scanning fluorimetry (nanoDSF) To further characterize IR-ECD and to monitor its stability, a thermal unfolding assay was performed applying label-free, low-volume nanoDSF. IR-ECD was diluted to 500 nM in HBS and incubated with or without 50 µM insulin for 1 h on ice in a volume of 22 µl. Samples were loaded into nanoDSF Grade Standard capillaries (PR-C002, NanoTemper Technologies) in duplicate and transferred to a Prometheus NT.48 instrument (NanoTemper Technologies). Thermal unfolding was detected by recording the intrinsic tryptophan fluorescence (emission ratio at 350 and 330 nm) during heating in a linear thermal ramp (1°C/min; 20°C to 95°C) with an excitation power of 100%.
Show full methods section
Cloning and production of IR-ECD A gene encoding human IR-ECD (IR signal sequence followed by residues 1–917 of the mature IR isoform A; UniProt entry P06213-2 ) followed at its C terminus by the 25-residue sequence SSGPSGSHHHHHHHHGSLEVLFQGP (i.e., a protease-resistant linker, the 8xHis tag, and the human rhinovirus 3C protease cleavage site) and a tandem-affinity purification tag ( Rigaut et al., 1999 ) was cloned into the pTT6 vector, called pTT6-IRA.ECD-8xHis-TAP, for transient expression in mammalian cells. The pTT6 vector, which was derived from pTT3 ( Durocher et al., 2002 ), featuring a Kozak sequence and a modified multiple cloning site, was kindly provided by the Protein Expression Purification and Characterization facility at the Max Planck Institute of Molecular Cell Biology and Genetics, Dresden, Germany. FreeStyle HEK293F cells ( R79007 , Thermo Fisher Scientific; RRID:CVCL_D603) were maintained in suspension in protein-free, chemically defined FreeStyle 293 Expression Medium ( R79007 , Thermo Fisher Scientific) supplemented with 1× penicillin/streptavidin (15140122, Thermo Fisher Scientific) at 90 rpm, 8% CO 2 , 37°C. Before transfection, the medium was replaced with fresh antibiotic-free medium. 2 liters of FreeStyle HEK293F cells were transiently transfected with pTT6-IRA.ECD-8xHis-TAP at a density of 2 × 10 6 cells/ml by transfection with 2 mg endotoxin-free DNA precomplexed with polyethylenimine (at a ratio of 5:1 wt/wt to DNA; Longo et al., 2013 ). Upon transfection, cells were maintained for 64 h at 31°C, 8% CO 2 , 90 rpm. The conditioned medium was harvested by pelleting the cells at 300 g , 10 min, 25°C. Cells could be maintained for three more days in fresh medium for a second round of purification. Affinity purification of IR-ECD Human IR-ECD (i.e., IR(αβ 0 ) 2 ) was purified from a 2-liter batch of conditioned medium. The medium was cleared by centrifugation at 2,500 g , 10 min, 4°C, and the supernatant was then allowed to bind to 4 ml IgG Sepharose beads for 3 h at 4°C under constant agitation, and then loaded onto a 2.5 × 20-cm Econo-Column glass chromatography column (7372522, Bio-Rad Laboratories). The flow-through was collected and reloaded onto the column. Running buffers were all based on Hepes-buffered saline (HBS; 50 mM Hepes, pH 7.5, and 150 mM NaCl), and all purification steps were performed at 4°C. The IgG Sepharose beads were washed with 10 column volumes (CV) of running buffer (RB; 150 mM NaCl, 50 mM Hepes, pH 7.5, and 5% vol/vol glycerol), 2 CV RB-ATP (RB + 5 mM ATP and 10 mM MgCl 2 ), 2 CV RB-EDTA (RB + 20 mM EDTA), and then 20 CV elution buffer (RB + 15% vol/vol glycerol). For elution, IgG beads were incubated with glutathione S-transferase–tagged human rhinovirus 3C protease (50 µg protease per ml beads; provided by the Max Planck Institute of Molecular Cell Biology and Genetics) for TAP tag cleavage overnight at 4°C. After protease cleavage, IR-ECD was eluted in one step with 2.5 CV elution buffer. To remove coeluting protease and other impurities, the eluate was incubated with 1 ml Ni-NTA Superflow beads (Qiagen, 30430) for 3 h at 4°C on a rotating wheel for immobilized metal ion affinity chromatography (IMAC). The slurry of resin was then loaded onto a disposable conical 0.8 × 4-cm polypropylene column (Bio-Rad Laboratories). The flow-through was collected and reloaded onto the column. The resin was washed with 10 CV HBS including 10 mM imidazole (3899.3, Carl Roth) and eluted with HBS including 280 mM imidazole in 1-CV fractions. The pH of the wash and elution buffers was adjusted to 7.5. IMAC elution fractions were analyzed by reducing SDS-PAGE using precast NuPAGE 4–12% Bis-Tris gels (Thermo Fisher Scientific) with 1× MOPS buffer (Thermo Fisher Scientific) and subsequent Coomassie Brilliant Blue G-250 staining ( Fig. S1 A ). For biochemical studies, IMAC elution fractions were directly subjected to gel filtration using a Superdex 200 Increase 10/300 GL column equilibrated in HBS at a flow rate of 0.5 ml/min at room temperature to separate dimeric IR-ECD from monomeric IRαβ 0 . The peak fraction containing IR-ECD was stored at 4°C until further use, within 72 h. The apparent molecular weight of IR-ECD was estimated in SDS-PAGE with 3–8% Tris-Acetate gels (Life Technologies) using HiMark unstained protein standards (Thermo Fisher Scientific; Fig. S1 ). The IR-ECD concentration was estimated using a molar extinction coefficient for IR(αβ 0 ) 2 of 280,260 M −1 cm −1 at 280 nm absorbance (as calculated by ExPASy/ProtParam [ Gasteiger et al., 2003 ] assuming one free thiol group per monomer [ Chiacchia, 1991 ; Sparrow et al., 1997 ]). This concentration estimate was confirmed once with a BCA protein assay (Thermo Fisher Scientific). For cryo-EM studies, IMAC elution fractions containing most concentrated IR-ECD were immediately desalted after immobilized metal affinity chromatography elution using disposable 8.3-ml Sephadex G-25 PD-10 desalting columns, concentrated to 3 µM in Amicon Ultra-0.5 ml ultrafiltration units with Ultracel-100 membranes (Merck Chemicals), and kept on ice until further use within 24 h. The concentrated protein was gel-filtrated using a Superdex 200 10/300 GL column equilibrated in HBS at a flow rate of 0.5 ml/min and 4°C (GE Healthcare). The peak fraction containing IR-ECD was immediately used for cryo-EM sample preparation. MST to determine insulin binding to IR-ECD Recombinant human insulin was purchased from Sigma-Aldrich (I2643, lot SLBR9404V, expressed in yeast, 99% purity by HPLC, 0.4% zinc) and resuspended in 5 mM HCl at 3 mg/ml (20252.244, VWR Chemicals). The purity of insulin was confirmed by mass spectrometry under denaturing conditions where only monomeric and dimeric insulin with a mass of 5803.651 ± 0.003 Daltons was detectable, corresponding to the expected mass of insulin with all three disulfide bridges formed. Under native conditions, as expected, additional peaks corresponding to higher insulin oligomers appeared. Insulin binding to IR-ECD was analyzed by MST. First, IR-ECD was diluted to a final concentration of 100 nM in HBS-T (HBS, pH 7.5, and 0.05% Tween-20) and labeled with 25 nM tris-nitriloacetic acid conjugated to NT647 (red tris-NTA; Lata et al., 2005 ; Bartoschik et al., 2018 ), which was a kind gift of Jacob Piehler (University Osnabrück, Osnabrück, Germany). A label-to-IR(αβ 0 ) 2 molar ratio of 1:4 was chosen to circumvent interference of free dye. The reaction was incubated for 30 min in the dark at room temperature and was subsequently centrifuged at 14,000 g for 10 min at 4°C. For ligand binding assays, a 100-µM stock solution of recombinant human insulin in 5 mM HCl was diluted to a concentration of 5 µM in HBS-T. A serial dilution was prepared with ligand binding buffer (i.e., HBS with 25 µM HCl). 10 µl of the diluted ligand was incubated with 10 µl of 20 nM IR-ECD overnight at 4°C. Thus, the final assay concentrations were 10 nM IR-ECD and 2.5 nM red tris-NTA. MST was performed in standard capillaries (MO-K022, Nanotemper Technologies) on a Monolith NT.115 Pico instrument (Nanotemper Technologies) using the Pico-RED detector with 30% light-emitting diode power at 25°C. Data were analyzed with MO.Affinity Analysis 2.2.7 software (NanoTemper Technologies). The integral of thermophoresis traces from 1 to 20 s on-time was used for binding affinity determination, and the normalized fluorescence difference ΔF norm was plotted against ligand concentration for dose–response plots. To determine K d values, nonlinear regression (one-site binding) was performed using Prism version 7.0 for Windows (GraphPad Software). A concentration range, within which insulin did not appear to interact nonspecifically with the labeling reaction or with the dye itself, was determined by titrating insulin against a red tris-NTA–labeled control peptide (comprising an 8xHis tag and part of the HRV3C cleavage site, i.e., 2 HN-HHHHHHHHKLEVLF-CONH 2 ). Thermal stability by nano–differential scanning fluorimetry (nanoDSF) To further characterize IR-ECD and to monitor its stability, a thermal unfolding assay was performed applying label-free, low-volume nanoDSF. IR-ECD was diluted to 500 nM in HBS and incubated with or without 50 µM insulin for 1 h on ice in a volume of 22 µl. Samples were loaded into nanoDSF Grade Standard capillaries (PR-C002, NanoTemper Technologies) in duplicate and transferred to a Prometheus NT.48 instrument (NanoTemper Technologies). Thermal unfolding was detected by recording the intrinsic tryptophan fluorescence (emission ratio at 350 and 330 nm) during heating in a linear thermal ramp (1°C/min; 20°C to 95°C) with an excitation power of 100%.
Cryo-EM grid preparation and imaging
Peak fractions at a final Abs 280nm of ∼0.4 (∼1.4 µM) were incubated for ∼30 min at 4°C with or without recombinant human insulin supplementation at 28× molar excess (∼40 µM final concentration). 4 µl of these samples were applied to glow discharged (2.2 × 10 −1 mbar for 2 × 20 s) Quantifoil holey carbon grids (R2/1, 200 mesh, Quantifoil). The grids were plunge vitrified in a liquid ethane/propane mix using a Vitrobot Mark IV at 4°C and 95% humidity. Cryo-EM data were collected on a FEI Titan Krios microscope operated at 300 kV, equipped with a postcolumn Gatan energy filter and a K2 Summit direct detector operating in counting mode. A total of 8,882 movies were recorded at a nominal magnification of 130,000× that corresponds to 1.059 Å/pixel at the specimen level using SerialEM ( Mastronarde, 2005 ). The total exposure of 55 e − /Å 2 at the specimen level was evenly distributed over 51 frames during 10.2 s. The preset target defocus range was 0.5–3.5 µm. The sample preparation and data collection strategies for the apo -IR-ECD samples were very similar except that no insulin was used for grid preparation. These data were collected with a total exposure of 59 e − /Å 2 , spread over 51 frames and 10.2 s. The target defocus ranged from 0.5 to 3.5 µm. No stage pretilt was used for either of the two datasets. Cryo-EM data acquisition and processing The RELION-3.0 implementation of MotionCor2 ( Zheng et al., 2017 ) was used to correct for beam-induced sample motions and radiation damage. The summed and dose-weighted micrographs were used for further processing. Particles were selected using Gautomatch version 0.56 ( https://www.mrc-lmb.cam.ac.uk/kzhang/Gautomatch/ ). CTF parameters were determined using Gctf ( Zhang, 2016 ). If not stated otherwise, all further processing was performed in RELION v2.1 or v3.0 ( Kimanius et al., 2016 ; Zivanov et al., 2018 ). In the case of the insulin-bound structure, initial analysis of particles picked without templates yielded a 3D reconstruction using as template a 60-Å low-pass filtered initial model generated by the stochastic gradient descent implementation of RELION v2.1 ( Kimanius et al., 2016 ; compare Fig. S2 for a graphical overview of the processing routine). Low-pass filtered projections of this reconstruction were used as templates for template-based particle picking on all micrographs. This resulted in 2,997,079 particle candidates. The particle stack was cleaned up by unsupervised 2D classification in subsets of ∼120,000 particles. Subsequently, the data were further processed in ∼120,000 particle chunks in 3D classification with the first reconstruction as a 60-Å low-pass filtered starting model. The resulting cleaned dataset of 326,257 particles reached a nominal global resolution of 4.9 Å after 3D refinement and postprocessing. Bayesian polishing in RELION v3.0 ( Zivanov et al., 2018 ) was used to correct further for beam-induced motion and radiation damage, improving the quality of the map to a final apparent resolution of 4.3 Å. The global resolution estimates of the obtained reconstructions are quoted as good proxies for the overall relative quality of the individual reconstructions, fully acknowledging the differences in local resolution estimates as well as the anisotropy of the data. The angular distribution of particles contributing to this map is shown in Fig. S3, C and D , and the FSC curve of the masked independent half-maps in Fig. S3 E . The rotation versus tilt angle plot in Fig. S3 C was created by binning the angular assignments of all particles contributing to this reconstruction in 3° × 1.5° bins, followed by plotting the resulting distribution using the Tidyverse collection of R packages ( https://www.tidyverse.org/ ). The local resolution estimate in Fig. S3 F was calculated with the local resolution routine implemented in RELION v3.0 ( Zivanov et al., 2018 ). The minor class we termed “intermediate state,” which is described in Figs. S2 and S8 , was processed in a similar way as the “saturated state.” After the above-described classification in ∼120,000 particle chunks, 50,079 particles were subjected to 3D refinement focused on the ECD “head.” This reconstruction reached a nominal global resolution of 5.0 Å (according to the 0.143 FSC cutoff criterion) after Bayesian polishing in RELION v3.0 ( Zivanov et al., 2018 ), a further 3D refinement step of the whole ECD as well as map filtering and sharpening. The rotation versus tilt angle plot in Fig. S8 C was created by binning the angular assignments of all particles contributing to this reconstruction in 3° × 3° bins, followed by plotting the resulting distribution using the Tidyverse collection of R packages. The data of the ligand-free IR-ECD sample were processed using an approach similar to that outlined above. Since the attempts at 3D reconstruction never yielded resolutions in the subnanometer range, only 2D class averages are shown.
Model building and refinement
A nonglycosylated IR-ECD model with four insulins was constructed initially for fitting into the cryo-EM density map. This model was based on the previously published partial insulin-bound IR-ECD (PDB 6CEB , including the two head-bound insulins 1 and 1′). The L1 and L1′ domain residues H144 were modified to Y144 to match the IR construct used here (Uniprot P06213-2 ). Regions that were not resolved in PDB 6CEB were added as described in the following. As reliable starting models for the FnIII domains, we included the respective coordinates from PDB 4ZXB ( Croll et al., 2016 ) in the structure. Additionally, we constructed tentative models of the IDα loops (chain α and α′ residues 651–687) using MODELLER ( Eswar et al., 2006 ) and included them in the structure, since we observed some incohesive density features for these regions. The stalk-bound insulins 2 and 2′ were modeled based on the structure of porcine insulin (PDB 4INS ; Baker et al., 1988 ). To match the human insulin sequence, the insulin B-chain C terminus residue was mutated from A30 to T30. The model is thus consistent with the complete human IR-ECD (UniProt P06213-2 ) and human insulin sequences (UniProt P01308 ) and matches the experimental constructs used in this study. As a first step in the fitting procedure, global, rigid body docking of the resulting nonglycosylated IR-ECD in complex with four insulins into the density map was performed in UCSF Chimera ( Pettersen et al., 2004 ). To locally improve the model, we used a combination of flexible fitting methods including the real-space structure refinement program DireX ( Wang and Schröder, 2012 ), followed by the simple relax protocol in torsional space in Rosetta ( Fleishman et al., 2011 ; Conway et al., 2014 ). As a last step, the cysteines involved in intra- and interchain dimer bonds as well as specific β-strands of the FnIII-3 domains were directed into selected regions of the density map by interactive MD flexible fitting ( Trabuco et al., 2009 ; McGreevy et al., 2016 ). After completion of the initial fitting routine outlined above, the structure was subjected to several rounds of iterative real-space refinement in phenix.refine ( Afonine et al., 2018 ) and manual adjustment in Coot ( Emsley et al., 2010 ). Progress in modeling was monitored via the map-to-model correlation coefficients, geometry indicators, and the map-versus-model FSC (see Table S1). Structure images were created in PyMOL2 (PyMOL Molecular Graphiscs System, Schrödinger) and ChimeraX ( Goddard et al., 2018 ). The refined model is deposited in PDB (accession number 6SOF ) and is referred to in the main text as “cryo-EM structure.” Since our reconstruction did not produce clear density features for the Arg-Lys-Arg-Arg residues (furin cleavage site), the disordered IDβ region, and the residual C-terminal purification tag sequence, these parts are not included in the refined structure (see also Table S2). However, for completeness, they are included in the model used in MD simulations described below. We decided to include the modeled side chains in our IR-ECD structure bound to four insulins (PDB 6CEB ), since it is our belief that the resulting model most closely approximates our experimental cryo-EM data. In our view, this is justified because portions of the reconstruction are resolved to ∼4 Å (especially the core of the head domain; see local resolution estimate in Fig. S3 F ), at which point individual bulky side chains become discernible. In addition, even at lower resolution, side chains potentially contribute to the signal in the particle images. This is supported by the model-to-map correlation coefficients being lower in the absence of side chains compared with the deposited model (e.g., CC mask of 0.63 for no-side chains vs. 0.72 with side chains model). However, we strongly advise readers against interpreting side chain–level interactions in our model, as there is insufficient basis for such interpretations from our cryo-EM density.
Atomistic MD simulations
For atomistic MD simulations, we completed the structure refined against the EM map described above by adding all the loops invisible in our density map (i.e., the furin cleavage site, residues 720–723), the disordered and highly glycosylated N-terminal region of the IRβ subunit (residues 724–756), and the residual C-terminal purification tag sequence (SSGPSGSHHHHHHHHGSLEVLFQ). All of these additional loops and regions were built using MODELLER ( Eswar et al., 2006 ). Additionally, based on the glycan composition defined previously ( Sparrow et al., 2007 , 2008) , we added 17 N -linked and 6 O -linked glycans on each monomer (Table S3) using the doGlycans tool ( Danne et al., 2017 ). The OPLS-AA force field ( Kaminski et al., 2001 ; Danne et al., 2017 ) was used for proteins, glycans, and ions. The glycosylated IR-ECD was energy-minimized in vacuum using the steepest descent algorithm to remove any steric clashes due to overlapping atoms. The energy-minimized structure was then solvated using the TIP3P water model ( Jorgensen et al., 1983 ) in a box of 21 nm 3 . The solvated structure was neutralized with an appropriate number of Na + counterions complemented by 150 mM NaCl to match experimental buffer and salt concentration. The system consisted of 924,775 atoms in total. The resulting structural model of the IR-ECD is referred to as “MD model” in the text. Before MD simulations, the system was again subjected to energy minimization followed by 50-ns equilibration under NVT (constant particle number, volume, and temperature) conditions at 298 K using the v-rescale thermostat ( Bussi et al., 2007 ) with a time constant of 0.1 ps. At this stage, the IR-ECD and the insulin backbone atoms were position-restrained with a force constant of 1,000 kJ mol −1 nm −2 . Next, equilibration of the system was continued under NpT (constant particle number, pressure, and temperature) conditions using isotropic Parrinello–Rahman pressure coupling ( Parrinello and Rahman, 1980 , 1981 , 1982 ) with a time constant of 2 ps over a period of 50 ns, with reference pressure set to 1 bar and isothermal compressibility to 4.5 × 10 −5 bar −1 . The IR-ECD and the insulin backbone atoms were again position-restrained with a force constant of 500 kJ mol −1 nm −2 . The resulting structure is referred to as “starting MD model” throughout the text. Electrostatic interactions were calculated by the particle mesh Ewald method ( Darden et al., 1993 ; Essmann et al., 1995 ) using 1.0 nm for the cutoff of the real space component. The same cutoff distance was set for van der Waals interactions together with the LINCS algorithm ( Hess et al., 1997 ) for all bonds. Periodic boundary conditions were applied in all three dimensions. The final production run for 500 ns was performed after removal of all position restraints, and the rest of the input parameters were the same as those used under NpT equilibration simulations. All MD simulations were performed with an integration time step of 2 fs using the GROMACS 4.6 simulation package ( Hess et al., 2008 ), and the output trajectory and energies were saved every 100 ps. For reproducibility of the results, 10 repeats (500 ns each) were performed. For the analyses, GROMACS tools and in-house built scripts were used. Contact maps were built with the g_distMat analysis tool. A contact for a given pair of residues was considered to be established if the minimum distance between any atoms in the two residues was either ≤3.5 Å or ≤6 Å. RMSD analysis was performed for backbone atoms with respect to the starting MD model. The final 100 ns from each of the 10 trajectories were used to generate residue contact occupancy maps. MD movies and figures were prepared using VMD ( Humphrey et al., 1996 ) and PyMOL2.
Data availability
The cryo-EM density maps and structural model of the 4:1 insulin–IR-ECD complex developed in this study are available from the Electron Microscopy Data Bank (EMD-10273) and Protein Data Bank (PDB 6SOF ), respectively. The cryo-EM density map for the IR-ECD bound by several insulins in an intermediate state is available from the Electron Microscopy Data Bank (EMD-10311). Online supplemental material Fig. S1 illustrates the IR-ECD purification, the analysis of insulin binding, and 2D class averages of apo -IR-ECD. Figs. S2 and S3 give an overview on cryo-EM data collection and processing. Fig. S4 demonstrates asymmetries in our cryo-EM structure and flexibilities or fluctuations of IR-ECD and its insulin ligands during our MD simulations. Figs. S5 , S6 , and S7 provide contact and occupancy maps based on the cryo-EM structure or MD simulations. Fig. S8 gives an overview of the cryo-EM data processing for our 3D reconstruction of the intermediate state IR-ECD bound to several insulins.
Table
S1 provides a summary of the cryo-EM data collection and model quality indicators.
Table
S2 summarizes all residues included or absent from the insulin–IR-ECD cryo-EM structure. The glycan composition of IR-ECD in our MD simulation model is in Table S3.
Table
S4 provides center-of-mass distance measurements between insulin B-chain C-terminal and B-chain α-helix residues for our 10-MD simulations.
Online supplemental material Fig. S1 illustrates the IR-ECD purification, the analysis of insulin binding, and 2D class averages of apo -IR-ECD. Figs. S2 and S3 give an overview on cryo-EM data collection and processing. Fig. S4 demonstrates asymmetries in our cryo-EM structure and flexibilities or fluctuations of IR-ECD and its insulin ligands during our MD simulations. Figs. S5 , S6 , and S7 provide contact and occupancy maps based on the cryo-EM structure or MD simulations. Fig. S8 gives an overview of the cryo-EM data processing for our 3D reconstruction of the intermediate state IR-ECD bound to several insulins.
Table
S1 provides a summary of the cryo-EM data collection and model quality indicators.
Table
S2 summarizes all residues included or absent from the insulin–IR-ECD cryo-EM structure. The glycan composition of IR-ECD in our MD simulation model is in Table S3.
Table
S4 provides center-of-mass distance measurements between insulin B-chain C-terminal and B-chain α-helix residues for our 10-MD simulations.
Supplementary Material Table S1 Click here for additional data file. Table S2 Click here for additional data file. Table S3 Click here for additional data file. Table S4 Click here for additional data file.
📊 Figures
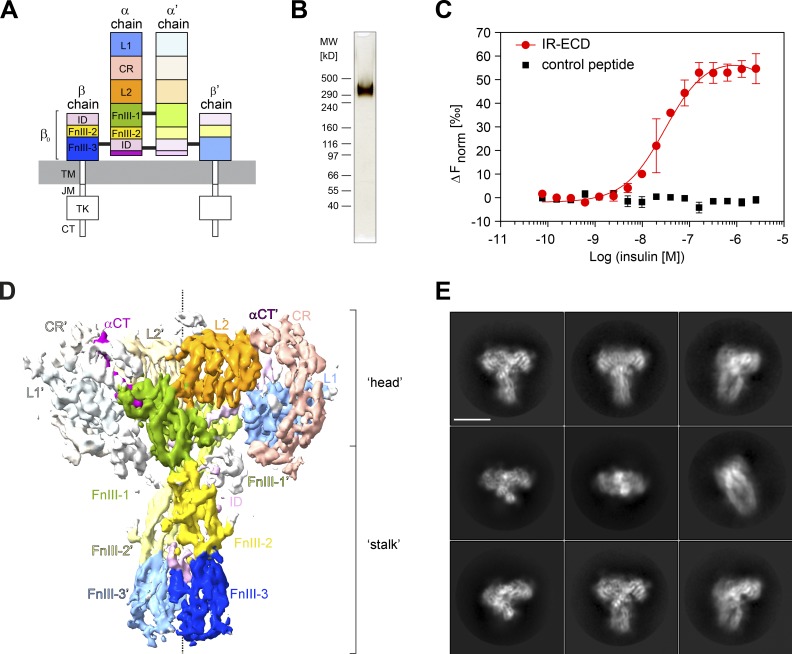
Figure 1.
IR-ECD purification and cryo-EM. (A) Scheme of IR domain architecture. L1 and L2, leucine-rich repeat domains 1 and 2; CR, cysteine-rich domain; FnIII-1, -2, -3, fibronectin type-III domains 1, 2, 3; ...
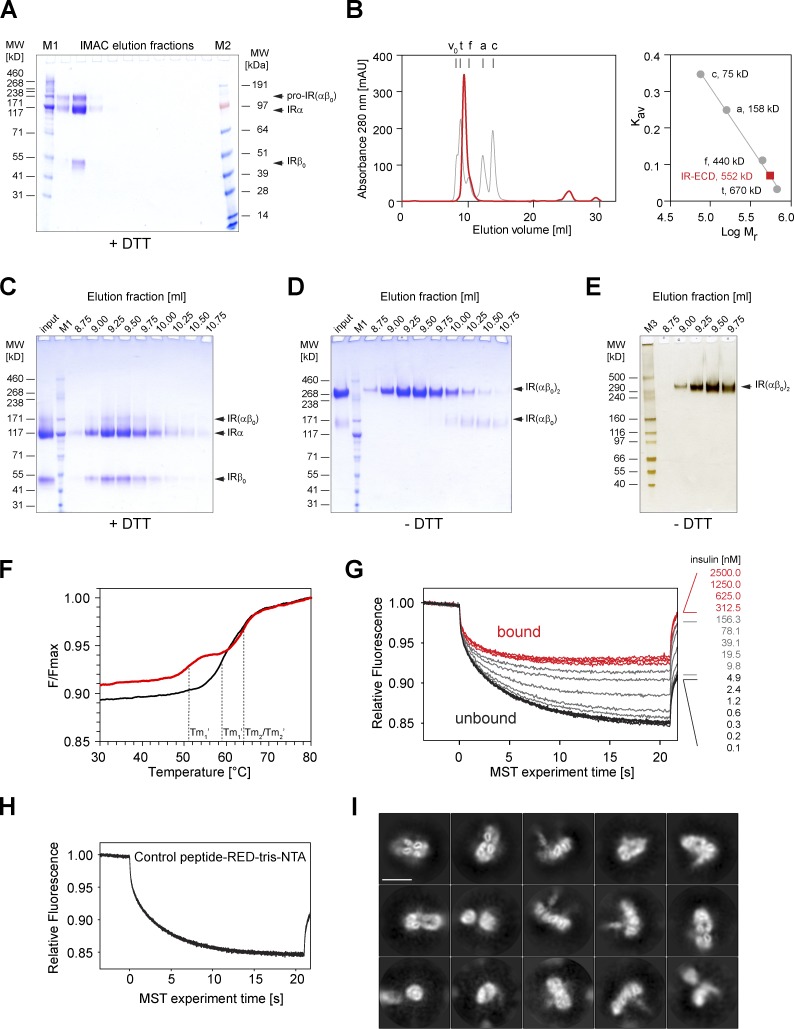
Figure S1.
Purification and biochemical characterization of IR-ECD. (A) Coomassie G-250 Brilliant Blueu2013stained 4u201312% Bis-Tris gel run in MOPS buffer of the IMAC elution fractions under reducing condition...
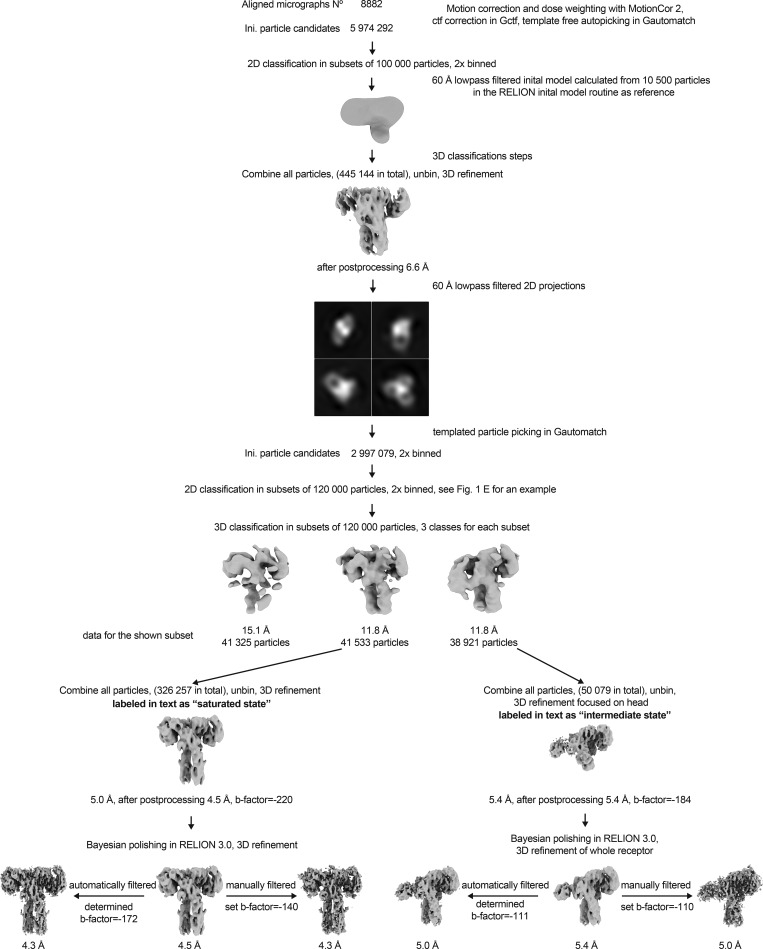
Figure S2.
Overview of the cryo-EM data processing scheme. Particle sorting and classification scheme used for 3D reconstruction of the insulinu2013IR-ECD complex. The individual nominal global resolutions are q...
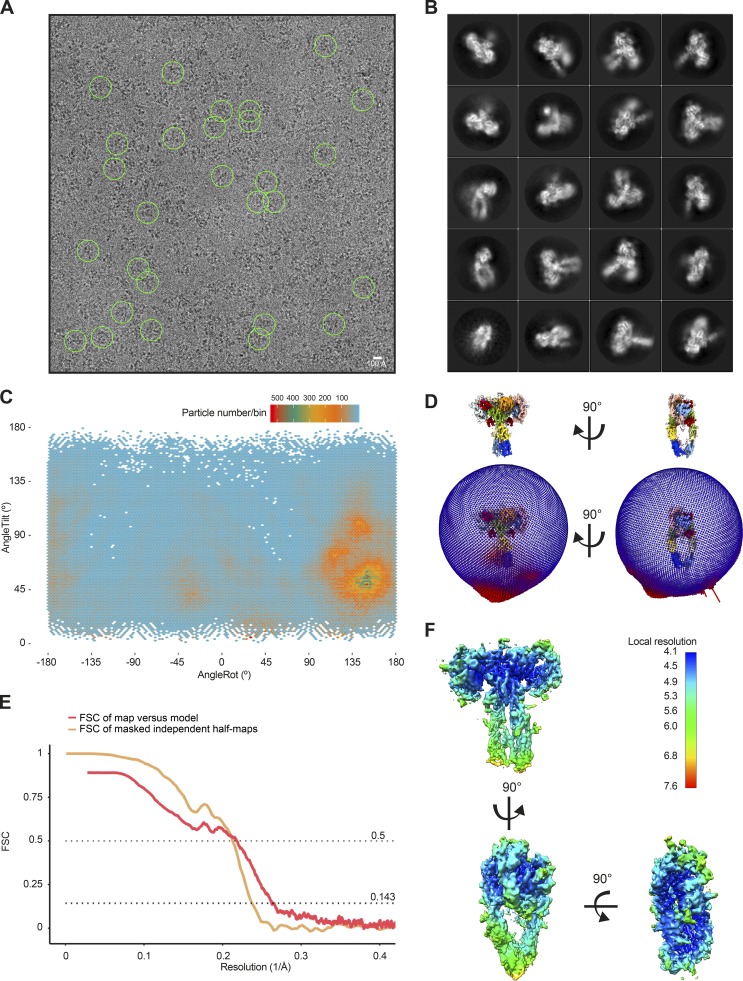
Figure S3.
Single-particle cryo-EM analysis of the insulinu2013IR-ECD complex. (A) Representative micrographs of the insulinu2013IR-ECD dataset. The scale bar in the cryo-EM micrograph corresponds to 100 u00c5, ...
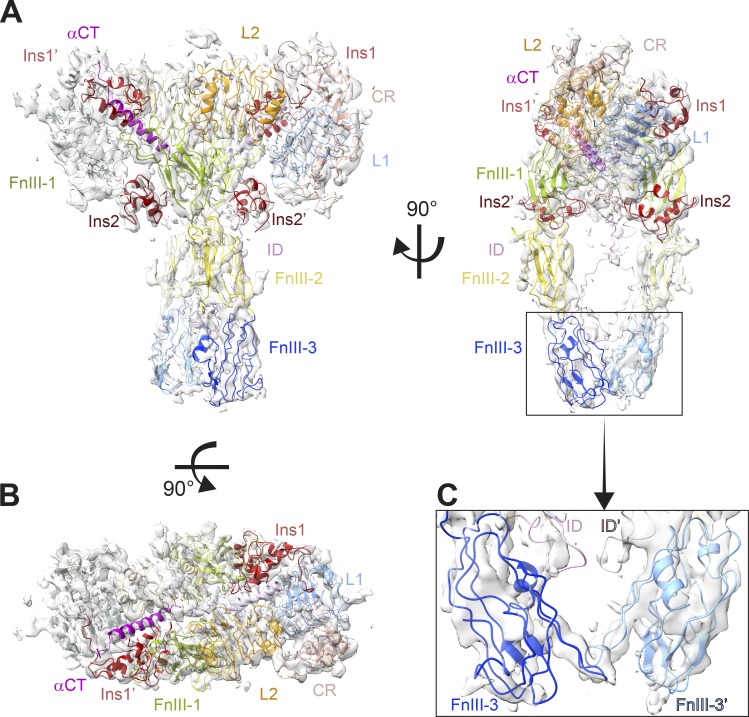
Figure 2.
Cryo-EM structure of the ligand-saturated IR-ECD. (A and B) Orthogonal views of the cryo-EM map and structure of the IR-ECD dimer complex. (C) Close-up of the membrane-proximal FnIII-3 domains. The co...
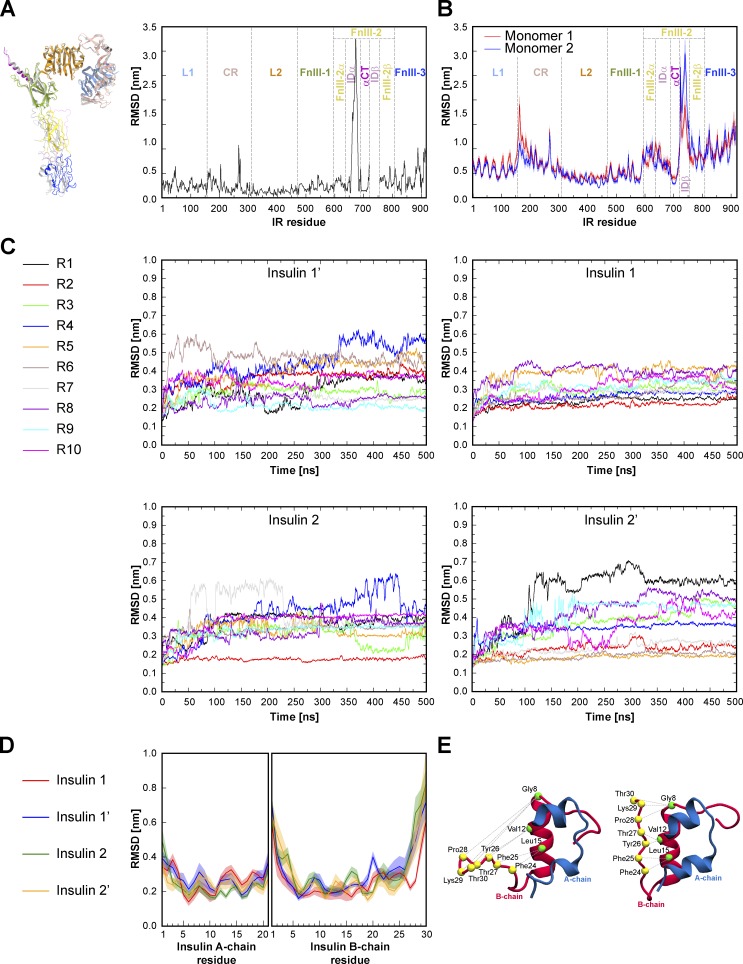
Figure S4.
Structural asymmetries in the cryo-EM structure and MD simulations of the ligand-saturated IR-ECD . (A) Asymmetries depicted in our cryo-EM structure. The panel on the left shows the two superimposed ...
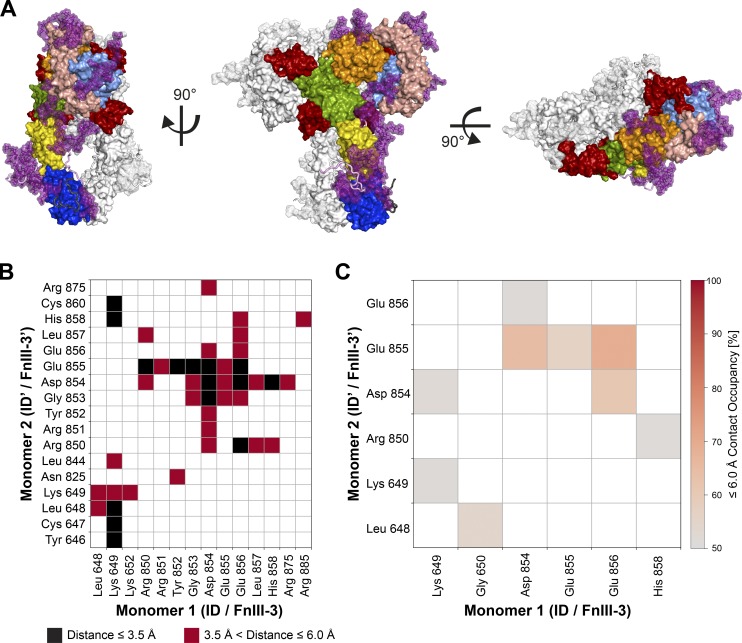
Figure 3.
MD simulations of insulin-saturated IR-ECD and interactions of membrane-proximal domains. (A) Orthogonal views of the complete insulinu2013IR-ECD starting model used for MD simulations in surface repr...
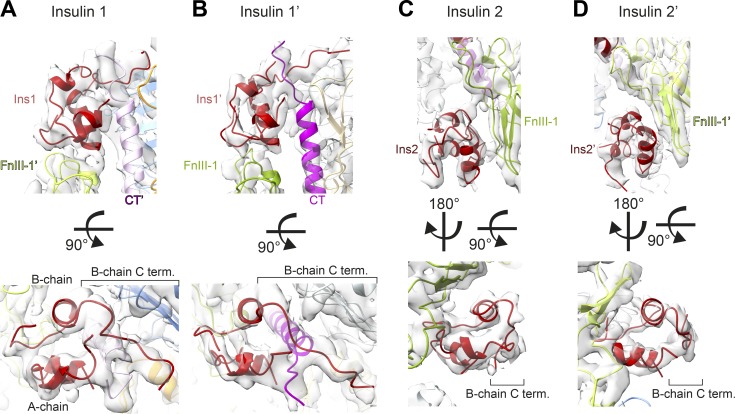
Figure 4.
Binding sites and conformations of insulins bound to IR-ECD. (Au2013D) The cryo-EM density map and structure in close-up views of the four insulins and their receptor binding sites are displayed: insu...
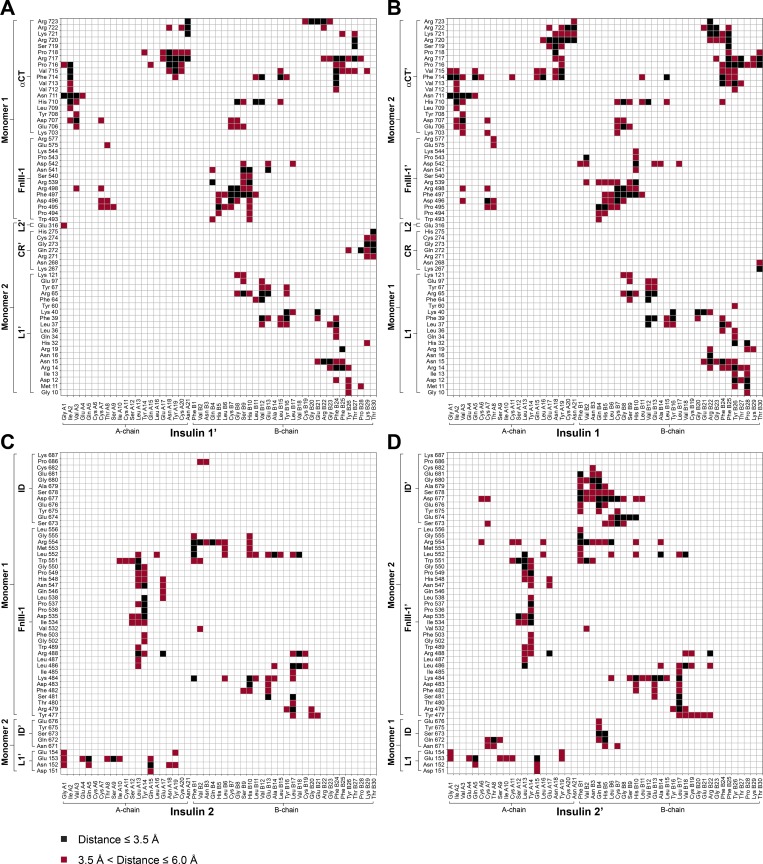
Figure S5.
Contact map for insulinu2013IR-ECD interactions in the cryo-EM structure. (Au2013D) Contact map showing interactions between IR-ECD and head-bound insulins 1u2032/1 (A and B) and stalk-bound insulins ...
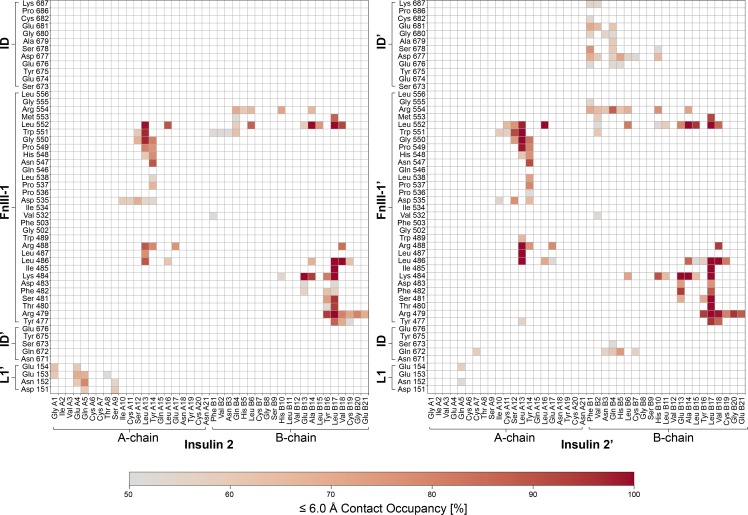
Figure 5.
Characterization of the novel insulin binding sites 2 and 2u2032 interactions by MD simulations. Contact occupancies for insulinu2013IR-ECD interactions derived from our 10 u00d7 500-ns MD simulations...
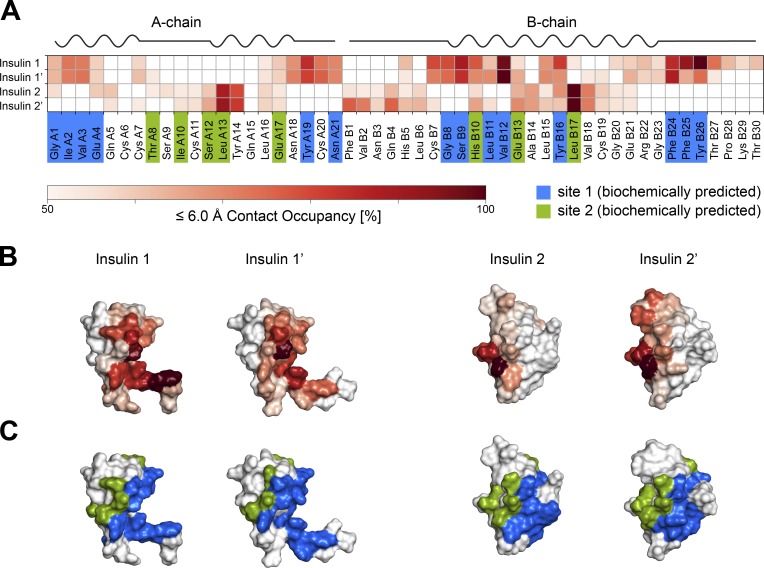
Figure 6.
Interactions of insulin with the IR-ECD binding sites 1 and 2. (A) Summary of per residue contact occupancies of the four insulins bound to IR-ECD in the MD simulations. The contact occupancies are en...
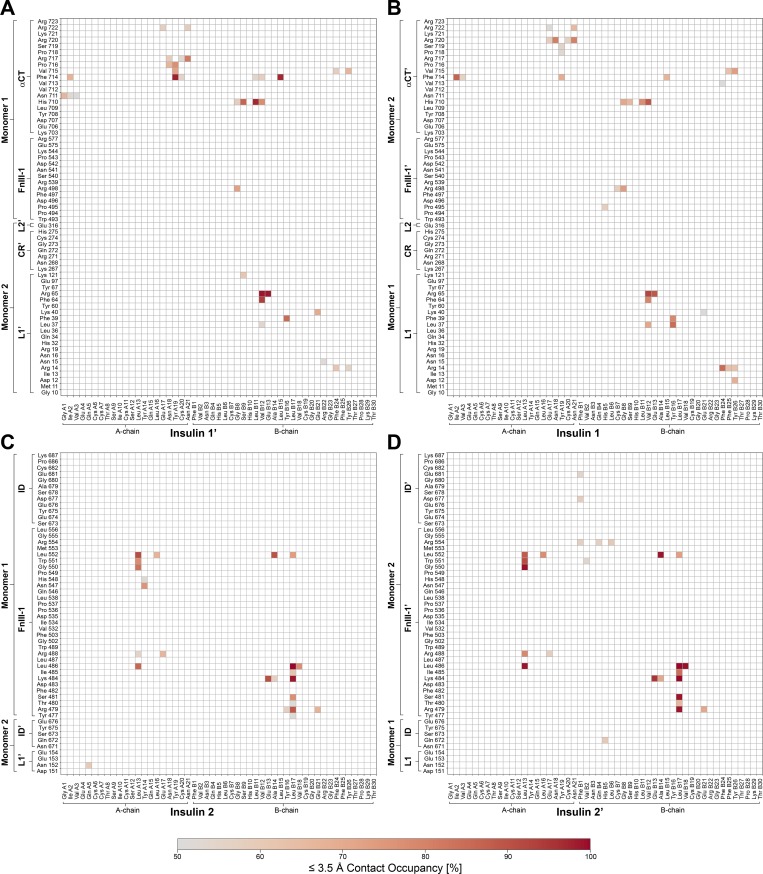
Figure S6.
Contact occupancies for insulinu2013IR-ECD interactions with a cutoff of 3.5 u00c5 in the MD simulations. (Au2013D) Contact map showing interactions between IR-ECD and head-bound insulins 1u2032/1 (A ...
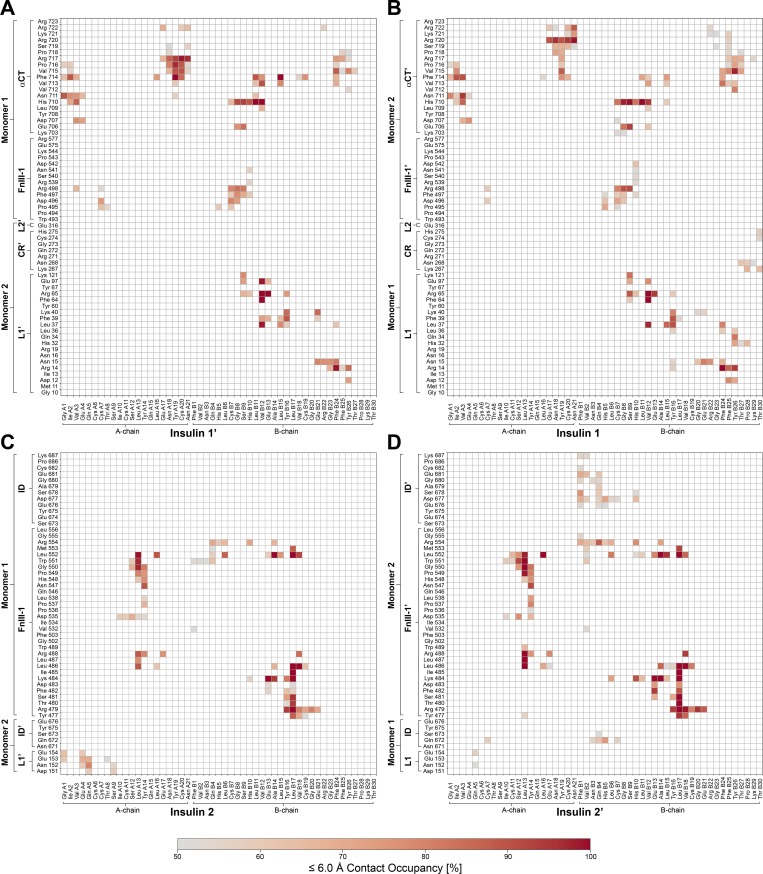
Figure S7.
Contact occupancies for insulinu2013IR-ECD interactions with a cutoff of 6.0 u00c5 from MD simulations. (Au2013D) Contact map showing interactions between IR-ECD and head-bound insulins 1u2032/1 (A an...
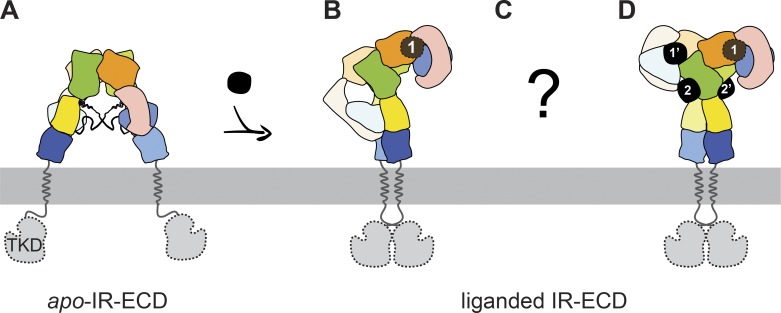
Figure 7.
Schematic models of unliganded and liganded transition states for which complete IR-ECD structures have been reported . (A ) Apo -IR-ECD (PDB 4ZXB ; Croll et al., 2016 ). (B) Singly liganded IRu0394u0...
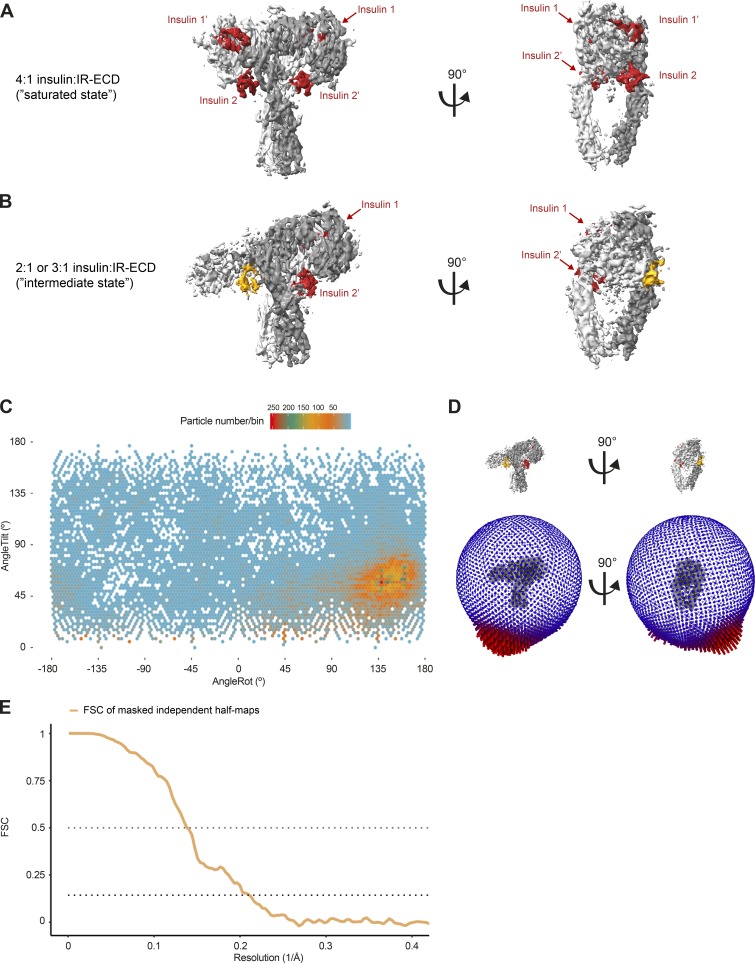
Figure S8.
Cryo-EM analysis of the insulinu2013IR-ECD intermediate state. (A and B) Front and side views of the 3D density maps of the saturated state bound to four insulins (A) and the intermediate state bound ...
Figure images are served from the NIH/NLM PubMed Central Open Access Subset or Europe PMC; copyright remains with the publishers and authors.
💬 Discussion
0 commentsNo comments yet. Be the first to start a discussion!
Leave a Comment