Abstract
Influenza viruses exhibit striking variations in particle morphology between strains. Clinical isolates of influenza A virus have been shown to produce long filamentous particles while laboratory-adapted strains are predominantly spherical. However, the role of the filamentous phenotype in the influenza virus infectious cycle remains undetermined. We used cryo-electron tomography to conduct the first three-dimensional study of filamentous virus ultrastructure in particles budding from infected cells. Filaments were often longer than 10 microns and sometimes had bulbous heads at their leading ends, some of which contained tubules we attribute to M1 while none had recognisable ribonucleoprotein (RNP) and hence genome segments. Long filaments that did not have bulbs were infrequently seen to bear an ordered complement of RNPs at their distal ends. Imaging of purified virus also revealed diverse filament morphologies; short rods (bacilliform virions) and longer filaments. Bacilliform virions contained an ordered complement of RNPs while longer filamentous particles were narrower and mostly appeared to lack this feature, but often contained fibrillar material along their entire length. The important ultrastructural differences between these diverse classes of particles raise the possibility of distinct morphogenetic pathways and functions during the infectious process.
🔬 Techniques
🔭 Microscopes
✨ Fluorophores
🧪 Sample Preparation
🔬 Cell Lines
🏭 Microscope Brands
🧪 Reagent Suppliers
📷 Detectors
💻 Software Details
💾 Data Repositories
🏛️ Research Organizations (ROR)
Affiliated research institutions:
📋 Methods
Virus propagation The H3N2 strain influenza
A/Udorn/72 was cultivated in MDCK cells. Cells were grown to confluence at 37°C in Dulbecco's modified Eagle's medium (DMEM) supplemented with 10% foetal calf serum (FCS). 3×10 8 cells were infected at a multiplicity of infection (MOI) of 0.001. Following an incubation period of 1 h, the media was replaced with serum-free DMEM containing 2.5 µg/ml N-acetyl trypsin (NAT, Sigma) followed by incubation at 37°C. 36 hours post-infection (p.i.), the supernatant was harvested and clarified by centrifugation at 2500 rpm for 5 min. Following a second clarification step (10,000 rpm for 30 minutes), virus was pelleted by centrifugation onto a 30% sucrose cushion in NTE buffer (1 mM EDTA 10 mM, 150 mM NaCl, Tris-HCl, pH 7.5) at 25,000 rpm for 2.5 h. The pellet was then resuspended in 250 µl NTE and run through a continuous sucrose gradient (30%–60%) at 25,000 rpm for 2.5 h. Finally, banded virus was collected and centrifuged at 31,000 rpm for 2 h. The pelleted virus was resuspended in 100 µl of NTE buffer.
Confocal microscopy
Confluent monolayers of MDCK cells grown on cover slips were infected at an MOI of 0.6. Cells were then fixed 24 h p.i. with 4% formaldehyde/2.5% Triton X-100 in PBSA for 30 min. They were then washed three times with PBS, followed by blocking in sheep serum or rabbit serum for 1 h. Labelling was then performed by incubating cells for 1 h at room temperature with primary antibodies. Unbound antibody was removed by washing three times with PBSA prior to incubation for 30 min at room temperature with fluorescent-tagged secondary antibodies. Finally cells were washed three times with PBSA and mounted using ProLong Antifade plus DAPI reagent (Invitrogen, UK). For the time course experiment, infected MDCK cells (moi 3) were fixed at various time points; 6 h, 8 h, 10 h, 12 h, 14 h, 16 h, 18 h and 27 h. Infected MDCK cells fixed at 27 h with only 4% formaldehyde served as a non permeabilised control. Controls were also carried out by infecting A549 cells with H3N2 Udorn (moi 3) and MDCK cells with H1N1 WSN (moi 5) followed by fixation with 4% formaldehyde/2.5% Triton X-100 13 h p.i. Labelling for the time course and control samples were performed as detailed above. All samples infected with H3N2 Udorn were immunolabelled for the H3 haemagglutinin with a mouse monoclonal antibody raised against A/X-31/1968 H3N2 virus, kindly provided by Prof. John Skehel (NIMR, London), while the H1N1 WSN samples were labelled for H1 with a mouse monoclonal antibody raised against A/PR/8/34 H1N1, kindly provided by Prof. Paul Digard (Edinburgh). H3 and H1 were detected with a rabbit anti-mouse Alexa Fluor 633 (Invitrogen, UK). Nucleoprotein (NP) labelled using a mouse monoclonal antibody (Abcam, UK) was detected using a sheep anti-mouse-FITC conjugate (Sigma, UK). Phalloidin Alexa Fluor 568 (Invitrogen, UK) was used to stain actin. Immunofluorescent imaging was carried out with Zeiss LSM510 Meta and LSM710 laser confocal microscopes. Infection of cells grown on grids Gold 200 mesh TEM grids with holey carbon support film (Quantifoil Micro Tools GmbH, Jena, Germany) were sterilized with ethanol and then coated with laminin overnight in glass-bottomed dishes (MATTEK Corporation Inc, USA). Grids were then washed in water and seeded with 100,000 MDCK cells per dish in DMEM media supplemented with 10% FCS. They were then incubated overnight at 37°C. Cells were infected at an MOI of 0.6 for 1 h at 37°C. The media was then replaced by serum free DMEM supplemented with 2.5 µg/ml NAT and incubated for 19 h.
Show full methods section
Virus propagation The H3N2 strain influenza
A/Udorn/72 was cultivated in MDCK cells. Cells were grown to confluence at 37°C in Dulbecco's modified Eagle's medium (DMEM) supplemented with 10% foetal calf serum (FCS). 3×10 8 cells were infected at a multiplicity of infection (MOI) of 0.001. Following an incubation period of 1 h, the media was replaced with serum-free DMEM containing 2.5 µg/ml N-acetyl trypsin (NAT, Sigma) followed by incubation at 37°C. 36 hours post-infection (p.i.), the supernatant was harvested and clarified by centrifugation at 2500 rpm for 5 min. Following a second clarification step (10,000 rpm for 30 minutes), virus was pelleted by centrifugation onto a 30% sucrose cushion in NTE buffer (1 mM EDTA 10 mM, 150 mM NaCl, Tris-HCl, pH 7.5) at 25,000 rpm for 2.5 h. The pellet was then resuspended in 250 µl NTE and run through a continuous sucrose gradient (30%–60%) at 25,000 rpm for 2.5 h. Finally, banded virus was collected and centrifuged at 31,000 rpm for 2 h. The pelleted virus was resuspended in 100 µl of NTE buffer.
Confocal microscopy
Confluent monolayers of MDCK cells grown on cover slips were infected at an MOI of 0.6. Cells were then fixed 24 h p.i. with 4% formaldehyde/2.5% Triton X-100 in PBSA for 30 min. They were then washed three times with PBS, followed by blocking in sheep serum or rabbit serum for 1 h. Labelling was then performed by incubating cells for 1 h at room temperature with primary antibodies. Unbound antibody was removed by washing three times with PBSA prior to incubation for 30 min at room temperature with fluorescent-tagged secondary antibodies. Finally cells were washed three times with PBSA and mounted using ProLong Antifade plus DAPI reagent (Invitrogen, UK). For the time course experiment, infected MDCK cells (moi 3) were fixed at various time points; 6 h, 8 h, 10 h, 12 h, 14 h, 16 h, 18 h and 27 h. Infected MDCK cells fixed at 27 h with only 4% formaldehyde served as a non permeabilised control. Controls were also carried out by infecting A549 cells with H3N2 Udorn (moi 3) and MDCK cells with H1N1 WSN (moi 5) followed by fixation with 4% formaldehyde/2.5% Triton X-100 13 h p.i. Labelling for the time course and control samples were performed as detailed above. All samples infected with H3N2 Udorn were immunolabelled for the H3 haemagglutinin with a mouse monoclonal antibody raised against A/X-31/1968 H3N2 virus, kindly provided by Prof. John Skehel (NIMR, London), while the H1N1 WSN samples were labelled for H1 with a mouse monoclonal antibody raised against A/PR/8/34 H1N1, kindly provided by Prof. Paul Digard (Edinburgh). H3 and H1 were detected with a rabbit anti-mouse Alexa Fluor 633 (Invitrogen, UK). Nucleoprotein (NP) labelled using a mouse monoclonal antibody (Abcam, UK) was detected using a sheep anti-mouse-FITC conjugate (Sigma, UK). Phalloidin Alexa Fluor 568 (Invitrogen, UK) was used to stain actin. Immunofluorescent imaging was carried out with Zeiss LSM510 Meta and LSM710 laser confocal microscopes. Infection of cells grown on grids Gold 200 mesh TEM grids with holey carbon support film (Quantifoil Micro Tools GmbH, Jena, Germany) were sterilized with ethanol and then coated with laminin overnight in glass-bottomed dishes (MATTEK Corporation Inc, USA). Grids were then washed in water and seeded with 100,000 MDCK cells per dish in DMEM media supplemented with 10% FCS. They were then incubated overnight at 37°C. Cells were infected at an MOI of 0.6 for 1 h at 37°C. The media was then replaced by serum free DMEM supplemented with 2.5 µg/ml NAT and incubated for 19 h.
Electron Microscopy and image reconstruction
For cryo imaging of purified virus, preparations were mixed with 10 nm colloidal gold (British Biocell International, Cardiff, UK) in a ratio of 1∶3 v/v. A 5 µl aliquot was applied to freshly glow-discharged Quantifoil holey carbon support films (R2/2 200 mesh copper grids - Quantifoil Micro Tools GmbH, Jena, Germany), blotted and frozen by plunging into liquid ethane as previously described [38] . For cryo imaging of virus infected cells grown on Quantifoil EM grids 15 nm colloidal gold (British Biocell International, Cardiff, UK) was added in a ratio of 1∶3 v/v. Grids were then blotted and frozen by plunging into liquid ethane. Tilt-series imaging was performed on a JEOL 2200FS energy-filtering transmission electron microscope equipped with a Gatan Ultrascan 4 k×4 k CCD camera and a Gatan 914 high-tilt cryo-stage. The microscope was operated at 200 kV and zero-loss energy filtered imaging with a slit-width of 30 eV was used to enhance image contrast. Tilt series were recorded using the SerialEM software package [39] . Images were acquired at two-degree increments from −70° to +70° between 10,000× and 20,000× magnification for cells on grids and at 20,000× or 40,000× magnification for purified virus. Images were recorded with two-times binning, corresponding to a pixel sizes ranging from 21.2 to 5.4 Å/pixel in the specimen. The target defocus was set to between 4 and 6 µm under-focus and the electron dose ranged from 83 e/Å 2 to 100 e/Å 2 per tilt-series. Tomograms were calculated and visualized using the IMOD software package [40] . Reconstruction was performed using weighted back projection followed by denoising using non-linear anisotropic diffusion. Figures were prepared by averaging 10 tomogram sections using IMOD's 3dmod slicer routine. Segmentation was performed manually using Amira (Visual Sciences Group).
Supporting Information Figure S1 Immunofluorescent confocal imaging of unpermeabilised MDCK cells infected with Influenza A/Udorn/72 virus, showing that filaments and Archetti bodies (arrows) are not an artefact of preparation. (TIF) Click here for additional data file. Figure S2 Confocal imaging of Influenza A/Udorn/72 infection in A549 cells shows that fewer filaments are produced in this cell line compared with MDCK cells, however the filamentous phenotype is still evident. The top row images show uninfected cells (UI), the bottom row shows A549 cells infected with Influenza A/Udorn/72 (Ud). (TIF) Click here for additional data file. Figure S3 Comparison of immunofluorescence patterns in MDCK cells infected with Influenza A/Udorn/72 (an H3N2 filamentous virus) and A/WSN/33 (an H1N1 spherical virus). While abundant filaments are seen in the Udorn infected cells, this feature is not seen in the WSN infection. (TIF) Click here for additional data file. Figure S4 Cryo Electron Microscopy (A, B) and Cryo Electron Tomography (C, D) of Archetti bodies. Archetti bodies budding from cells were seen to be very long (>10 µm) and were straight (white arrows) and/or flexible as denoted by the black arrows (A). Their extreme lengths predisposed them to shearing and breakage into smaller rods, shown by the white circles (B). Archetti bodies were also seen to have budded from the cell surface resulting in particles with large varicosities at one end and normal hemispherical caps at the other (C, D). (TIF) Click here for additional data file. Figure S5 Cryo Electron Microscopy of budding filaments and Archetti bodies at the cell surface. Cell associated filaments and Archetti bodies close to the cell edge (red line) were seen to be surrounded by vesicles and cell processes (A, B). (TIF) Click here for additional data file. Figure S6 Visualising the pleomorphic structures of influenza A filaments and virions. In most tomograms of virus infected cells, small virions were not observed as they were most likely suspended in the culture media and did not adhere to the carbon support film. One tomogram was however recorded in which long filaments and Archetti bodies were seen (A) as well as some smaller virions (B). A low magnification (4000×) cryo image of purified virus reveals the extent of pleomorphism showing long filaments and a small number of Archetti bodies (white circles - C). Tomograms of purified virus however did not show Archetti bodies resembling those we saw in virus infected cells, rather filaments with varicosities along their lengths were seen that were less regular and frequently contained vacuolar structures (D). (TIF) Click here for additional data file. Figure S7 Cryotomography of purified influenza A filaments mostly did not have RNPs at their termini. Filaments in which both ends were visible were not commonly seen in tomograms owing to their great lengths however. Where such filaments were observed, the ends (red boxes) were not found to contain obvious RNP like density (A–C). (TIF) Click here for additional data file. Movie S1 Movie to show confocal imaging of Archetti bodies at 18 hours post-infection. DAPI was used to stain cell nuclei (blue) while phalloidin was used to detect actin (red). Monoclonal antibodies were used to detect viral proteins NP is shown in green and HA is shown in white. (MOV) Click here for additional data file. Movie S2 Movie to show serial sections through the z-axis in a tomogram of an Archetti body budding from MDCK cells (also shown in Figure 4 ). (MOV) Click here for additional data file. Movie S3 Movie showing a cross-eyed stereo image of a segmented Archetti body containing single or paired sheets of density (pink, green, orange, light blue, yellow) in close proximity to the membrane (grey). These features were attributed to M1. The gold fiducial markers (mustard) trace the outside edge and extent of the particle. The tomogram is also shown as serial sections through the reconstructed density. (MOV) Click here for additional data file. Movie S4 Series of movies showing serial sections through tomograms of cell-associated filamentous particles. Archetti bodies are shown that contain putative M1 tubules. Helices that we attribute to M1 are also shown within long filaments. Long filaments are shown in which RNPs are seen at the distal ends while other filaments do not contain this feature. (MOV) Click here for additional data file. Movie S5 Movie to show a tomogram of purified Udorn H3N2 virus. A single section through this reconstruction is presented in figure 5A . (MOV) Click here for additional data file. Movie S6 Movie to show the 7+1 arrangement of RNPs in bacilliform particles and fibrillar density in longer filamentous particles. (MOV) Click here for additional data file.
📊 Figures
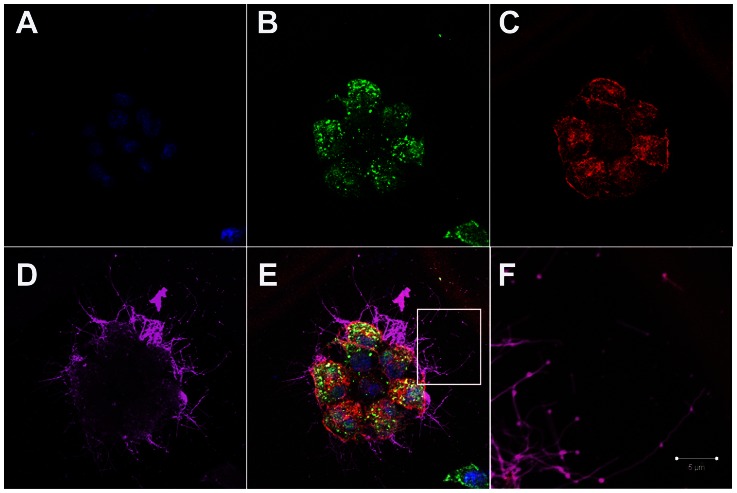
Figure 1
Influenza filaments budding from MDCK cells at 24 hours post-infection.
(A) Immunofluorescence shows staining with DAPI (blue), NP (green - B), Actin (red - C) and HA (pink - D). (E) Merged view of channels shown in panels Au2013D. (F) Close up view of the region indicate...
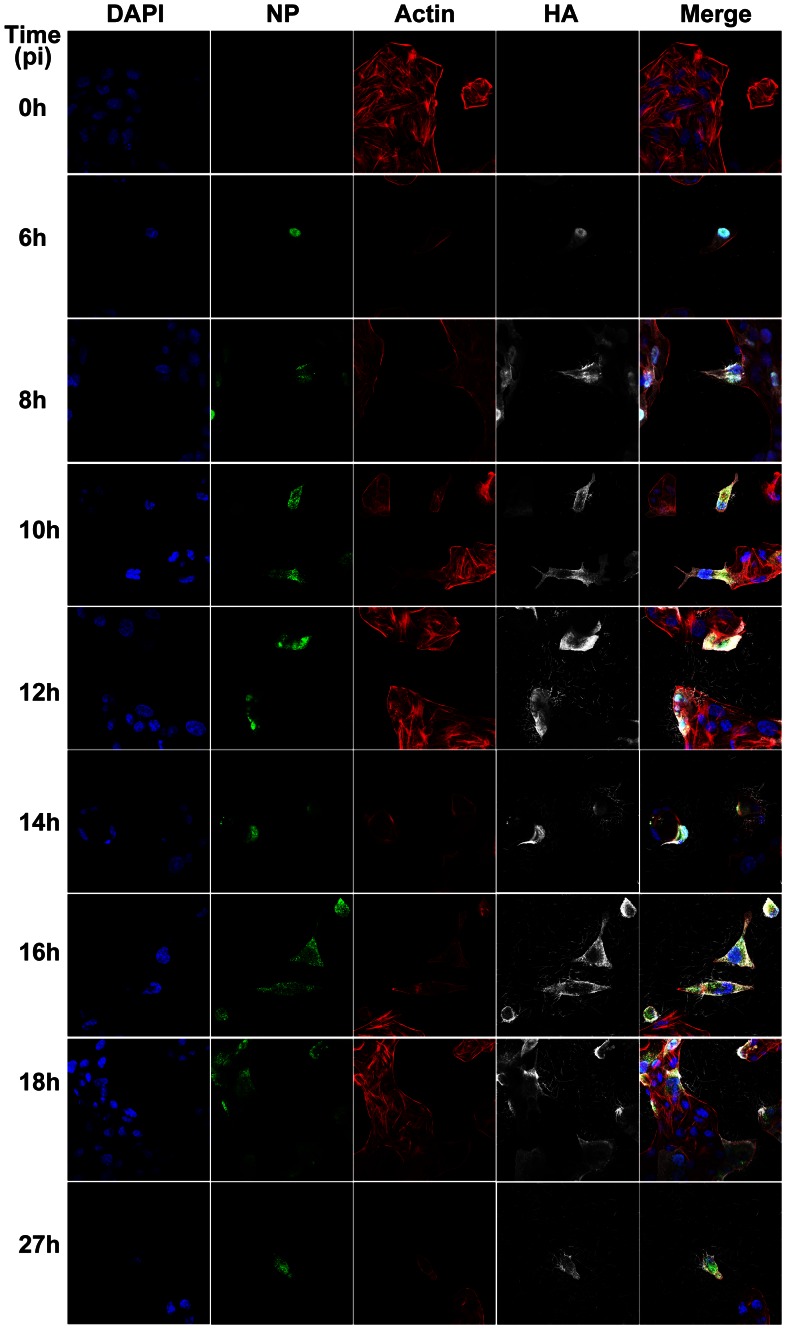
Figure 2
Time course immunofluorescence imaging of filament formation in MDCK cells infected with Influenza A/Udorn/72.
DAPI was used to stain cell nuclei (blue) while phalloidin was used to detect actin (red). Monoclonal antibodies were used to detect viral proteins; NP is shown in green and HA is shown in white. Budd...
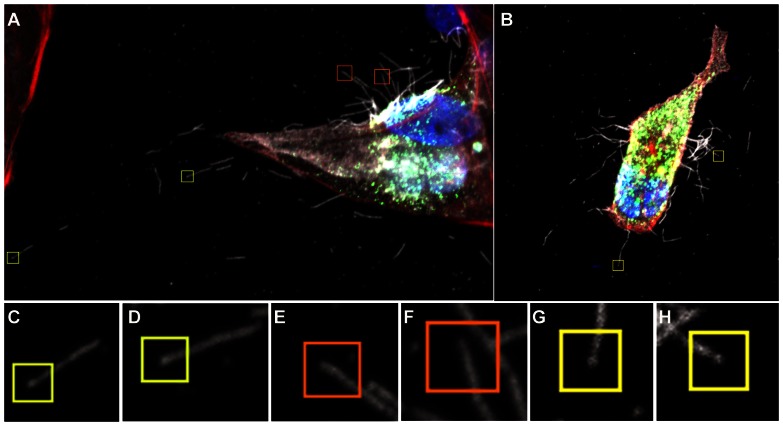
Figure 3
Close up view of filament formation at 8 hours (A) and 10 hours (B) post-infection showing the presence of bulbous termini at the end of some long filaments (C, D) and (G, H) indicated with a yellow box.
Many filaments were also seen that did not show stronger fluorescence at their termini, indicating that they were probably not Archetti bodies (E, F orange boxes). See also movie S1 .
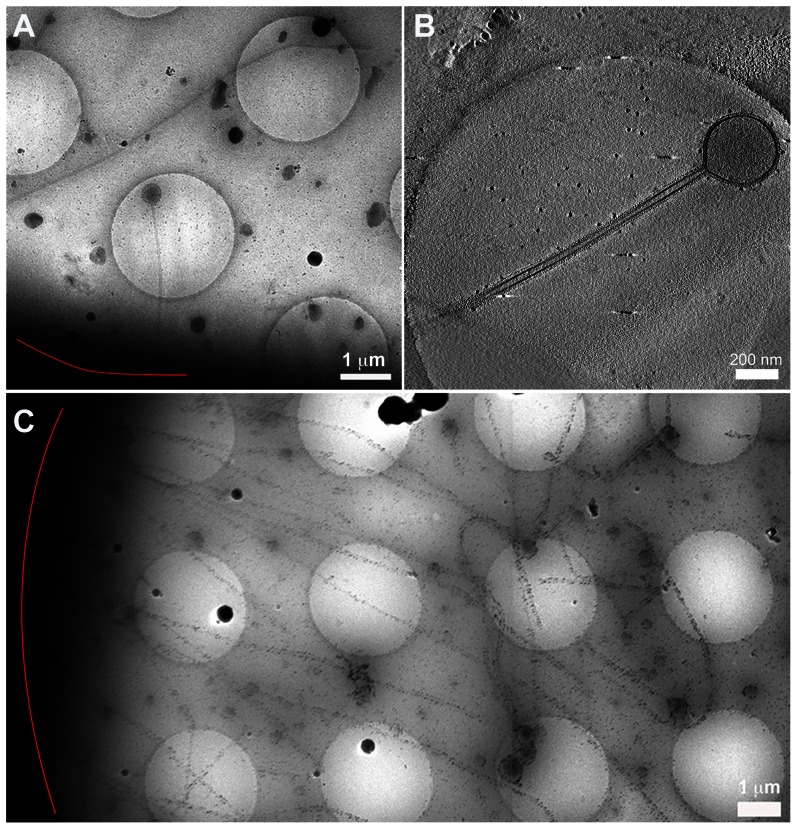
Figure 4
Cryomicroscopy and tomography of influenza A/Udorn/72 infected cells.
(A) Low magnification cryomicrograph of a long filament and Archetti body attached to a cell edge (red line). (B) A slice through a tomogram of the Archetti body shown in (A) reveals that the head was...
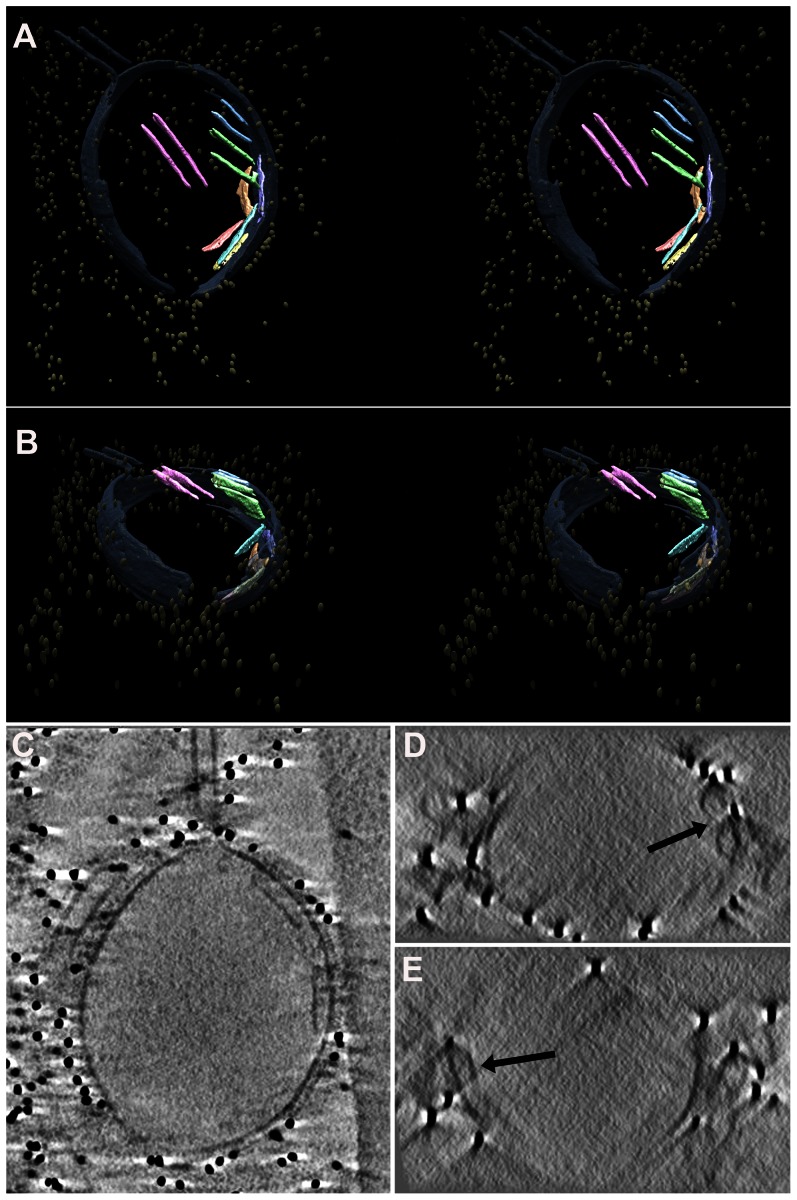
Figure 5
Segmentation of an Archetti body.
(A) Stereo images of a segmented and isosurface rendered terminal varicosity, viewed perpendicular to the vitreous ice layer and (B) at 55u00b0 to the viewing direction in (A). Density within the bulb...
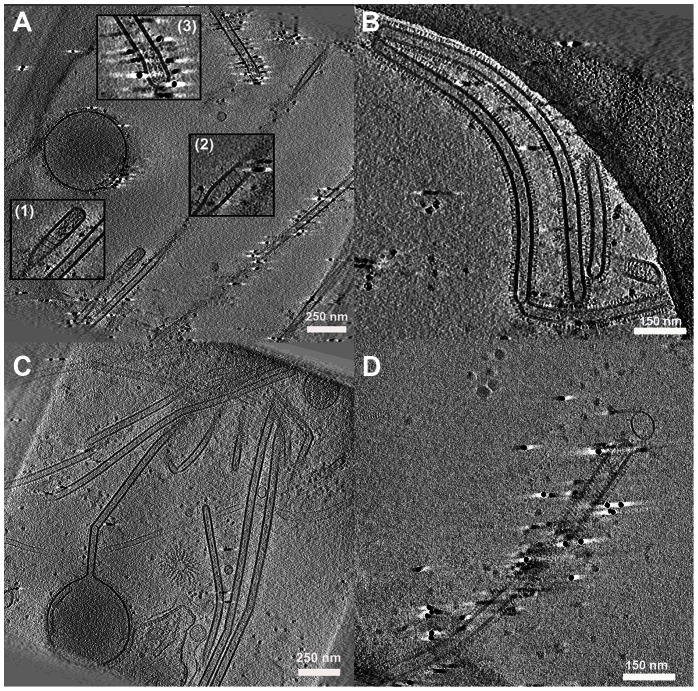
Figure 6
Cell associated long filamentous structures.
(A) Tomogram showing a large terminal varicosity and two filamentous particles that appear to contain RNPs at their ends (Insets 1 and 3). An extended helical structure is also seen, possibly M1 (Inse...
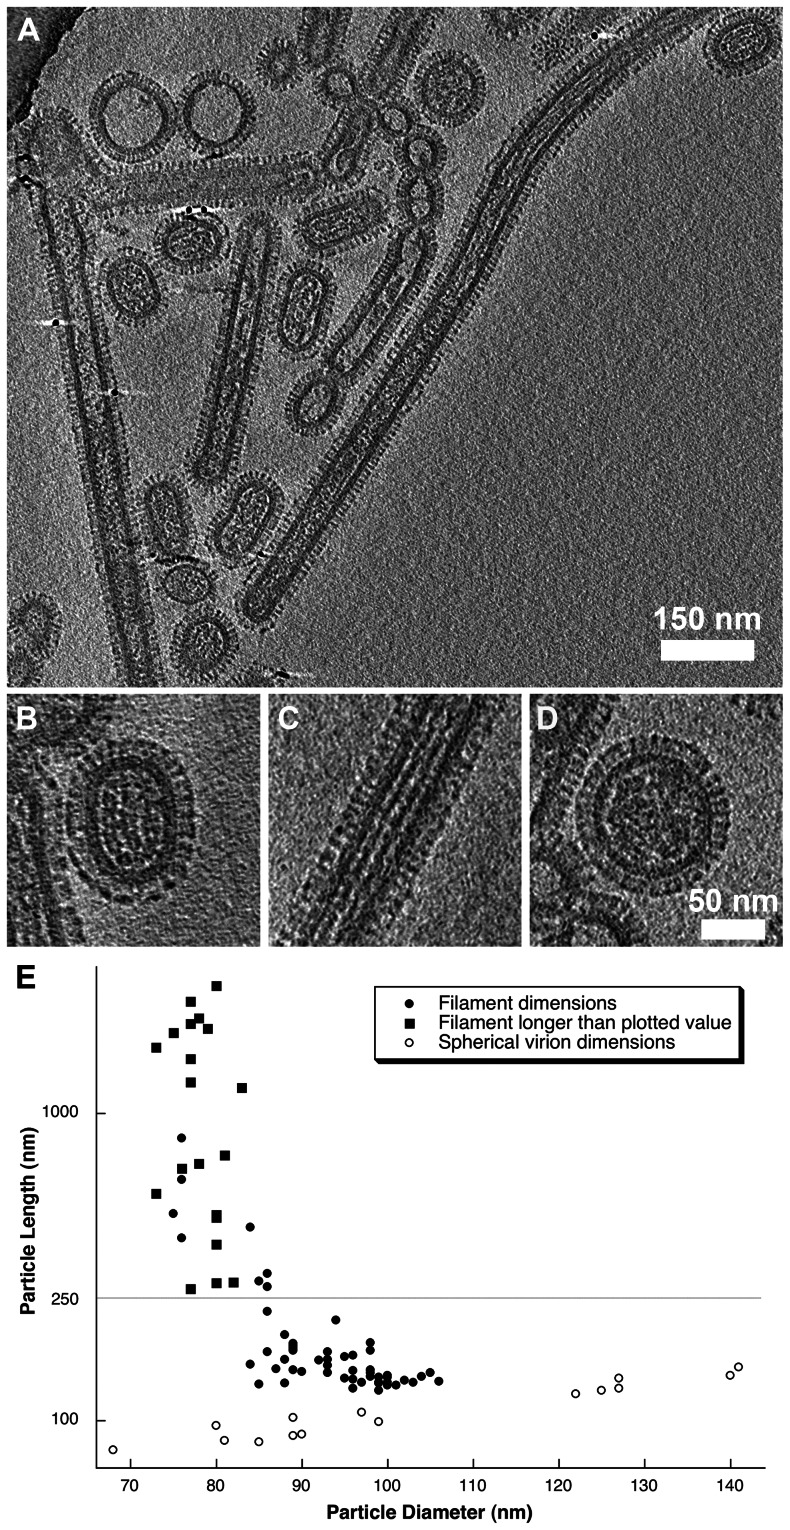
Figure 7
Tomograms of purified A/Udorn/72 virions (A).
Three distinct morphologies were observed: short-rods (B), longer filaments (C) and spherical virions (D). Length and diameter measurements from 96 particles were plotted (E) showing that filamentous ...
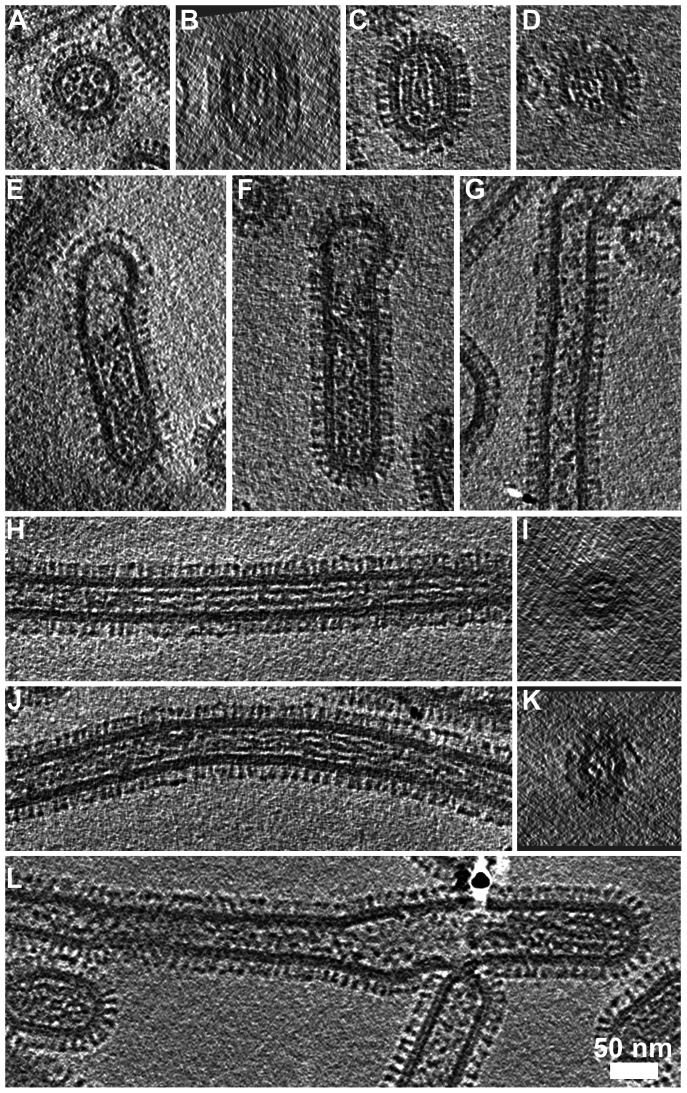
Figure 8
RNP arrangement and other internal components in the various classes of virions.
(A) Transverse sections through bacilliform particles revealed the characteristic arrangement of RNPs. (B) Longitudinal section of the particle in (A) showed three RNPs lying side-by-side. (C) Such vi...
Figure images are served from the NIH/NLM PubMed Central Open Access Subset or Europe PMC; copyright remains with the publishers and authors.
💬 Discussion
0 commentsNo comments yet. Be the first to start a discussion!
Leave a Comment