Abstract
Release of cell surface-bound ligands by A-Disintegrin-And-Metalloprotease (ADAM) transmembrane metalloproteases is essential for signalling by cytokine, cell adhesion, and tyrosine kinase receptors. For Eph receptor ligands, it provides the switch between cell-cell adhesion and repulsion. Ligand shedding is tightly controlled by intrinsic tyrosine kinase activity, which for Eph receptors relies on the release of an inhibitory interaction of the cytoplasmic juxtamembrane segment with the kinase domain. However, a mechanism linking kinase and sheddase activities had remained elusive. We demonstrate that it is a membrane-proximal localisation of the latent kinase domain that prevents ephrin ligand shedding in trans. Fluorescence lifetime imaging microscopy and electron tomography reveal that activation extends the Eph receptor tyrosine kinase intracellular domain away from the cell membrane into a conformation that facilitates productive association with ADAM10. Accordingly, EphA3 mutants with constitutively-released kinase domains efficiently support shedding, even when their kinase is disabled. Our data suggest that this phosphorylation-activated conformational switch of EphA3 directly controls ADAM-mediated shedding.
🔬 Techniques
🔭 Microscopes
🧬 Organisms
💻 Software
✨ Fluorophores
🧪 Sample Preparation
🔬 Cell Lines
🏭 Microscope Brands
🧪 Reagent Suppliers
📷 Detectors
🎨 Filters
💻 Software Details
🏛️ Research Organizations (ROR)
Affiliated research institutions:
📋 Methods
Expression Constructs Inactive EphA3 was made by substitution of residue K653 to M in EphA3-GFP [13] . Insertion into bovine ADAM10-HA [9] of a KpnI restriction site at C698 and removal of the ICD (retaining the C-terminal HA tag) yielded ADAMΔcyto. For EphA3-L-selectin, a NheI restriction site at EphA3 G565 together with annealed L-selectin ICD oligonucleotides (forward: 5′CTAGGAGATTAAAAAAAGGCAAGAAATCCAAGAGAAGTATGAATGACCC-ATATTAA ; reverse: 5′CTAGTTAATATGGGTCATTCATACTTCTCTTGGATTTCTT-GCCTTTTTTTAATCTC ) were inserted, with a terminal stop codon. For EphA3-AP N the AP-tag [37] was inserted after the EphA3 signal sequence (after Gly 20 ), and for EphA3-AP C the AP-tag was inserted into a XmaI site engineered into the EphA3 C-terminus (Val 983 ).
Biochemical Analyses
Cleaved ephrin-A5 was extracted from pooled Protein-A Sepharose-pre-cleared lysates and culture supernatants of cells that had been treated with pre-clustered or non-clustered ephrin-A5-Fc by using EphA3-Fc coupled to Protein-A-Sepharose. Pull-downs were analysed by anti-ephrin-A5 immunoblot. Cleavage of cell-surface ephrin-A5 was assayed in 1-h co-cultures of ephrin-A5-expressing HEK293T cells and EphA3/L-selectin transfected cells by extracting ephrin-A5 from cell lysates with EphA3-Fc coated Protein-A Sepharose. Where indicated, cells were treated prior to ephrin-A5-stimulation with CaM inhibitors trifluoperazine, calmidazolium (Calm), or W7, or metalloprotase inhibitors TAPI1 or GM6001 (Calbiochem). For CaM-co-precipitation EphA3/L-selectin and Wt EphA3 tagged with a biotin AP were biotinylated with BirA [37] and recovered on SA dynabeads. Other co-immunoprecipitation experiments were performed as indicated with anti-ADAM10 mAb (R&D Systems), anti-ADAM10 polyclonal Ab39177 (Abcam), with anti-EphA3 mAb IIIA4 [9] pre-coupled to mini-leak™ agarose (Kem-En-Tec, Copenhagen), and with anti-phosphotyrosine Sepharose (4G10, Upstate Biotechnology). Transient expression of all EphA3 constructs was optimised by transfecting each at four cDNA concentrations and selecting samples with similar expression levels by Western blotting total lysates. Western blotting was performed with antibodies against ephrin-A5 (R&D systems), EphA3 [43] , HA (3F10, Roche), ADAM10 (Biogenesis and Abcam Ab39177), phosphotyrosine (4G10, Upstate Biotechnology), and CaM (Upstate Biotechnology). Confocal Microscopy 3-channel confocal microscopy was performed by sequential scanning on Olympus FV1000 or Leica SP5 confocal microscopes. Quantitation of internalised ephrin-A5-associated fluorescence was achieved using ImageJ or Metamorph image analysis software by selecting regions of cells to exclude bead-associated fluorescence. Microscopic evaluation of ephrin cleavage by EphA3/L-selectin expressing cells, where ephrin-A5 was not internalised but remained complexed at the plasma membrane, was done by estimating the level of Alexa 488 -ephrin labelling relative to the expression level of the Alexa 647 IIIA4 anti-EphA3 antibody-stained receptor [15] on cell membranes ( Figure 4B ). Interactions between cell-surface ephrin-A5 and EphA3/L-selectin were analysed using ephrin-A5-GFP transfected cells [9] .
Show full methods section
Expression Constructs Inactive EphA3 was made by substitution of residue K653 to M in EphA3-GFP [13] . Insertion into bovine ADAM10-HA [9] of a KpnI restriction site at C698 and removal of the ICD (retaining the C-terminal HA tag) yielded ADAMΔcyto. For EphA3-L-selectin, a NheI restriction site at EphA3 G565 together with annealed L-selectin ICD oligonucleotides (forward: 5′CTAGGAGATTAAAAAAAGGCAAGAAATCCAAGAGAAGTATGAATGACCC-ATATTAA ; reverse: 5′CTAGTTAATATGGGTCATTCATACTTCTCTTGGATTTCTT-GCCTTTTTTTAATCTC ) were inserted, with a terminal stop codon. For EphA3-AP N the AP-tag [37] was inserted after the EphA3 signal sequence (after Gly 20 ), and for EphA3-AP C the AP-tag was inserted into a XmaI site engineered into the EphA3 C-terminus (Val 983 ).
Biochemical Analyses
Cleaved ephrin-A5 was extracted from pooled Protein-A Sepharose-pre-cleared lysates and culture supernatants of cells that had been treated with pre-clustered or non-clustered ephrin-A5-Fc by using EphA3-Fc coupled to Protein-A-Sepharose. Pull-downs were analysed by anti-ephrin-A5 immunoblot. Cleavage of cell-surface ephrin-A5 was assayed in 1-h co-cultures of ephrin-A5-expressing HEK293T cells and EphA3/L-selectin transfected cells by extracting ephrin-A5 from cell lysates with EphA3-Fc coated Protein-A Sepharose. Where indicated, cells were treated prior to ephrin-A5-stimulation with CaM inhibitors trifluoperazine, calmidazolium (Calm), or W7, or metalloprotase inhibitors TAPI1 or GM6001 (Calbiochem). For CaM-co-precipitation EphA3/L-selectin and Wt EphA3 tagged with a biotin AP were biotinylated with BirA [37] and recovered on SA dynabeads. Other co-immunoprecipitation experiments were performed as indicated with anti-ADAM10 mAb (R&D Systems), anti-ADAM10 polyclonal Ab39177 (Abcam), with anti-EphA3 mAb IIIA4 [9] pre-coupled to mini-leak™ agarose (Kem-En-Tec, Copenhagen), and with anti-phosphotyrosine Sepharose (4G10, Upstate Biotechnology). Transient expression of all EphA3 constructs was optimised by transfecting each at four cDNA concentrations and selecting samples with similar expression levels by Western blotting total lysates. Western blotting was performed with antibodies against ephrin-A5 (R&D systems), EphA3 [43] , HA (3F10, Roche), ADAM10 (Biogenesis and Abcam Ab39177), phosphotyrosine (4G10, Upstate Biotechnology), and CaM (Upstate Biotechnology). Confocal Microscopy 3-channel confocal microscopy was performed by sequential scanning on Olympus FV1000 or Leica SP5 confocal microscopes. Quantitation of internalised ephrin-A5-associated fluorescence was achieved using ImageJ or Metamorph image analysis software by selecting regions of cells to exclude bead-associated fluorescence. Microscopic evaluation of ephrin cleavage by EphA3/L-selectin expressing cells, where ephrin-A5 was not internalised but remained complexed at the plasma membrane, was done by estimating the level of Alexa 488 -ephrin labelling relative to the expression level of the Alexa 647 IIIA4 anti-EphA3 antibody-stained receptor [15] on cell membranes ( Figure 4B ). Interactions between cell-surface ephrin-A5 and EphA3/L-selectin were analysed using ephrin-A5-GFP transfected cells [9] .
FLIM
Time-domain confocal FLIM was performed in transiently transfected Cos7 cells grown on coverslips or glass bottom dishes (MatTek Corp.). FLIM images were obtained using an Olympus Fluoview 1000 microscope, equipped with a Picoharp 300 photon counting setup (Picoquant, Germany). GFP was excited with a 470 nm diode (Sepia II, Picoquant, Germany). Images of 512×512 pixels were acquired detecting approximately 10 8 photons. Images of the donor fluorescence decays were processed using the SymPhoTime software package (v4.2, Picoquant) and the calculated average fluorescence lifetime (τ) images are presented in pseudo-colour. The average fluorescence lifetime τ(xy) images were calculated from the parameters (a 1 ,a 2 ,τ 1 ,τ 2 ) of a double exponential fit of the fluorescence decay curves [F(x,y,t)] in each pixel: (1.1) At pixel x, y the average fluorescence lifetime is: (1.2) τ −1 -acceptor intensity (I a ) 2D-histograms were computed from the confocal FLIM images as described below for wide-field frequency-domain FLIM except that a bin size of 100 counts was used for the acceptor intensity. For wide-field frequency-domain FLIM ( Figure S9 ) we used an IX70 inverted microscope (Olympus, Japan) equipped with a 100/1.4 NA oil immersion lens, a 476 nm argon laser and narrow-band emission filter (HQ510/20; Chroma) for GFP, a 100-W mercury arc lamp with high Q Cy3 filter set (excitation filter, HQ545/30; dichroic, Q580LP; emission filter, HQ610/75) for RFP, and a dichroic beamsplitter (Q495 LP; Chroma Technology, Brattleboro, VT) and narrow-band emission filter. Raw FLIM data were processed in IPLab (Scanalytics, Fairfax, VA, USA) to generate a binary mask for the intensity threshold operation data and a mask for the ROI used in background correction of the raw data. Using the raw FLIM data and mask, phase- and modulation lifetime images were generated using scripts written in Python programming language ( http://www.python.org ) with the Numarray extension for numerical computing ( http://www.stsci.edu/resources/software_hardware/numarray ) further augmented with low-level routines written in C [44] , [45] . A cumulative 2D-histogram of fluorescence lifetime (τ) versus acceptor intensity (I a ) was generated from the multiple fluorescence phase-lifetime images (≥16 images) and corresponding acceptor intensity images using a bin size of 320 intensity units (arbitrary units). The standard error in the fluorescence lifetimes for each bin was calculated from the averages of all the images. The donor to acceptor energy transfer rate k T normalized to acceptor density (k T /acceptor) was obtained from the slope of a linear fit to the τ −1 −I a (acceptor intensity) 2D-histograms. The τ −1 −I a 2D-histograms were fitted to a linear equation: (1.3) in which prior knowledge of the fluorescence lifetime in the absence of acceptor (measured, τ d = 1.96 ns) was used to constrain the intercept, k d , to 0.51. The slope k T /acceptor is proportional to the energy transfer rate per acceptor yielding 1.9+/−0.16 for EphA3[3YF]-GFP, 0.56+/−0.08 for EphA3[2YE]-GFP and 1.27+/−0.16 for EphA3[2YE-KM]-GFP. The relative distance increase from GFP to the plasma membrane, comparing both conformations, (R 2YE /R 3YF ) can be calculated from: (1.4) yielding a distance increase of GFP to the plasma membrane of 1.36+/−0.06 for EphA3[2YE]-GFP relative to EphA3[3YF]-GFP. EM For EM we biotinylated AP-tagged EphA3 receptors in intact cells using either exogenous or co-transfected biotin ligase (BirA) [37] , as indicated, before labelling with SA-Qdots 605 (Invitrogen). Labelled cells were washed in PBS, fixed in 2.5% Glutaraldehyde, 2% sucrose for 40 min, and prepared on ice for EM by “epon” embedding: cells were rinsed in CaCo buffer (30 min), post-fixed in 2% osmium tetroxide (40 min), washed (water), and stained with 0.5% uranyl acetate (30 min). Fixed, washed cells were dehydrated in graded ethanol solutions, embedded in epon 812 (Serva), and hardened (48 h) at 60°C. Epoxy-embedded blocks were cut into 50 or 250 nm sections (Leica Ultracut S microtome) and mounted on Formvar coated grids. Grids were post-stained with led-citrate (1 min) at room temperature, rinsed with water, and air dried. AP C -EphA3 expressing cells, stably co-expressing APc-EphA3 together with a cytoplasmic form of BirA for efficient biotinylation of the AP-tagged EphA3 C-terminus, were either microinjected with Qdots prior to fixation (where indicated) or were fixed in 4% PFA, 0.5% Glutaraldehyde, 2% sucrose (30 min), permeabilised with 0.1% Triton ×100, and incubated with SA-Qdots 605 for 1 h. Washed samples were then fixed in 2.5% Glutaraldehyde, 2% sucrose, and prepared for EM as described above. This approach partially solubilises the plasma membrane and required computer-assisted assignment of the exact plasma membrane/cytoplasm boundaries.
Electron Tomography
We collected at room temperature single-axis tilt series of chemically fixed cells at 1–2° angular increment between −67° to +67° using CM200 and Tecnai 30 microscopes (FEI, Eindhoven, The Netherlands) and the Tietz tomography interface (Tietz, Gauting, Germany) for data acquisition. Serial EM images were recorded on 2 k×2 k and 4 k×4 k pixel CCD cameras at a defocus level of −2 µm, with a pixel size at the specimen level of 0.7 nm. We aligned the projection images of the samples using cross-correlation techniques. The merit figure of the aligned tilt-series had a value of approximately 1 nm, indicating no significant shrinkage of the sample. Reconstructions were performed [46] using weighted back-projection algorithms and visualized with isosurface and volume-rendering techniques in the Amira software package (Mercury Computer Systems, San Diego, CA, USA, www.amiravis.com ). We de-noised three-dimensional images with nonlinear anisotropic diffusion and semi-automatically segmented those using erosion and dilation operations after roughly segmenting regions of the reconstructions manually. Plasma membranes localisation in the electronic images was semi-automated, with their boundaries determined using dilation and erosion operations. Qdot detection was fully automated according to their size and contrast using thresholding techniques [46] .
Supporting Information Figure S1 Tyrosine phosphorylation and ADAM10 association of EphA3 mutants. (A) Phosphorylation of Wt and mutant EphA3 after incubation with clustered ephrinA5 Fc. HEK293T cell clones stably expressing either Wt or kinase inactive EphA3[K653M], or parental HEK293T cells, were incubated with vehicle control (−), with non-clustered (NC) or clustered (C) ephrinA5-Fc for 15 min prior to lysis. EphA3 immuno-precipitates were analysed by Western blot with anti-phosphotyrosine (α-PY) and lysates with anti-EphA3 antibodies as indicated. (B) The EphA3/ADAM10 association does not require their ICDs. α-HA immunoprecipitates from cells expressing HA-ADAM10, and/or Wt EphA3 or EphA3[ΔICD], were immunoblotted for EphA3 (top) or ADAM10 (bottom); total lysates were probed for EphA3 (right). (U), unprocessed; (P), processed ADAM10. Single exposures of blots are shown with non-relevant lanes removed. (0.64 MB TIF) Click here for additional data file. Figure S2 Inhibition of EphA3ΔICD-dependent ephrin cleavage by metalloprotease inhibitors. Cells transiently expressing EphA3[ΔICD] were incubated 1 h with the metalloprotease inhibitor GM6001 (10 and 20 µM) or the ADAM-specific inhibitor TAPI1 (50 µM) prior to incubation with Alexa 594 -ephrin-A5-coated beads. After 40 min the cells were placed on ice, stained with anti-EphA3 (IIIA4)-Alexa 647 , fixed and imaged by confocal microscopy. (4.45 MB TIF) Click here for additional data file. Figure S3 Cell surface expression and ephrin binding capacity of EphA3 mutants. HEK293T cells were transfected with Wt or mutant EphA3-GFP constructs as indicated and analysed for cell surface EphA3 expression by labelling with Alexa 647 -conjugated IIIA4 anti-EphA3 antibody specific for the native EphA3 conformation [13] and with Alexa 594 -conjugated ephrinA5-Fc (ephrinA5-Alexa 594 ). Flow cytometric analysis shows cell surface receptor expression (α-EphA3-Alexa 647 ) relative to overall expression level (GFP) and to the ability of cells to bind ephrin-A5-Alexa 594 . The fraction of GFP-tagged EphA3 protein on the cell surface was estimated as fraction of GFP-tagged receptor recognised by the anti-EphA3 antibody: all EphA3 ICD mutants are expressed at the plasma membrane and bind the IIIA4 antibody and ephrin-A5 at levels similar to the Wt receptor. (0.96 MB TIF) Click here for additional data file. Figure S4 Phosphotyrosine profile and ADAM10 binding capacity of EphA3 JM mutants. (A) Phosphotyrosine profile in cells transfected transiently to express Wt EphA3 and JM mutants. HEK293T cells were transfected with expression constructs for Wt EphA3-GFP or derived mutants, as indicated, and cells treated with non-clustered or pre-clustered ephrin-A5 Fc for 10 min. Anti-phosphotyrosine (PY) antibody (4G10) immuno-precipitates from whole cell lysates were probed with anti-PY, and total lysates with anti-EphA3 antibodies, as indicated. Positions on the Western blot corresponding to molecular weights of GFP-EphA3 and IgG (heavy and light chains) are indicated on the left. Phosphorylated protein bands at the GFP-EphA3 position in the left panel are likely due to auto-phosphorylation due to high transient over-expression of the EphA3 constructs in these samples. (B) ADAM10 association with Wt and mutant EphA3. ADAM10 immunoprecipitates and total cell lysates from Wt or mutant (as indicated) EphA3-transfected cells (ephrin-A5-treated) were analysed for EphA3 and ADAM10 by immunoblot. Single exposures of blots are shown with non-relevant lanes removed. (1.02 MB TIF) Click here for additional data file. Figure S5 The extended (active) EphA3 ICD conformation is sufficient for ephrin cleavage, while internalisation requires an intact kinase. (A) Cells expressing Wt EphA3-GFP, EphA3[2YE]-GFP, or kinase-inactive EphA3[2YE KM]-GFP were incubated with Alexa 594 ephrinA5-coated beads or (B) pre-clustered, soluble Alexa 594 ephrinA5. EphA3-GFP (green) and Alexa 594 ephrin (red) fluorescence in fixed cells was imaged by confocal microscopy. Individual micrographs from fluorescent channels, the merged images, and phase-contrast images are shown. Yellow arrow heads denote areas of sustained interactions between cell surface EphA3 and ephrin-A5 beads. White arrows mark cell-membrane areas with bound- but not internalised Alexa 594 ephrin. (2.71 MB TIF) Click here for additional data file. Figure S6 Removal of the ADAM10 ICD reconstitutes ephrin shedding in cells expressing EphA3 JX mutants. (A) Confirmation that ADAM10−/− MEFs do not contain detectable ADAM10. Lysates of HEK293Ts, ADAM10−/−, or Wt MEFs were immunoprecipitated with 1, protein A beads alone; or with 2, anti-human specific ADAM10 monoclonal antibodies (RND); or 3, with anti-ADAM10 polyclonal antibodies (Abcam). Immunoprecipitates were immuno-blotted with polyclonal anti-ADAM10 antibodies. U, unprocessed; P, processed ADAM10. (B) ADAM10−/− MEFs transfected with combinations of GFP-tagged EphA3 (Wt, ΔJXS, or ΔJXL) and HA-tagged ADAM10 (Wt, ΔMP, or ΔICD) were incubated with Alexa 594 ephrinA5-coated beads. After 40 min the cells were fixed, permeabilised, and stained with anti-HA and Alexa 647 -labelled secondary antibodies. Images show single-section confocal micrographs, together with the merged images (EphA3-GFP, green; Alexa 594 - ephrin-A5, red; Alexa 647 -anti-HA, blue). (4.57 MB TIF) Click here for additional data file. Figure S7 CaM inhibitors regulate association of EphA3-L-selectin with CaM and with ADAM10 and trigger ephrinA5 shedding by EphA3-L-selectin expressing cells. (A) CaM inhibitors block association of CaM with EphA3-L-selectin. Cells expressing AP-tagged EphA3/L-selectin or Wt AP-EphA3 were treated with CaM inhibitors trifluoperazine (TFP) or Calm or vehicle control, as indicated. Following biotinylation of AP-tagged receptors, EphA3 complexes were recovered by SA pulldown and analysed by Western blot with anti-CaM and anti-EphA3 antibodies. The positions of Wt EphA3 and of the EphA3/L-selectin fusion protein are indicated. (B) CaM inhibitors modulate the association of EphA3/L-selectin with ADAM10. HEK293T cells expressing EphA3/L-selectin (left panels) or Wt EphA3 (right panels) were pre-treated (30 min) with CaM inhibitors TFP (20 µM), Calm (2 µM), N-6-Aminohexyl0-5-chloro-1-naphthalenesulfonamide (W7, 100 µM), or vehicle control before lysis. ADAM10 immunoprecipitates were analysed by Western blot with anti-EphA3 or anti-ADAM10 antibodies, and total lysates with anti-EphA3 antibodies, as indicated. The graph shows amounts of EphA3/L-selectin (left panels) or EphA3 (right panels) in ADAM10 immunoprecipitates relative to control lanes as determined by densitometry. (C) Mutation of the CaM-binding site in EphA3-L-selectin reduces its ability to support ephrinA5 cleavage. L358E and K359E substitutions, reported to affect CaM binding to the L selectin cytoplasmic domain, were introduced into the EphA3/L selectin chimera to produce EphLsel EE. HEK293T cells, transfected with Wt EphA3-L-selectin or with EphLsel EE were incubated with Alexa 594 -labelled ephrinA5 beads; the capacity to promote ephrin cleavage was monitored by measuring ephrin labelling of the cell membrane. Ephrin labelling relative to receptor expression was determined in 50 regions from five individual micrographs for each sample. The mean+/−SEM are shown in the graph. (1.48 MB TIF) Click here for additional data file. Figure S8 CaM-binding to chimeric EphA3/L-selectin regulates ephrin cleavage from cells. (A) Microscopic analysis of cleavage of GFP-ephrinA5 from cells. EphA3/L-selectin transfected HEK293T cells were pre-treated (15 min) with CaM inhibitors trifluoperazine (TFP, 15 µM), Calm (2 µM), W7 (50 µM), or vehicle control before incubation (1 h) with cells expressing GFP-ephrinA5. Cell surface EphA3/L-selectin (Alexa 647 α-EphA3 antibody, red) and GFP-ephrinA5 (green) were imaged in fixed cells by confocal microscopy, micrographs from individual green and red fluorescence channels, and merged images are shown. The outline of GFP-ephrin-A5 expressing cells is indicated (….) for clarity. The open arrow head points at the interface between untreated, EphA3/L-selectin, and GFP-ephrinA5 cells. Yellow arrowheads indicate areas on CaM-inhibitor-treated EphA3/L-selectin cells that are not in direct contact with GFP-ephrin-A5 expressing cells but reveal obvious ephrin staining. (B) Biochemical analysis of GFP-ephrinA5 cleavage from cells. EphA3/L-selectin transfected HEK293T cells were pre-treated as in (A) with TFP, Calm, or vehicle control, then incubated for 1 h with stably transfected ephrinA5/HEK293T cells. Ephrin-A5 was recovered from cell lysates by pulldown with EphA3-Fc beads and detected on Western blot with α-ephrinA5 antibodies. Full-length and cleaved ephrin are indicated. Total lysates were also probed for EphA3/L-selectin expression with α-EphA3 antibodies (bottom). Cleaved ephrin-A5 was quantitated by densitometry. (2.57 MB TIF) Click here for additional data file. Figure S9 FLIM analysis of the EphA3-ICD reveals extension of the activated EphA3 transmembrane domain. (A) Wide field frequency domain FLIM time-series of EphA3-GFP (green) and tkRas RFP (red) co-transfected COS7 cells at indicated times (min) after ephrin-A5 stimulation. Upper row: EphA3-GFP fluorescence intensity images. Lower row: fluorescence phase lifetime (τ ϕ ) images of EphA3-GFP colour bar inset indicates the fluorescence lifetime range in ns. Lower image: tkRas RFP fluorescence intensity image. (B) Histograms of GFP phase lifetimes τ Φ calculated on a pixel-by-pixel basis for the cells displayed in (A). (C) Example of GFP phase (τ Φ ) and modulation (τ M ) fluorescence lifetime images obtained by FLIM to generate τ 1 -acceptor 2D-histograms ( Figure 5F ) of tkRas RFP-COS7 cells co-expressing Wt, [2YE], [2YE KM], or [3YF] EphA3-GFP. Strong (cytosolic) EphA3 GFP fluorescence was blacked out to exclude areas where the detector was saturated. Cumulative (2D) phase (τ Φ ) and modulation (τ M ) fluorescence lifetime histograms of cell populations (right panels) indicate significant fluorescence lifetime differences between EphA3-GFP-[2YE] and EphA3-GFP-[3YF]. (D) The Kolmogorov-Smirnov (KS) test was performed to assess if fluorescence lifetimes of either EphA3-GFP [3YF] or EphA3-GFP [2YE] measured in a large population of tkRasRFP-Cos7 cells are distinct. A highly significant ( p
📊 Figures
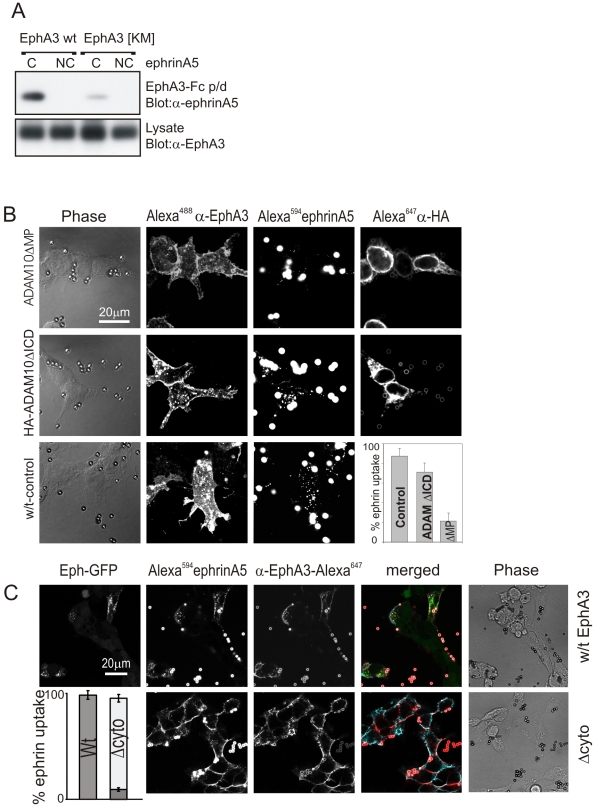
Figure 1
Ephrin shedding is inhibited by lack of kinase activity but not by cytoplasmic truncation of EphA3 or ADAM10.
(A) EphA3 kinase activity is required for effective ephrin cleavage. HEK293T cells expressing EphA3 Wt or EphA3[KM] (with a mutated ATP-binding site, K 653 u2192M) were treated with clustered (C) or n...
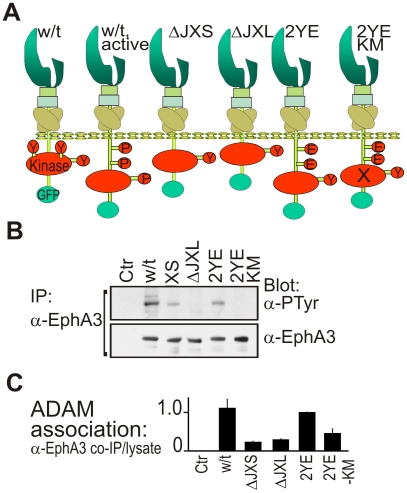
Figure 2
Mutation of the JM domain affects EphA3 phosphorylation and ADAM10 association.
(A) Schematic structure of Wt EphA3-GFP and derived ICD mutants (see text for details) that were used in these studies. Y, tyrosine; P, phospho-tyrosine; E, glutamate (pseudophosphorylation) ; X, inac...
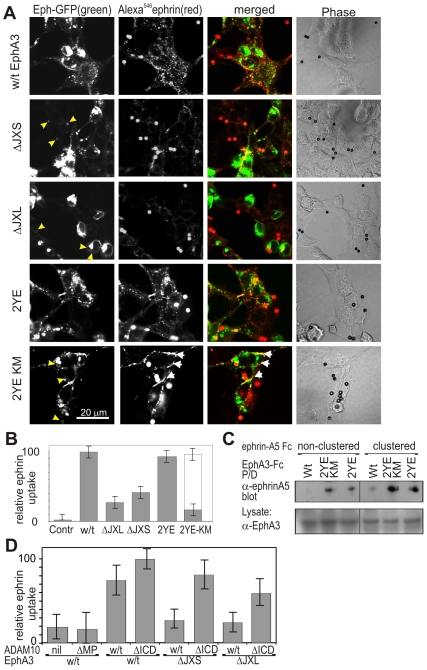
Figure 3
EphA3 JM and kinase domain mutations affect ephrin-A5 shedding and internalisation, respectively.
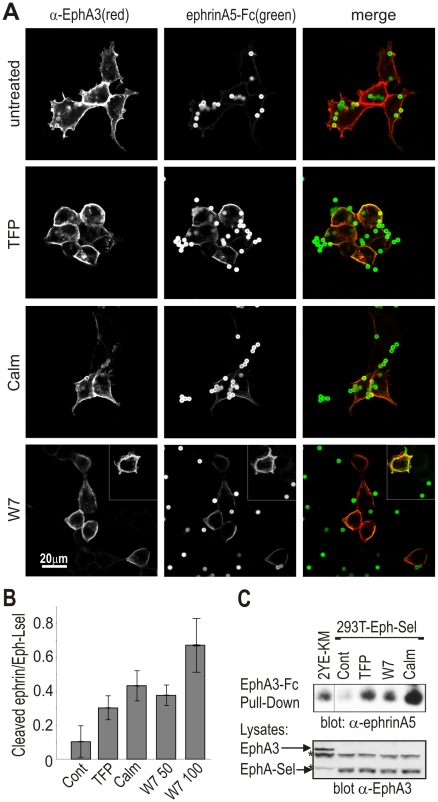
Figure 4
CaM-binding to chimeric EphA3/L-selectin regulates ephrin cleavage.
(A) Confocal analysis of ephrin release: EphA3/L-selectin transfected HEK293T cells were pre-treated with CaM inhibitors trifluoperazine dimaleate (TFP, 15 u00b5M), Calm (2 u00b5M), W7 (N-6-Aminohexyl...
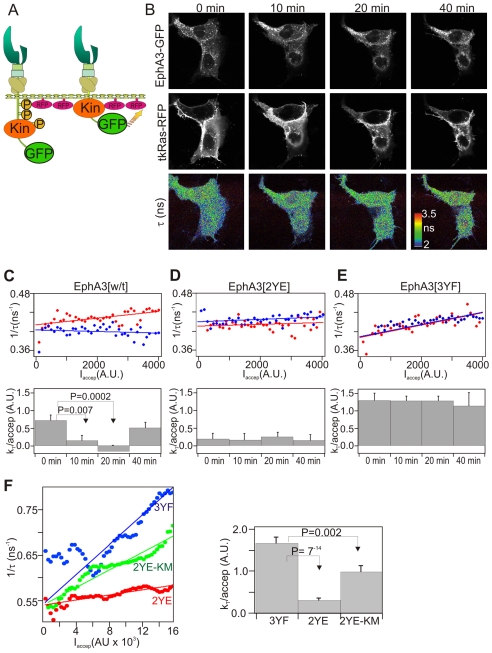
Figure 5
FLIM analysis shows EphA3 activation accompanies extension of the cytoplasmic domain.
(A) Schematic of the FRET-assay; FRET (yellow arrow) reflects the proximity between the GFP on the EphA3 C-terminus and tkRas RFP on the inner plasma membrane (Kin, kinase domain). (B) Confocal FLIM t...
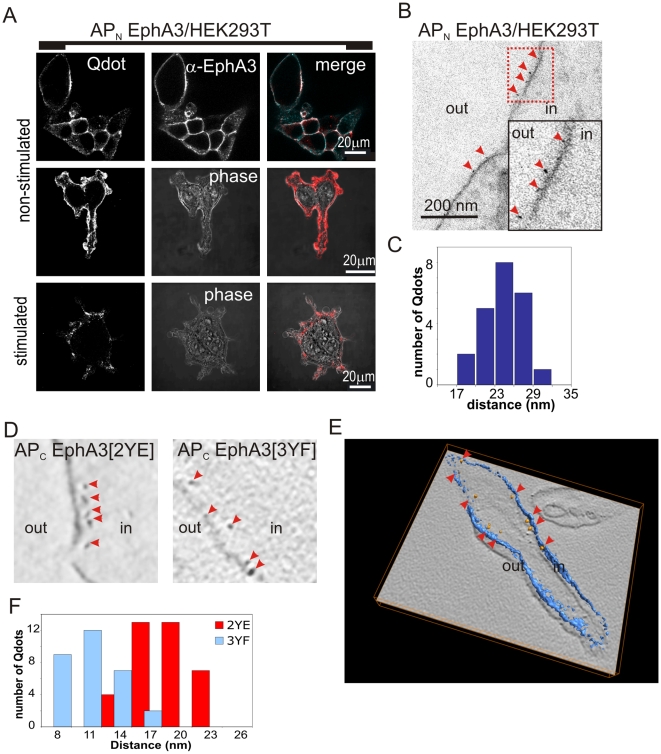
Figure 6
EM of Qdot labelled EphA3 reveals the molecular span to the plasma membrane.
(A) Confocal microscopic images of AP N EphA3/HEK293T cells, biotinylated with recombinant biotin ligase (BirA) and labelled with SA-Qdots 605 . Cells were left non-stimulated (top and middle panel) o...
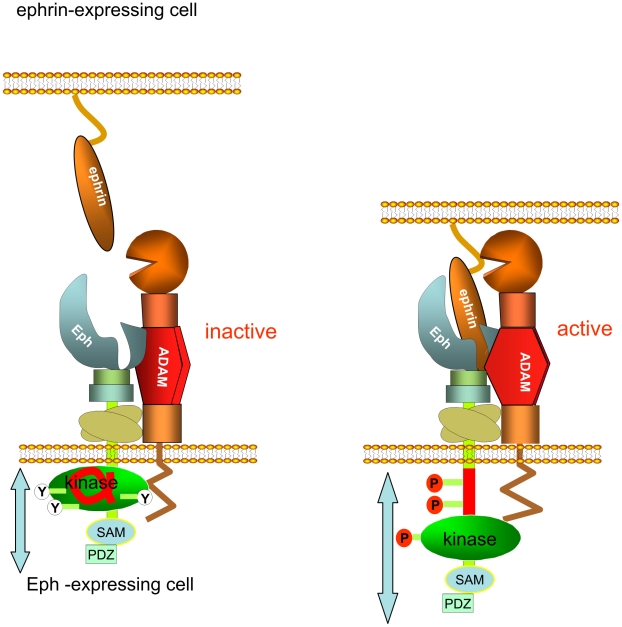
Figure 7
Model for activation-mediated release of the membrane-proximal Eph kinase domain promoting productive ADAM10 alignment and ephrin shedding.
The (helical) JM segment (red) of the unligated Eph receptor is tethered to the small (N-terminal) lobe of the kinase [24] , keeping the kinase domain (green) in an inactive, membrane-proximal conform...
Figure images are served from the NIH/NLM PubMed Central Open Access Subset or Europe PMC; copyright remains with the publishers and authors.
💬 Discussion
0 commentsNo comments yet. Be the first to start a discussion!
Leave a Comment