Abstract
Dynein-decorated doublet microtubules (DMTs) are critical components of the oscillatory molecular machine of cilia, the axoneme, and have luminal surfaces patterned periodically by microtubule inner proteins (MIPs). Here we present an atomic model of the 48-nm repeat of a mammalian DMT, derived from a cryoelectron microscopy (cryo-EM) map of the complex isolated from bovine respiratory cilia. The structure uncovers principles of doublet microtubule organization and features specific to vertebrate cilia, including previously unknown MIPs, a luminal bundle of tektin filaments, and a pentameric dynein-docking complex. We identify a mechanism for bridging 48- to 24-nm periodicity across the microtubule wall and show that loss of the proteins involved causes defective ciliary motility and laterality abnormalities in zebrafish and mice. Our structure identifies candidate genes for diagnosis of ciliopathies and provides a framework to understand their functions in driving ciliary motility.
🔬 Techniques
🔭 Microscopes
🧬 Organisms
💻 Software
✨ Fluorophores
🧪 Sample Preparation
🔬 Cell Lines
🏭 Microscope Brands
🧪 Reagent Suppliers
📷 Detectors
🔎 Objectives
🎨 Filters
💻 Software Details
💾 Data Repositories
🏛️ Research Organizations (ROR)
Affiliated research institutions:
📋 Methods
RESOURCE AVAILABILITY
Lead contact Further information and requests for resources and reagents should be directed to and will be fulfilled by the Lead Contact, Alan Brown ( alan_brown@hms.harvard.edu ).
Materials availability
Zebrafish lines generated by the authors will be distributed without restriction upon request. The mouse 1700007K13Rik tm2b(EUCOMM)Wtsi and Ccpg1os em1(IMPC)H alleles are available through the International Mouse Phenotyping Consortium (IMPC; https://www.mousephenotype.org/ ). Plasmids generated in this study will be distributed without restriction on request.
Data and code availability
The cryo-EM map of the outer dynein arm (ODA) core from bovine tracheal cilia and the composite cryo-EM map of the 48-nm repeat of the bovine DMT have been deposited in the Electron Microscopy Data Bank with accession codes EMD-24663 and EMD-24664, respectively. The consensus map, mask, and local refined maps have been deposited as additional files. The atomic model of the 48-nm repeat of the bovine DMT has been deposited in the Protein Data Bank with the accession code 7RRO. This paper does not report original code. Any additional information required to reanalyze the data reported in this paper is available from the lead contact upon request.
EXPERIMENTAL MODEL AND SUBJECT DETAILS Bacterial strains Escherichia coli
DH5α cells (Thermo Fisher Scientific and New England Biolabs) were used for the propagation of all vectors and plasmids. Bacterial colonies were cultured on LB agar plates or in liquid LB medium supplemented with the appropriate antibiotic for selection at a concentration of 100 μg/ml. LB agar plates and liquid cultures were incubated for 14-16 hours at 37°C prior to isolation of vector or plasmid DNA. Transformations were carried out following an established standard protocol. Zebrafish husbandry, strains, and mutagenesis Zebrafish strains used in this study were maintained at the Institute of Molecular and Cell Biology (IMCB, Singapore) zebrafish facility following routine husbandry procedure. The facility has a controlled temperature of 28.5°C and operates a 14-hr light and 10-hr dark light cycle. All experiments with the zebrafish were conducted with approval of the Singapore National Advisory Committee on Laboratory Animal Research. The zebrafish strains used in the study are listed in the Key resources table . All experiments were carried out on zebrafish embryos and larvae between 10 somites and 72 hpf stages. There was no sex bias and paired matings were set up using adult zebrafish between 4 and 8 months of age. Mouse husbandry, stains, and mutagenesis Ethical approval for all mouse work was obtained from the UK Home Office and experiments were carried out in accordance with the Medical Research Council (MRC) Harwell Ethics Committee. All mouse colonies were maintained in a pathogen-free environment at the Mary Lyon Centre, MRC Harwell Institute on a C57BL/6N background strain. The 1700007K13Rik tm2b(EUCOMM)Wtsi allele ( Pierce1 tm2b) was created at the Wellcome Sanger Institute as part of the European Conditional Mouse Mutagenesis Program (EUCOMM). The Ccpg1os em1(IMPC)H allele ( Pierce2 DEL ) was created at the Mary Lyon Centre as part of the International Mouse Phenotyping Consortium (IMPC). Mice were housed in groups of 2-5 with controlled temperature (21 ± 2°C) and humidity (55 ± 10%) in a 12-hour light/dark cycle. Mice had free access to water and were fed ad libitum on a commercial diet (Special Diet Services, UK). Mice were sacrificed either by cervical dislocation or overdose of anesthetic. The mouse embryos analyzed were a random mixture of males and females; their sex was not determined. Adult mouse cohorts included equal numbers of males and females; no sex-based phenotypic differences were detected. METHOD DETAILS Isolation of bovine tracheal cilia The protocol for isolating bovine tracheal cilia was modified from ( Anderson and Hein, 1976 ; Hastie, 1995 ; Hastie et al., 1986 ). Fresh bovine tracheae were collected from Adam’s Farm (Athol, MA) and stored in PBS (137 mM NaCl, 2.7 mM KCl, 10 mM Na 2 HPO 4 , 1.8 mM KH 2 PO4, pH 7.4) on ice for the drive back to the lab (approximately 90 min). The following extraction and purification steps were carried out at 4°C. The tracheae were washed with PBS and excess tissue was removed. A nylon brush was carefully inserted into the trachea to brush the epithelium lightly. The brush was washed with about 100 mL extraction buffer (20 mM Tris, pH 7.4, 50 mM NaCl, 1 mM Ethylenediaminetetraacetic acid (EDTA), 7 mM β-mercaptoethanol, 10 mM CaCl 2 , 250 mM sucrose, 0.1% 3-[(3-Cholamidopropyl) dimethylammonio]-1-propanesulfonate (CHAPS) (w/v)), which was subsequently filled into the trachea. Both ends of the flesh tube were sealed by parafilm and rubber bands, and the trachea filled with extraction buffer was shaken vigorously for about 2 min. The buffer was collected, and the trachea was rinsed with another 100 mL extraction buffer without CHAPS. The combined buffer samples (final concentration of CHAPS: 0.05%) were passed through a sieve to separate any residual tissue. The flow through was filled into 1 L centrifugation tubes and centrifuged at 2,000 × g for 2 min. The supernatant was carefully transferred to 175 mL conical centrifugation tubes and centrifuged at 12,000 × g for 30 min. The cilia containing pellet was resuspended in RB buffer (30 mM HEPES, pH 7.4, 5 mM MgCl 2 , 1 mM 1,4-dithiothreitol (DTT), 0.5 mM EDTA, 50 mM KCl, protease inhibitor (Roche)). Several rounds of low speed (2,000 × g) and high speed (13,300 × g) centrifugation were performed to clean up the cilia. The final cilia pellet was resuspended in RB buffer. The sample was analyzed by negative-stain electron microscopy for cilia concentration, integrity, and purity. The sample was flash-frozen in liquid nitrogen and stored at −80°C.
Show full methods section
RESOURCE AVAILABILITY
Lead contact Further information and requests for resources and reagents should be directed to and will be fulfilled by the Lead Contact, Alan Brown ( alan_brown@hms.harvard.edu ).
Materials availability
Zebrafish lines generated by the authors will be distributed without restriction upon request. The mouse 1700007K13Rik tm2b(EUCOMM)Wtsi and Ccpg1os em1(IMPC)H alleles are available through the International Mouse Phenotyping Consortium (IMPC; https://www.mousephenotype.org/ ). Plasmids generated in this study will be distributed without restriction on request.
Data and code availability
The cryo-EM map of the outer dynein arm (ODA) core from bovine tracheal cilia and the composite cryo-EM map of the 48-nm repeat of the bovine DMT have been deposited in the Electron Microscopy Data Bank with accession codes EMD-24663 and EMD-24664, respectively. The consensus map, mask, and local refined maps have been deposited as additional files. The atomic model of the 48-nm repeat of the bovine DMT has been deposited in the Protein Data Bank with the accession code 7RRO. This paper does not report original code. Any additional information required to reanalyze the data reported in this paper is available from the lead contact upon request.
EXPERIMENTAL MODEL AND SUBJECT DETAILS Bacterial strains Escherichia coli
DH5α cells (Thermo Fisher Scientific and New England Biolabs) were used for the propagation of all vectors and plasmids. Bacterial colonies were cultured on LB agar plates or in liquid LB medium supplemented with the appropriate antibiotic for selection at a concentration of 100 μg/ml. LB agar plates and liquid cultures were incubated for 14-16 hours at 37°C prior to isolation of vector or plasmid DNA. Transformations were carried out following an established standard protocol. Zebrafish husbandry, strains, and mutagenesis Zebrafish strains used in this study were maintained at the Institute of Molecular and Cell Biology (IMCB, Singapore) zebrafish facility following routine husbandry procedure. The facility has a controlled temperature of 28.5°C and operates a 14-hr light and 10-hr dark light cycle. All experiments with the zebrafish were conducted with approval of the Singapore National Advisory Committee on Laboratory Animal Research. The zebrafish strains used in the study are listed in the Key resources table . All experiments were carried out on zebrafish embryos and larvae between 10 somites and 72 hpf stages. There was no sex bias and paired matings were set up using adult zebrafish between 4 and 8 months of age. Mouse husbandry, stains, and mutagenesis Ethical approval for all mouse work was obtained from the UK Home Office and experiments were carried out in accordance with the Medical Research Council (MRC) Harwell Ethics Committee. All mouse colonies were maintained in a pathogen-free environment at the Mary Lyon Centre, MRC Harwell Institute on a C57BL/6N background strain. The 1700007K13Rik tm2b(EUCOMM)Wtsi allele ( Pierce1 tm2b) was created at the Wellcome Sanger Institute as part of the European Conditional Mouse Mutagenesis Program (EUCOMM). The Ccpg1os em1(IMPC)H allele ( Pierce2 DEL ) was created at the Mary Lyon Centre as part of the International Mouse Phenotyping Consortium (IMPC). Mice were housed in groups of 2-5 with controlled temperature (21 ± 2°C) and humidity (55 ± 10%) in a 12-hour light/dark cycle. Mice had free access to water and were fed ad libitum on a commercial diet (Special Diet Services, UK). Mice were sacrificed either by cervical dislocation or overdose of anesthetic. The mouse embryos analyzed were a random mixture of males and females; their sex was not determined. Adult mouse cohorts included equal numbers of males and females; no sex-based phenotypic differences were detected. METHOD DETAILS Isolation of bovine tracheal cilia The protocol for isolating bovine tracheal cilia was modified from ( Anderson and Hein, 1976 ; Hastie, 1995 ; Hastie et al., 1986 ). Fresh bovine tracheae were collected from Adam’s Farm (Athol, MA) and stored in PBS (137 mM NaCl, 2.7 mM KCl, 10 mM Na 2 HPO 4 , 1.8 mM KH 2 PO4, pH 7.4) on ice for the drive back to the lab (approximately 90 min). The following extraction and purification steps were carried out at 4°C. The tracheae were washed with PBS and excess tissue was removed. A nylon brush was carefully inserted into the trachea to brush the epithelium lightly. The brush was washed with about 100 mL extraction buffer (20 mM Tris, pH 7.4, 50 mM NaCl, 1 mM Ethylenediaminetetraacetic acid (EDTA), 7 mM β-mercaptoethanol, 10 mM CaCl 2 , 250 mM sucrose, 0.1% 3-[(3-Cholamidopropyl) dimethylammonio]-1-propanesulfonate (CHAPS) (w/v)), which was subsequently filled into the trachea. Both ends of the flesh tube were sealed by parafilm and rubber bands, and the trachea filled with extraction buffer was shaken vigorously for about 2 min. The buffer was collected, and the trachea was rinsed with another 100 mL extraction buffer without CHAPS. The combined buffer samples (final concentration of CHAPS: 0.05%) were passed through a sieve to separate any residual tissue. The flow through was filled into 1 L centrifugation tubes and centrifuged at 2,000 × g for 2 min. The supernatant was carefully transferred to 175 mL conical centrifugation tubes and centrifuged at 12,000 × g for 30 min. The cilia containing pellet was resuspended in RB buffer (30 mM HEPES, pH 7.4, 5 mM MgCl 2 , 1 mM 1,4-dithiothreitol (DTT), 0.5 mM EDTA, 50 mM KCl, protease inhibitor (Roche)). Several rounds of low speed (2,000 × g) and high speed (13,300 × g) centrifugation were performed to clean up the cilia. The final cilia pellet was resuspended in RB buffer. The sample was analyzed by negative-stain electron microscopy for cilia concentration, integrity, and purity. The sample was flash-frozen in liquid nitrogen and stored at −80°C.
Preparation of bovine DMTs
The purified cilia were demembranized by adding NP-40 detergent (Thermo Fisher Scientific) to a final concentration of 0.5% and incubated at 4°C for 30 min. The sample was centrifuged at 12,000 × g for 20 min. The supernatant was removed and the pellet was resuspended in RB buffer to an A280 concentration of 0.5-2.1 mM ATP was added to the sample and incubated at room temperature for 20 min. If any pellet remained after incubation, ATP up to a concentration of 2.5 mM was added and the sample was incubated again at room temperature for another 10-20 min. After incubation, the sample was centrifuged at 6,000 × g for 20 min and the pellet was resuspended in RB buffer to an A280 concentration of ~10 for cryo-grid preparation.
Purification of tektin filaments
Tektin filaments were purified following a published protocol ( Pirner and Linck, 1994 ). Briefly, purified cilia were demembranized by adding CHAPS detergent to a final concentration of 2% and incubated at 4°C for 30 min, followed by a centrifugation at 6,000 × g for 10 min. The pellet was resuspended in tektin buffer (0.5% Sarkosyl, 50 mM Tris, pH 8, 1 mM EDTA, 1 mM DTT). Urea was added to the sample to a final concentration of 2 M. The sample was incubated at room temperature for 1 hour before diluting the urea concentration to 0.8 M. The sample was then subjected to ultracentrifugation using a SW50.1 rotor at 100,000 × g for 90 min at 16°C. The supernatant was discarded, and the pellet was resuspended in 20 mM HEPES, pH 7.4, 5 mM MgSO4, 1 mM DTT, 1 mM EGTA, 100 mM KCl containing 1× ProteaseArrest protease inhibitors (G-Biosciences). The sample was denatured with SDS-loading buffer and loaded onto a 4%–20% precast polyacrylamide gel (Bio-Rad). The gel was silver stained and the bands between 10 kDa to 40 kDa were cut and sent for mass-spectrometry analysis. Additionally, another gel was run for 3 min and stained with Coomassie blue. The bands containing the whole sample was cut and sent for mass-spectrometry analysis.
Mass-spectrometry analysis
The purified bovine DMTs and tektin samples were sent for mass spectrometry analysis at the Taplin Mass Spectrometry Facility at Harvard Medical School. The bovine DMT was provided in solution, and the tektin samples as bands excised from SDS-PAGE gels. The gel pieces were washed and dehydrated with acetonitrile. After 10 min, the acetonitrile was removed, and the gel pieces dried using a SpeedVac vacuum concentrator (Thermo Fisher Scientific). The gel pieces were then rehydrated with 50 mM ammonium bicarbonate solution containing 12.5 ng/μl trypsin (Promega). After 45 min at 4°C, the trypsin solution was replaced with 50 mM ammonium bicarbonate solution. Samples were then placed at 37°C overnight. Peptides were later extracted by removing the ammonium bicarbonate solution, followed by one wash with a solution containing 50% acetonitrile and 1% formic acid. The extracts were then dried in a SpeedVac (~1 hr) and stored for use at 4°C. On the day of analysis, the samples were reconstituted in 5-10 ~l of solvent A (2.5% acetonitrile, 0.1% formic acid) and loaded onto a pre-equilibrated reverse-phase capillary column (100 ~m inner diameter × ~30 cm length) containing 2.6 μm C18 spherical silica beads using a Famos auto sampler (LC Packings). A gradient was formed, and peptides were eluted with increasing concentrations of solvent B (97.5% acetonitrile, 0.1% formic acid). As peptides eluted they were subjected to electrospray ionization and then entered into an LTQ Orbitrap Velos Pro ion-trap mass spectrometer (Thermo Fisher Scientific). Peptides were detected, isolated, and fragmented to produce a tandem mass spectrum of specific fragment ions for each peptide. Protein identity was determined from the acquired fragmentation pattern using Sequest (Thermo Fisher Scientific). The data were filtered to between a one and two percent peptide false discovery rate. DMTs in solution were treated similarly but were desalted after digestion. The results of the analysis are provided in Table S1 . Negative-stain electron microscopy A 4 μL aliquot of bovine DMT sample at an A280 reading of ~2 was applied onto a glow discharged continuous carbon grid (Electron Microscopy Sciences). After one minute of adsorption, the grid was blotted with filter paper to remove the excess sample, immediately washed twice with 4 μL of 1.5% uranyl formate solution and incubated with 4 μL of 1.5% uranyl formate solution for an additional one minute. The grid was then further blotted with filter paper to remove the uranyl formate solution, air-dried at room temperature, and examined with CM10 electron microscope (Phillips) or Tecnai T12 electron microscope (Thermo Fisher Scientific). The CM10 is operated at 100 kV acceleration voltage with a tungsten filament and is equipped with a Gatan UltraScan 894 (2k × 2k) CCD camera. The T12 is operated at 120 kV acceleration voltage with an LaB6 filament and is equipped with a Gatan UltraScan 895 (4k × 4k) CCD.
Cryo-EM data collection
For cryo-EM analysis, 3 μL of bovine DMT sample with an absorbance reading at 280 nm of ~10 was applied onto glow discharged C-flat holy carbon grids (R1.2/1.3, 400 mesh copper, Electron Microscopy Sciences) or Quantifoil holy carbon grids (R1.2/1.3, 400 mesh gold, or R2/2, 400 mesh copper, Quantifoil Micro Tools). The grids were blotted for 9 to 11 s with a blot force of 16 in 100% humility before being plunged into liquid ethane cooled by liquid nitrogen by using a Vitrobot Mark IV (Thermo Fisher Scientific) at the Harvard Cryo-EM Center for Structural Biology. The grids were screened for good ice conditions with a Tecnai F20 microscope (Thermo Fisher Scientific) operating at 200 kV acceleration voltage with a FEG electron source and equipped with a K2 Summit direct electron detector (Gatan). Images were acquired on Titan Krios I at the Harvard Cryo-EM Center for Structural Biology equipped with a BioQuantum K3 Imaging Filter (slit width 25 eV) and a K3 direct electron detector (Gatan) and operating at an acceleration voltage of 300 kV. Images were recorded at a defocus range of −1 μm to −2.5 μm with a nominal magnification of 81,000×, resulting in a pixel size of 1.09 A. Each image was dose-fractionated into 47 movie frames with a total exposure time of 2.8 s, resulting in a total dose of ~60 electrons per A 2 . SerialEM was used for data collection ( Schorb et al., 2019 ). The images were acquired from five independent data collection sessions.
Image processing
All image processing was performed using RELION 3.1 ( Zivanov et al., 2018 ) unless otherwise stated. A total of 33,755 movie stacks were motion corrected and electron-dose weighted using MotionCor2 ( Zheng et al., 2017 ). A representative micrograph is provided in Figure S1A . Parameters of the contrast transfer function (CTF) were estimated from the motion-corrected micrographs using CTFFIND4 ( Rohou and Grigorieff, 2015 ). 14,726 micrographs were selected for further processing based on visual inspection of the micrographs and their corresponding power spectra. Micrographs that lacked microtubules or had high drift were excluded. To pick particles, start and end points for the DMTs were manually selected. Both straight and curved microtubules were picked. Helical segmented particles were extracted with a helical rise of 8.2 nm and the number of asymmetrical units set to one. Particles were extracted in 672-pixel boxes and downscaled to 336-pixel boxes to accelerate computation. A round of two-dimensional classification served to verify data quality ( Figure S1A ). No particles were excluded at this stage. In total, 1,267,170 particles were extracted and subjected to three-dimensional (3D) refinement using the map of the Chlamydomonas DMT (EMDB: EMD-20631) ( Ma et al., 2019 ) low-pass filtered to 15 Å as a reference. After refinement, the 8-nm particles were subjected to 3D classification to exclude particles of singlet microtubules and broken DMTs. 697,059 particles were retained and re-extracted without downscaling in 672-pixel boxes. These particles were subjected to 3D refinement, CTF refinement, Bayesian polishing, and another round of refinement. This particle set was used to determine maps of the 48-nm internal repeat and the external 24-nm repeat of the ODA-DC and ODA as described below. An overview of the processing strategy is provided in Figure S1 with detailed flow diagrams given in Methods S1 .
Determination of a reconstruction of the internal 48-nm repeat
To obtain a reconstruction of the internal 48-nm repeat, we performed two rounds of classification: first to obtain the 16-nm repeat using a cylindric mask focused on the inner junction region of the B tubule and then to obtain the 48-nm repeat using a cylindric mask focused on the seam of the A tubule. This two-step process yielded better results than going directly from the 8-nm to the 48-nm repeat. The final 48-nm map is generated from 80,503 particles. Density for the tektin bundle at the ribbon of the A tubule was less well-defined than other regions, indicating heterogeneity. We therefore performed focused classification using a cylindric mask over the bundle revealing classes corresponding to 0, 4- and 8-tektin filaments. Classes containing 4- or 8-tektin bundles were selected and independently refined. These maps were used to build atomic models of the tektin filaments. To improve local map quality of the 48-nm repeat map, we performed a series of local refinements. First, we used 10 overlapping cylindric masks to divide the DMT into several subregions, each containing 2 or 3 protofilaments. We then used shorter cylindric masks to divide each subregion into three longitudinal sections. Using these methods, the resolution within each mask was improved. Additionally, we noticed that the density for protofilaments B02-B05 was poorly resolved. We therefore combined cylindric masks for subregions 7-9 and performed three-dimensional classification to isolate only those particles with well-defined density. The locally refined maps were used for model building.
Determination of a reconstruction of the external 96-nm repeat
To generate a map of the 96-nm external repeat, we performed a round of classification with a cylindric mask applied to the exterior of protofilaments A02 and A03, which is the binding site for many axonemal complexes which have 96-nm periodicities. The classification separates the two halves of the 96-nm repeat, one with radial spokes 1 and 2 (RS1 and RS2) and the other with RS3 and the nexin-dynein regulatory complex (N-DRC). Fitting our atomic model of the 48-nm repeat into both halves of the 96-nm repeat confirms the periodicity of the interior of the bovine DMT as 48 nm.
Determination of a reconstruction of the external 24-nm repeat
To generate a map of the 24-nm external repeat, we used a cylindric mask to classify density apparent on protofilaments A07-A08 of the 8-nm repeat map, corresponding to the ODA-DC. Classification identified all three different possible registers of the ODA-DC. We selected each class that showed good density for the ODA-DC and reboxed them with a smaller box size of 288 pixels to focus on the ODA-DC and shifted the density to the center of the box. We combined the particles and excluded duplicates, yielding 192,946 ODA-DC particles. We then performed three-dimensional classification on the DMT and the ODA-DC to further clean up the particles, generating 63,865 particles with well-resolved ODA-DC density. The particles were subjected to multi-body refinement leading to a 3.6 Å resolution map of the ODA-DC-bound microtubule and a 4.5 Å resolution map of the distal ODA-DC. The 24-nm map was also used as a starting point to improve the 48-nm map of the luminal region beneath the ODA-DC. This region includes MIPs CFAP53, MNS1, Pierce1 and Pierce2. The 24-nm map was classified into four classes using a shaped mask that covered these MIPs. This identified two major classes: one centered on Pierce1 and one centered on Pierce2. Refinement of these two classes resulted in maps at 3.9 Å and 4.0 Å resolution, respectively. These maps were a qualitative improvement on maps generated starting from the 48-nm particles ( Methods S1 ).
Determination of a reconstruction of the mammalian ODA
Particles with ODAs were identified using a strategy starting with the 48-nm repeat. Within the repeat, 1 copy and 2 partial copies of the ODA-DC were present. We reboxed each of these using a box size of 488 pixels and shifted them to a common center. After excluding duplicates, the particles were refined and reclassified to identify those with bound ODAs, followed by additional rounds of classification, refinement, and Bayesian polishing. Multi-body refinement of the remaining 8,755 particles was used to improve the map quality of the ODA. Refinement of the core of the ODA (excluding the motor domains but including the tail domains of the heavy chains and their associated light and intermediate chains) resulted in a 8 Å reconstruction. The Fourier shell correlation (FSC) = 0.143 criterion ( Rosenthal and Henderson, 2003 ) was used to calculate resolutions from independent half maps. Maps were postprocessed using phenix.auto_sharpen ( Terwilliger et al., 2018 ) for visualization and deposition. DeepEMhancer, a neural network-based postprocessing approach, was used to sharpen the maps to guide model building ( Sánchez-García et al., 2020 ).
Generation of composite maps
To generate a composite map for model building, refinement and deposition, locally refined maps were aligned using the fit in map command in Chimera ( Pettersen et al., 2004 ) by maximizing the overlapped density and merged using the vop maximum command in Chimera. The individual maps that form the composite map of the bovine DMT are shown in Methods S1 . The half maps of the corresponding local refined fragments were also merged and used for overall FSC calculation ( Figure S1B ) and local resolution estimation in RELION 3.1 ( Figure S1D ). Model building Model building was performed in Coot v0.9-pre or v0.9.4.1 ( Brown et al., 2015 ). Interpretation of the bovine DMT map started with fitting of the atomic model of the Chlamydomonas DMT (PDB 6U42) ( Ma et al., 2019 ). α- and β-tubulin isoforms were distinguished based on sidechain density. The most abundant isoforms identified by mass spectrometry (three for α-tubulin, TUBA1D, TUBA1B, and TUBA4A, and six for β-tubulin, TUBB1, TUBB2B, TUBB3, TUBB4B, TUBB5, and TUBB6) were aligned and the sidechain density inspected where the residues showed greatest variability. Particular attention was paid to locations where different isoform sidechains could be easily differentiated. For example, the density for β-tubulin at position 57 is most consistent with the glycine residue of TUBB4B rather than the bulkier sidechains of TUBB1, TUBB2B, TUBB3 and TUBB6 (lysine, asparagine, histidine and glutamine, respectively). Using this information, the α-tubulin isoform was assigned to TUBA1D based on sidechains of I16, G57, G59, H61,T334 and the β-tubulin isoform was assigned to TUBB4B based on sidechains of H37, N48, G57, V170, A365. These isoforms are consistent with single-cell RNA-sequencing showing their upregulation in ciliated airway cells compared with non-ciliated neighboring cells ( Hawkins et al., 2021 ). However, we cannot exclude the possibility that other tubulin isoforms are incorporated into DMTs as minority species. Chlamydomonas MIPs clearly lacking density in the bovine DMT were deleted from the atomic model. These were FAP34 (RIB30), FAP68, FAP85, FAP90, FAP112, FAP115, FAP129, FAP166, FAP22, FAP252, FAP273, FAP306 (RIB21), and FAP363. The remaining 22 MIPs were considered to have Bos taurus orthologs. We used the sequences of the Chlamydomonas MIPs to identify bovine orthologs from UniProt ( UniProt Consortium, 2021 ) or the NCBI protein database ( Sayers et al., 2021 ). The atomic models of the Chlamydomonas MIPs were mutated to match the sequence of the bovine proteins and loops and extensions were rebuilt. Sidechain density was used to distinguish between paralogs and isoforms. Additional paralogs were identified for FAP182 (Pierce1 and Pierce2) and RIB72 (EFHC1 and EFHC2). We also identified an additional copy of CFAP161. MIPs present in the bovine DMT but absent from Chlamydomonas (Tektins 1-4, TEKTIP1 (C19orf71), FAM166B and EFCAB6) were identified by de novo sequence assignment. Homology models of EFCAB6 were generated using SWISS-MODEL ( Waterhouse et al., 2018 ) and TrRosetta ( Yang et al., 2020 ) and were used to guide model building. Candidates for the additional MIPs were obtained from mass spectrometry analysis of the bovine DMT and extracted tektin samples (both Table S1 ) and the published proteome of human airway cilia ( Blackburn et al., 2017 ). ARMC4, CCDC114, CCDC151, and TTC25 were identified as components of the ODA-DC based on prior knowledge ( Hjeij et al., 2013 ; 2014 ; Onoufriadis et al., 2013 ; Wallmeier et al., 2016 ) and sidechain density. The fifth component of the ODA-DC, Calaxin (EFCAB1), was identified by fold recognition using the MOLREP-BALBES pipeline ( Brown et al., 2015 ). This pipeline identified a domain of two EF-hands (PDB 2OBH) as being the best fit with a contrast score of 4.2. We then searched our list of candidates from mass spectrometry ( Table S1 ) for proteins with EF-hand motifs. Calaxin was the most likely solution given the colocalization of Ciona calaxin with ODAs ( Mizuno et al., 2009 ). A homology model of bovine Calaxin was built using SWISS-MODEL and docked as a rigid body into the density using Coot. Following guidance from the HGNC, the five subunits of the mammalian ODA-DC are renamed outer dynein arm docking complex subunits ODAD1-5 ( Methods S1 ). The double-headed axonemal dynein of the ODA was interpreted by fitting the atomic model of the Chlamydomonas triple-headed axonemal dynein into the density (PDB 7KZM) ( Walton et al., 2021 ) and deleting additional subunits not found in Bos taurus (α-HC and LC4).
Model refinement
Atomic models of individual subunits were refined during model building using real-space refinement in Coot with torsion, planar peptide, trans peptide and Ramachandran restraints applied ( Brown et al., 2015 ). After model building, the subunits were combined into a single PDB file. The atomic model was then refined into the composite map using Phenix.real_space_refine v1.18.2-3874 ( Afonine et al., 2018 ). Secondary structure, Ramachandran and rotamer restraints were applied during refinement. Rotamer restraints target was set to fix outliers and weighting of nonbonded restraints was set 1000. A round of manual model correction in Coot was performed between rounds of real-space refinement in Phenix. The final refinement was performed for three macro cycles with strategies of minimization_global and local_grid_search. The quality of the refined model was analyzed by MolProbity integrated in Phenix ( Chen et al., 2010 ), with statistics reported in Table S2 . Structure analysis and bioinformatics A curated list of 439 tektin protein sequences was obtained from a previous phylogenetic study ( Bastin and Schneider, 2019 ). This list includes sequences from 111 species representing 24 metazoan phyla and Cryptophyta, Chlorophyta and Choanoflagellata. Of the 439 sequences, 249 were identified that aligned with the bovine Tektin 1 L2 loop upon protein basic local alignment search tool (BLAST) with an E-value threshold of 0.0001 and with a single well-defined L2 loop. The sequences were shifted to align their L2 loops with that of the longest tektin ( Clonorchis sinensis Tektin 1). Each residue’s predicted secondary structure was plotted ( Figure S3B ). Secondary structure predictions were performed using PSIPRED ( Jones, 1999 ). Evolutionary coupling (EC) analysis was performed using the EV-couplings V2 server ( Hopf et al., 2019 ; Figure S3C ). Sequences homologous to bovine Tektin 1 (UniProt ID Q32KZ9 ) were obtained using a search of the Uniprot90 database ( UniProt Consortium, 2021 ). Intramolecular contacts for Tektin 1 were determined using CMView ( Vehlow et al., 2011 ) with an 8 Å distance cutoff. Intermolecular contacts were determined using CONTACT from the CCP4 suite ( Winn et al., 2011 ) with a 7 Å distance cutoff. End-point PCR RNA was isolated from zebrafish embryos with Trizol (Ambion Life Technologies, # 15596018). Reverse transcription (RT) PCR was carried out using one-step RT-PCR kit (QIAGEN, #210212). 500 ng of total RNA from each experimental group was used to synthesize the first strand cDNA. End-point PCRs on the zebrafish pierce1 and actin-b1 genes were performed on the cDNA templates. The PCR products were resolved on agarose gels and imaged using a gel imaging system (Bio-Rad). All primers are listed in Table S4 . CRISPR single guide RNA (sgRNA) design and synthesis sgRNAs for the pierce1 and pierce2 genes were designed using the web tool CHOPCHOP ( Montague et al., 2014 ). Target sites for the sgRNA were designed by seeking sequences corresponding to sequence GGN 18 NGG in the DNA. BLAST was used to identify off-target sites of the sgRNAs. sgRNAs with off-target sequences with no mismatches in the last 15 nt including the NGG PAM were discarded. The sgRNA templates were synthesized with Phusion High-Fidelity DNA polymerase (NEB, M0530S). Two primers were used: one forward primer with the T7 polymerase promoter and gene target sequence, and one reverse primer containing the remaining gRNA sequence. The sgRNAs were transcribed from the templates using the MEGAshortscript T7 Transcription Kit (Ambion, AM1354).
Cas9 and sgRNAs microinjection
A mixture of 800 ng of the Cas9 protein (Toolgen, Cat #TGEN_CP1) and 500 ng of sgRNA were incubated at 37°C for 15 min. 1 nL of this mixture was injected into the animal pole of one-cell stage embryos. PCR analysis to identify mutants Genomic DNA was extracted from embryos and fins from adult fish using the alkaline lysis method of 50 mM NaOH incubated at 95°C for 30 minutes, followed by neutralization with 40 mM Tris-HCl ( Wilkinson et al., 2013 ). For embryonic genomic DNA extraction, 8-10 single embryos at 2 days old were used. To identify the mutations, primers were designed to bind upstream and downstream of the expected double-stranded breaks in the targeted exon. The PCR-amplified genomic DNA region from the mutants and WTs were cloned into a pCR II-TOPO vector and sequenced to confirm the mutation ( Figure S5 ). Morphological phenotype analysis of zebrafish embryos Phenotypes were scored in live WT, pierce1, pierce2 and the double knockout mutant embryos using a stereomicroscope. Phenotypes were analyzed in embryos at different stages. Otolith counts were performed at 20–22 hpf. Curved body axis and hydrocephaly were determined at 48 and 72 hpf. Kidney cysts and edema were scored at 4–5 days post fertilization (dpf). For left–right asymmetry, immunofluorescence microscopy was carried out at 36 hpf with anti-A4.1025 antibody (Developmental Studies Hybridoma Bank) to visualize heart jogging. Heart jogging was classified as left, right, or bilateral. To evaluate significance, we used the Fisher’s Exact Test (2 × 2 matrix, two-tailed).
Whole-mount in situ hybridization
(WISH) of zebrafish embryos RNA in situ hybridization was carried out according to standard protocol ( Thisse and Thisse, 2008 ). Briefly, zebrafish embryos were fixed overnight in 4% paraformaldehyde at 4°C. Digoxigenin-UTP-labeled antisense probes for spaw and lefty2 genes were used. Alkaline phosphatase-coupled anti-digoxigenin antibodies (Roche, #11093274910) were used to detect hybridized probes. NBT/BCIP solution (Roche, #11681460001) was used to visualize the signal under a stereomicroscope.
Immunofluorescence microscopy of zebrafish embryos
Zebrafish embryos were fixed in Dent’s fix (80% methanol, 20% DMSO), for at least 3 hr at room temperature or with fish fixative overnight at 4°C. Fixed embryos were stored in methanol at −20°C. Embryos were washed in a decreasing methanol:PBS gradient, followed by a PBS wash and blocking in PBDT (1% (w/v) BSA, 1% DMSO, 0.5% Triton X-100, PBS base) for 1 hr. Primary antibodies were added to PBDT and incubated with the embryos at 4°C overnight. Embryos were then washed in PBDT before incubating with fluorophore-conjugated secondary antibodies and DAPI (4′,6-diamidino-2-phenylindole; Invitrogen #D1306) for 3 hr at room temperature. The embryos were then stored in 70% glycerol, mounted, and imaged using an Olympus Fluoview Upright Confocal Microscope. Image acquisition and analysis was carried out using Olympus Fluoview FV10-ASW software. The primary antibodies used were: mouse anti-myosin heavy chain A4.1025 (Developmental Studies Hybridoma Bank, 1:20), rabbit anti-acetylated tubulin (Cell Signaling Technology #5335) and mouse anti-γ-tubulin GTU-88 (Sigma #T6557) (both 1:500). DAPI was used to label cell nuclei. High-speed video microscopy of zebrafish cilia To record cilia motility, zebrafish embryos were embedded in 2% agarose (with 0.0175% Tricaine for 24 hpf embryos) on 50 mm glass-bottom dishes. Ciliary motility was viewed with a 63X water-dipping objective on an upright Zeiss Axioplan2 microscope equipped with a Hamamatsu ORCA-Flash4.0 V2 C11440-22CU camera. Processing of videos was performed with ImageJ 1.44d ( Schneider et al., 2012 ).
Transmission electron microscopy
(TEM) of KV cilia Zebrafish embryos at 10 somites stage (~14 hpf) were fixed with a standard TEM fixative solution of 2.5% glutaraldehyde and 4% paraformaldehyde in 0.1 M HEPES at 4°C overnight. Samples were washed with HEPES buffer and post fixed in 1% osmium tetroxide in 0.1 M HEPES for 2 hr. After post fixation, samples were rinsed with 0.1 M HEPES three times and treated with 1% tannic acid in 0.1 M HEPES buffer for 1 hr. Consecutively, samples were washed thoroughly with water three times. Samples were treated with series of ethanol solutions (50%, 75% ethanol) for ten minutes. Embryos were processed for enblock staining with 1% uranyl acetate in 75% ethanol for 1 hr on ice. After enblock staining, samples were processed for dehydration in a series of ethanol solutions (85%, 90%, 95%) on ice. The final dehydration procedure was done at room temperature using 100% ethanol twice for 15 minutes. Dehydration was continued with propylene oxide for 15 minutes two times. Subsequently, infiltration was done using propylene oxide and epon resin mixture. Later 100% epon was used for overnight infiltration. Embryos were changed into 100% fresh epon resin two times before embedding. Samples were embedded in 100% resin and polymerized at 64°C. Ultrathin sections, with thickness of 60 nm, were collected, stained with lead citrate solution, and imaged with a JEOL Flash-1400 microscope.
Mouse genotyping
All mice were genotyped at 3 weeks of age by collection of ~1 mm diameter ear clips. DNA was extracted by adding 20 μg Proteinase K, 50 mM Tris pH 8.0, 0.5% Tween, 1 mM EDTA and H 2 O to a total volume of 35 ml, followed by incubation at 55°C for 1 hour (for proteinase activity) and 95°C for 5 mins (to inactivate the enzyme). 50 ng of extracted DNA was used in downstream genotyping assays. Allele counts were determined via quantitative reverse transcription PCR (RT-qPCR). Embryos were genotyped by collection of either the yolk sac during dissection, or a tail segment after analysis and alleles were determined via PCR and amplicon visualization on agarose gels. Quantitative reverse transcription PCR (RT-qPCR) Adult mouse tissue was collected, and total RNA extracted (QIAGEN RNeasy mini kit, #74104). cDNA was synthesized using an Applied Biosystems High-Capacity cDNA Reverse Transcription Kit (Thermo Fisher Scientific, #4368814). Primers were designed to be specific to the gene of interest and their amplification efficiency was checked using testis cDNA. Only primers that produced a single amplicon were used for analysis. All RT-qPCR experiments used Agilent Technologies qPCR Brilliant IISYBR Master Mix (Cat #600828) and experiments were performed on an Applied Biosystems 7500 Fast Real-Time PCR machine. Gene expression was assessed using 50 ng of cDNA in technical triplicates and 5 biological replicates, with Gapdh used at the reference gene for normalization.
Antibody Generation Recombinant 6xHis-tagged mouse
PIERCE1 protein was expressed in BL21(DE3)pLysS competent cells (Novagen) and purified by Ni-NTA affinity chromatography. Purified protein was injected into New Zealand White rabbits (by Covalab, France); antibodies were purified from rabbit sera by affinity purification using PIERCE1 recombinant protein bound to SulfoLink resin (Thermo Fisher Scientific, Cat #20401).
Western Blot Analysis
Whole cell lysates from mouse testes were extracted with SDS lysis buffer, containing protease inhibitor cocktail, on ice by homogenization. The homogenates were incubated on ice for 30 min, and cell debris was pelleted by centrifugation at 13,000 rpm, at 4°C for 10 min. Supernatant samples were resolved on 12% SDS-PAGE gels and transferred onto polyvinylidene fluoride (PVDF) membrane (Pall Corporation). Following transfer, membranes were blocked with 5% non-fat milk dissolved in 1X Tris Buffered Saline-Tween (TBS-TWEEN) for 1 hr at room temperature. Primary antibody (rabbit anti-Pierce1, polyclonal, 1:200), diluted in the same blocking solution, was added to the membrane, and incubated overnight at 4°C. The membrane was washed 3 times with TBS-TWEEN at 10 min intervals. Secondary antibody (polyclonal goat anti-rabbit conjugated with horseradish peroxidase (HRP), Agilent Cat #P0448), diluted (1:2000) in blocking solution, was added to the membrane and incubated for 1 hr at room temperature, followed by three TBS-TWEEN washes at 10 min intervals. Enhanced chemiluminescent (ECL) substrate (Geneflow) was used to detect the signal from the HRP-conjugated secondary antibody.
Mouse embryo phenotyping
Embryos were dissected in phosphate buffered saline (PBS) under a light microscope. The head was removed, and the thoracic cavity opened. For phenotyping, embryos were scored according to lung lobation, heart apex position, heart outflow tract patterning and stomach position. Any other gross abnormalities were also noted. All imaging was performed in PBS using a Teledyne Lumenera Infinity3-6URC camera on a Leica MZ12.5 microscope. Tail clips were taken after imaging for genotyping purposes.
LacZ embryo staining
Embryos were harvested in PBS at the desired developmental time point and fixed in 1% formaldehyde, 0.2% glutaraldehyde, 2 mM MgCl 2 , 5 mM EGTA and 0.02% NP-40 in PBS overnight. Samples were washed 3× with 0.02% NP-40 in PBS and stained for 18 hours at 37°C with 0.5 mg/ml X-gal, 10 mM K 3 Fe(CN) 6 , 10 mM K 4 Fe(CN) 6 , 2 mM MgCl 2 , 0.01% sodium deoxycholate and 0.02% NP-40 in PBS. Stained embryos were imaged in PBS using a Leica DFC420 camera on a Leica MZ16F microscope. Whole embryos were taken after imaging for genotyping purposes.
Nodal cilia analysis
Embryos from Pierce1 +/− × Pierce1 +/− or Pierce2 +/− × Pierce2 +/− crosses were harvested at E8.0 and dissected in pre-warmed DMEM (GIBCO, #10569010) supplemented with 10% FBS (GIBCO, #10500064). To visualize nodal cilia rotation, embryos were mounted on slides in the medium with the node facing up. Differential interference contrast (DIC) video capture was performed at 100 frames per second at 100X magnification using a Leica DM2500 compound microscope equipped with a monochrome high-speed Hamamatsu C9300 camera. Nodal cilia rotation was quantified by counting the number of frames per 5 complete rotations for a minimum of 5 cilia per embryo. Cilia movement type was also determined from the same videos. Embryos were taken for genotyping after imaging. Particle image velocimetry (PIV) of nodal cilia Embryos from Pierce1 +/− × Pierce1 +/− intercrosses were harvested at E8.0 in pre-warmed DMEM with 10% FBS. 0.2 μm diameter FluoSpheres (Thermo Fisher Scientific, #F8848) were diluted 1:10 with the same DMEM with 10% FBS medium and then placed over embryos mounted on pre-warmed (37°C) glass microscope slides. Videos were captured using a Zeiss EC Plan-Neofluar 40×/0.75 lens and an AxioCam HRm camera with a VivaTome attachment, on a Zeiss Observer.Z1 microscope. Data points were binarized and dilated using ImageJ ( Schneider et al., 2012 ), before particle image velocimetry analysis using PIVLab plugin in MATLAB ( Thielicke and Stamhuis, 2014 ) to track the movement of each fluorescent bead frame-to-frame. Embryos at 2-3 somite stages were used for this analysis.
Whole mount in situ hybridization
(WISH) of mouse nodal genes Anti-sense WISH probes for Pierce1 and Pierce2 were generated against DNA sequences corresponding to Pierce1 16-768 nt ( NM_027040.1 ) and Pierce2 98-550 nt ( NM_001198789.1 ). PCR-generated sequences were ligated into the pBluescript II KS(−) vector linearized with EcoRV. The identity of the cloned sequence was confirmed by DNA sequencing (Source BioScience) primed using the T3 and T7 promoter sequences. Digoxygenin-labeled anti-sense riboprobes for Cerl2 ( Marques et al., 2004 ), Pitx2 ( Ryan et al., 1998 ), Pierce1 , and Pierce2 were transcribed from either the T3 or T7 promoter. WISH experiments were performed as described ( Field et al., 2011 ) using anti-Digoxigenin antibody (Roche, #11093274910) and NBT/BCIP staining (Roche, #11681460001). Stained embryos were imaged in PBS using a Leica DFC420 camera on a Leica MZ16F microscope. Whole embryos were taken after imaging for genotyping. High-speed video microscopy of tracheal motile cilia Tracheas from 10–12-week-old mice were harvested, excess tissue removed, then cut into rings approximately the width of one cartilage ridge. Samples were incubated at 37°C, 5% CO 2 overnight in MEM (GIBCO, #11544456) medium with 1% penicillin-streptomycin (GIBCO, #11528876) and 0.2% nystatin (GIBCO, #11548886). Rings were allowed to settle for 20 mins on the stage of an inverted Olympus IX71 microscope in an environmental chamber at 37°C, prior to video capture. High-speed video recordings were taken at 500 frames per second, 60X magnification objective (Olympus LUCPlan FLN) using a Photron MC 2.1 FastCam camera. Average ciliary beat frequency (CBF) was measured by fast Fourier transform analysis using a CBF panel FFT V2.700 ImageJ plugin. Ciliary beat pattern (CBP, stiffness), amplitude and synchronization were independently assessed by 3 expert reviewers who were blind to sample genotypes, viewing videos at 30 frames per second. Videos containing debris or non-ciliated cells were excluded from the analysis. TEM of mouse tracheal cilia Tracheas were harvested as detailed above. Rings were fixed in 3% glutaraldehyde, 0.1 M cacodylate buffer (overnight), post-fixed in 2% osmium tetroxide in 0.1 M cacodylate buffer (2 hours), dehydrated in ethanol and embedded in Spurr’s resin ( Spurr, 1969 ) following an established protocol. Ultra-thin sections (100 nm) were cut (Leica EM UC7 ultramicrotome) and stained with lead citrate, then imaged using a Hitachi HT7700 transmission electron microscope. Ultrastructural defects were scored by examination of 300+ ciliary cross-sections per sample by an expert electron microscopist. Acilium was tagged as defective for axonemal dyneins if fewer than 7 ODAs or 5 IDAs were observed. Figures Figure panels depicting cryo-EM maps or atomic models were generated using Chimera ( Pettersen et al., 2004 ) or ChimeraX ( Pettersen et al., 2021 ). Maps colored by local resolution were generated using RELION 3.1 ( Zivanov et al., 2018 ). Structural biology software were installed and configured by SBGrid ( Morin et al., 2013 ).
QUANTIFICATION AND STATISTICAL ANALYSIS
Resolution estimations of cryo-EM density maps are based on the 0.143 FSC criterion ( Rosenthal and Henderson, 2003 ). All statistical validation performed on the deposited model (PDB: 7RRO) was done using the PHENIX package ( Table S2 ). Statistical analysis in Figure 4E was performed with Microsoft Excel (Microsoft Corporation). Statistical analyses in Figures 6 and 7 and S6 were performed with GraphPad Prism v9 (GraphPad Software). Further details can be found in the corresponding figure legends.
Materials availability
Zebrafish lines generated by the authors will be distributed without restriction upon request. The mouse 1700007K13Rik tm2b(EUCOMM)Wtsi and Ccpg1os em1(IMPC)H alleles are available through the International Mouse Phenotyping Consortium (IMPC; https://www.mousephenotype.org/ ). Plasmids generated in this study will be distributed without restriction on request.
EXPERIMENTAL MODEL AND SUBJECT DETAILS Bacterial strains Escherichia coli
DH5α cells (Thermo Fisher Scientific and New England Biolabs) were used for the propagation of all vectors and plasmids. Bacterial colonies were cultured on LB agar plates or in liquid LB medium supplemented with the appropriate antibiotic for selection at a concentration of 100 μg/ml. LB agar plates and liquid cultures were incubated for 14-16 hours at 37°C prior to isolation of vector or plasmid DNA. Transformations were carried out following an established standard protocol. Zebrafish husbandry, strains, and mutagenesis Zebrafish strains used in this study were maintained at the Institute of Molecular and Cell Biology (IMCB, Singapore) zebrafish facility following routine husbandry procedure. The facility has a controlled temperature of 28.5°C and operates a 14-hr light and 10-hr dark light cycle. All experiments with the zebrafish were conducted with approval of the Singapore National Advisory Committee on Laboratory Animal Research. The zebrafish strains used in the study are listed in the Key resources table . All experiments were carried out on zebrafish embryos and larvae between 10 somites and 72 hpf stages. There was no sex bias and paired matings were set up using adult zebrafish between 4 and 8 months of age. Mouse husbandry, stains, and mutagenesis Ethical approval for all mouse work was obtained from the UK Home Office and experiments were carried out in accordance with the Medical Research Council (MRC) Harwell Ethics Committee. All mouse colonies were maintained in a pathogen-free environment at the Mary Lyon Centre, MRC Harwell Institute on a C57BL/6N background strain. The 1700007K13Rik tm2b(EUCOMM)Wtsi allele ( Pierce1 tm2b) was created at the Wellcome Sanger Institute as part of the European Conditional Mouse Mutagenesis Program (EUCOMM). The Ccpg1os em1(IMPC)H allele ( Pierce2 DEL ) was created at the Mary Lyon Centre as part of the International Mouse Phenotyping Consortium (IMPC). Mice were housed in groups of 2-5 with controlled temperature (21 ± 2°C) and humidity (55 ± 10%) in a 12-hour light/dark cycle. Mice had free access to water and were fed ad libitum on a commercial diet (Special Diet Services, UK). Mice were sacrificed either by cervical dislocation or overdose of anesthetic. The mouse embryos analyzed were a random mixture of males and females; their sex was not determined. Adult mouse cohorts included equal numbers of males and females; no sex-based phenotypic differences were detected.
METHOD DETAILS Isolation of bovine tracheal cilia The protocol for isolating bovine tracheal cilia was modified from ( Anderson and Hein, 1976 ; Hastie, 1995 ; Hastie et al., 1986 ). Fresh bovine tracheae were collected from Adam’s Farm (Athol, MA) and stored in PBS (137 mM NaCl, 2.7 mM KCl, 10 mM Na 2 HPO 4 , 1.8 mM KH 2 PO4, pH 7.4) on ice for the drive back to the lab (approximately 90 min). The following extraction and purification steps were carried out at 4°C. The tracheae were washed with PBS and excess tissue was removed. A nylon brush was carefully inserted into the trachea to brush the epithelium lightly. The brush was washed with about 100 mL extraction buffer (20 mM Tris, pH 7.4, 50 mM NaCl, 1 mM Ethylenediaminetetraacetic acid (EDTA), 7 mM β-mercaptoethanol, 10 mM CaCl 2 , 250 mM sucrose, 0.1% 3-[(3-Cholamidopropyl) dimethylammonio]-1-propanesulfonate (CHAPS) (w/v)), which was subsequently filled into the trachea. Both ends of the flesh tube were sealed by parafilm and rubber bands, and the trachea filled with extraction buffer was shaken vigorously for about 2 min. The buffer was collected, and the trachea was rinsed with another 100 mL extraction buffer without CHAPS. The combined buffer samples (final concentration of CHAPS: 0.05%) were passed through a sieve to separate any residual tissue. The flow through was filled into 1 L centrifugation tubes and centrifuged at 2,000 × g for 2 min. The supernatant was carefully transferred to 175 mL conical centrifugation tubes and centrifuged at 12,000 × g for 30 min. The cilia containing pellet was resuspended in RB buffer (30 mM HEPES, pH 7.4, 5 mM MgCl 2 , 1 mM 1,4-dithiothreitol (DTT), 0.5 mM EDTA, 50 mM KCl, protease inhibitor (Roche)). Several rounds of low speed (2,000 × g) and high speed (13,300 × g) centrifugation were performed to clean up the cilia. The final cilia pellet was resuspended in RB buffer. The sample was analyzed by negative-stain electron microscopy for cilia concentration, integrity, and purity. The sample was flash-frozen in liquid nitrogen and stored at −80°C.
Preparation of bovine DMTs
The purified cilia were demembranized by adding NP-40 detergent (Thermo Fisher Scientific) to a final concentration of 0.5% and incubated at 4°C for 30 min. The sample was centrifuged at 12,000 × g for 20 min. The supernatant was removed and the pellet was resuspended in RB buffer to an A280 concentration of 0.5-2.1 mM ATP was added to the sample and incubated at room temperature for 20 min. If any pellet remained after incubation, ATP up to a concentration of 2.5 mM was added and the sample was incubated again at room temperature for another 10-20 min. After incubation, the sample was centrifuged at 6,000 × g for 20 min and the pellet was resuspended in RB buffer to an A280 concentration of ~10 for cryo-grid preparation.
Purification of tektin filaments
Tektin filaments were purified following a published protocol ( Pirner and Linck, 1994 ). Briefly, purified cilia were demembranized by adding CHAPS detergent to a final concentration of 2% and incubated at 4°C for 30 min, followed by a centrifugation at 6,000 × g for 10 min. The pellet was resuspended in tektin buffer (0.5% Sarkosyl, 50 mM Tris, pH 8, 1 mM EDTA, 1 mM DTT). Urea was added to the sample to a final concentration of 2 M. The sample was incubated at room temperature for 1 hour before diluting the urea concentration to 0.8 M. The sample was then subjected to ultracentrifugation using a SW50.1 rotor at 100,000 × g for 90 min at 16°C. The supernatant was discarded, and the pellet was resuspended in 20 mM HEPES, pH 7.4, 5 mM MgSO4, 1 mM DTT, 1 mM EGTA, 100 mM KCl containing 1× ProteaseArrest protease inhibitors (G-Biosciences). The sample was denatured with SDS-loading buffer and loaded onto a 4%–20% precast polyacrylamide gel (Bio-Rad). The gel was silver stained and the bands between 10 kDa to 40 kDa were cut and sent for mass-spectrometry analysis. Additionally, another gel was run for 3 min and stained with Coomassie blue. The bands containing the whole sample was cut and sent for mass-spectrometry analysis.
Mass-spectrometry analysis
The purified bovine DMTs and tektin samples were sent for mass spectrometry analysis at the Taplin Mass Spectrometry Facility at Harvard Medical School. The bovine DMT was provided in solution, and the tektin samples as bands excised from SDS-PAGE gels. The gel pieces were washed and dehydrated with acetonitrile. After 10 min, the acetonitrile was removed, and the gel pieces dried using a SpeedVac vacuum concentrator (Thermo Fisher Scientific). The gel pieces were then rehydrated with 50 mM ammonium bicarbonate solution containing 12.5 ng/μl trypsin (Promega). After 45 min at 4°C, the trypsin solution was replaced with 50 mM ammonium bicarbonate solution. Samples were then placed at 37°C overnight. Peptides were later extracted by removing the ammonium bicarbonate solution, followed by one wash with a solution containing 50% acetonitrile and 1% formic acid. The extracts were then dried in a SpeedVac (~1 hr) and stored for use at 4°C. On the day of analysis, the samples were reconstituted in 5-10 ~l of solvent A (2.5% acetonitrile, 0.1% formic acid) and loaded onto a pre-equilibrated reverse-phase capillary column (100 ~m inner diameter × ~30 cm length) containing 2.6 μm C18 spherical silica beads using a Famos auto sampler (LC Packings). A gradient was formed, and peptides were eluted with increasing concentrations of solvent B (97.5% acetonitrile, 0.1% formic acid). As peptides eluted they were subjected to electrospray ionization and then entered into an LTQ Orbitrap Velos Pro ion-trap mass spectrometer (Thermo Fisher Scientific). Peptides were detected, isolated, and fragmented to produce a tandem mass spectrum of specific fragment ions for each peptide. Protein identity was determined from the acquired fragmentation pattern using Sequest (Thermo Fisher Scientific). The data were filtered to between a one and two percent peptide false discovery rate. DMTs in solution were treated similarly but were desalted after digestion. The results of the analysis are provided in Table S1 . Negative-stain electron microscopy A 4 μL aliquot of bovine DMT sample at an A280 reading of ~2 was applied onto a glow discharged continuous carbon grid (Electron Microscopy Sciences). After one minute of adsorption, the grid was blotted with filter paper to remove the excess sample, immediately washed twice with 4 μL of 1.5% uranyl formate solution and incubated with 4 μL of 1.5% uranyl formate solution for an additional one minute. The grid was then further blotted with filter paper to remove the uranyl formate solution, air-dried at room temperature, and examined with CM10 electron microscope (Phillips) or Tecnai T12 electron microscope (Thermo Fisher Scientific). The CM10 is operated at 100 kV acceleration voltage with a tungsten filament and is equipped with a Gatan UltraScan 894 (2k × 2k) CCD camera. The T12 is operated at 120 kV acceleration voltage with an LaB6 filament and is equipped with a Gatan UltraScan 895 (4k × 4k) CCD.
Cryo-EM data collection
For cryo-EM analysis, 3 μL of bovine DMT sample with an absorbance reading at 280 nm of ~10 was applied onto glow discharged C-flat holy carbon grids (R1.2/1.3, 400 mesh copper, Electron Microscopy Sciences) or Quantifoil holy carbon grids (R1.2/1.3, 400 mesh gold, or R2/2, 400 mesh copper, Quantifoil Micro Tools). The grids were blotted for 9 to 11 s with a blot force of 16 in 100% humility before being plunged into liquid ethane cooled by liquid nitrogen by using a Vitrobot Mark IV (Thermo Fisher Scientific) at the Harvard Cryo-EM Center for Structural Biology. The grids were screened for good ice conditions with a Tecnai F20 microscope (Thermo Fisher Scientific) operating at 200 kV acceleration voltage with a FEG electron source and equipped with a K2 Summit direct electron detector (Gatan). Images were acquired on Titan Krios I at the Harvard Cryo-EM Center for Structural Biology equipped with a BioQuantum K3 Imaging Filter (slit width 25 eV) and a K3 direct electron detector (Gatan) and operating at an acceleration voltage of 300 kV. Images were recorded at a defocus range of −1 μm to −2.5 μm with a nominal magnification of 81,000×, resulting in a pixel size of 1.09 A. Each image was dose-fractionated into 47 movie frames with a total exposure time of 2.8 s, resulting in a total dose of ~60 electrons per A 2 . SerialEM was used for data collection ( Schorb et al., 2019 ). The images were acquired from five independent data collection sessions.
Image processing
All image processing was performed using RELION 3.1 ( Zivanov et al., 2018 ) unless otherwise stated. A total of 33,755 movie stacks were motion corrected and electron-dose weighted using MotionCor2 ( Zheng et al., 2017 ). A representative micrograph is provided in Figure S1A . Parameters of the contrast transfer function (CTF) were estimated from the motion-corrected micrographs using CTFFIND4 ( Rohou and Grigorieff, 2015 ). 14,726 micrographs were selected for further processing based on visual inspection of the micrographs and their corresponding power spectra. Micrographs that lacked microtubules or had high drift were excluded. To pick particles, start and end points for the DMTs were manually selected. Both straight and curved microtubules were picked. Helical segmented particles were extracted with a helical rise of 8.2 nm and the number of asymmetrical units set to one. Particles were extracted in 672-pixel boxes and downscaled to 336-pixel boxes to accelerate computation. A round of two-dimensional classification served to verify data quality ( Figure S1A ). No particles were excluded at this stage. In total, 1,267,170 particles were extracted and subjected to three-dimensional (3D) refinement using the map of the Chlamydomonas DMT (EMDB: EMD-20631) ( Ma et al., 2019 ) low-pass filtered to 15 Å as a reference. After refinement, the 8-nm particles were subjected to 3D classification to exclude particles of singlet microtubules and broken DMTs. 697,059 particles were retained and re-extracted without downscaling in 672-pixel boxes. These particles were subjected to 3D refinement, CTF refinement, Bayesian polishing, and another round of refinement. This particle set was used to determine maps of the 48-nm internal repeat and the external 24-nm repeat of the ODA-DC and ODA as described below. An overview of the processing strategy is provided in Figure S1 with detailed flow diagrams given in Methods S1 .
Determination of a reconstruction of the internal 48-nm repeat
To obtain a reconstruction of the internal 48-nm repeat, we performed two rounds of classification: first to obtain the 16-nm repeat using a cylindric mask focused on the inner junction region of the B tubule and then to obtain the 48-nm repeat using a cylindric mask focused on the seam of the A tubule. This two-step process yielded better results than going directly from the 8-nm to the 48-nm repeat. The final 48-nm map is generated from 80,503 particles. Density for the tektin bundle at the ribbon of the A tubule was less well-defined than other regions, indicating heterogeneity. We therefore performed focused classification using a cylindric mask over the bundle revealing classes corresponding to 0, 4- and 8-tektin filaments. Classes containing 4- or 8-tektin bundles were selected and independently refined. These maps were used to build atomic models of the tektin filaments. To improve local map quality of the 48-nm repeat map, we performed a series of local refinements. First, we used 10 overlapping cylindric masks to divide the DMT into several subregions, each containing 2 or 3 protofilaments. We then used shorter cylindric masks to divide each subregion into three longitudinal sections. Using these methods, the resolution within each mask was improved. Additionally, we noticed that the density for protofilaments B02-B05 was poorly resolved. We therefore combined cylindric masks for subregions 7-9 and performed three-dimensional classification to isolate only those particles with well-defined density. The locally refined maps were used for model building.
Determination of a reconstruction of the external 96-nm repeat
To generate a map of the 96-nm external repeat, we performed a round of classification with a cylindric mask applied to the exterior of protofilaments A02 and A03, which is the binding site for many axonemal complexes which have 96-nm periodicities. The classification separates the two halves of the 96-nm repeat, one with radial spokes 1 and 2 (RS1 and RS2) and the other with RS3 and the nexin-dynein regulatory complex (N-DRC). Fitting our atomic model of the 48-nm repeat into both halves of the 96-nm repeat confirms the periodicity of the interior of the bovine DMT as 48 nm.
Determination of a reconstruction of the external 24-nm repeat
To generate a map of the 24-nm external repeat, we used a cylindric mask to classify density apparent on protofilaments A07-A08 of the 8-nm repeat map, corresponding to the ODA-DC. Classification identified all three different possible registers of the ODA-DC. We selected each class that showed good density for the ODA-DC and reboxed them with a smaller box size of 288 pixels to focus on the ODA-DC and shifted the density to the center of the box. We combined the particles and excluded duplicates, yielding 192,946 ODA-DC particles. We then performed three-dimensional classification on the DMT and the ODA-DC to further clean up the particles, generating 63,865 particles with well-resolved ODA-DC density. The particles were subjected to multi-body refinement leading to a 3.6 Å resolution map of the ODA-DC-bound microtubule and a 4.5 Å resolution map of the distal ODA-DC. The 24-nm map was also used as a starting point to improve the 48-nm map of the luminal region beneath the ODA-DC. This region includes MIPs CFAP53, MNS1, Pierce1 and Pierce2. The 24-nm map was classified into four classes using a shaped mask that covered these MIPs. This identified two major classes: one centered on Pierce1 and one centered on Pierce2. Refinement of these two classes resulted in maps at 3.9 Å and 4.0 Å resolution, respectively. These maps were a qualitative improvement on maps generated starting from the 48-nm particles ( Methods S1 ).
Determination of a reconstruction of the mammalian ODA
Particles with ODAs were identified using a strategy starting with the 48-nm repeat. Within the repeat, 1 copy and 2 partial copies of the ODA-DC were present. We reboxed each of these using a box size of 488 pixels and shifted them to a common center. After excluding duplicates, the particles were refined and reclassified to identify those with bound ODAs, followed by additional rounds of classification, refinement, and Bayesian polishing. Multi-body refinement of the remaining 8,755 particles was used to improve the map quality of the ODA. Refinement of the core of the ODA (excluding the motor domains but including the tail domains of the heavy chains and their associated light and intermediate chains) resulted in a 8 Å reconstruction. The Fourier shell correlation (FSC) = 0.143 criterion ( Rosenthal and Henderson, 2003 ) was used to calculate resolutions from independent half maps. Maps were postprocessed using phenix.auto_sharpen ( Terwilliger et al., 2018 ) for visualization and deposition. DeepEMhancer, a neural network-based postprocessing approach, was used to sharpen the maps to guide model building ( Sánchez-García et al., 2020 ).
Generation of composite maps
To generate a composite map for model building, refinement and deposition, locally refined maps were aligned using the fit in map command in Chimera ( Pettersen et al., 2004 ) by maximizing the overlapped density and merged using the vop maximum command in Chimera. The individual maps that form the composite map of the bovine DMT are shown in Methods S1 . The half maps of the corresponding local refined fragments were also merged and used for overall FSC calculation ( Figure S1B ) and local resolution estimation in RELION 3.1 ( Figure S1D ). Model building Model building was performed in Coot v0.9-pre or v0.9.4.1 ( Brown et al., 2015 ). Interpretation of the bovine DMT map started with fitting of the atomic model of the Chlamydomonas DMT (PDB 6U42) ( Ma et al., 2019 ). α- and β-tubulin isoforms were distinguished based on sidechain density. The most abundant isoforms identified by mass spectrometry (three for α-tubulin, TUBA1D, TUBA1B, and TUBA4A, and six for β-tubulin, TUBB1, TUBB2B, TUBB3, TUBB4B, TUBB5, and TUBB6) were aligned and the sidechain density inspected where the residues showed greatest variability. Particular attention was paid to locations where different isoform sidechains could be easily differentiated. For example, the density for β-tubulin at position 57 is most consistent with the glycine residue of TUBB4B rather than the bulkier sidechains of TUBB1, TUBB2B, TUBB3 and TUBB6 (lysine, asparagine, histidine and glutamine, respectively). Using this information, the α-tubulin isoform was assigned to TUBA1D based on sidechains of I16, G57, G59, H61,T334 and the β-tubulin isoform was assigned to TUBB4B based on sidechains of H37, N48, G57, V170, A365. These isoforms are consistent with single-cell RNA-sequencing showing their upregulation in ciliated airway cells compared with non-ciliated neighboring cells ( Hawkins et al., 2021 ). However, we cannot exclude the possibility that other tubulin isoforms are incorporated into DMTs as minority species. Chlamydomonas MIPs clearly lacking density in the bovine DMT were deleted from the atomic model. These were FAP34 (RIB30), FAP68, FAP85, FAP90, FAP112, FAP115, FAP129, FAP166, FAP22, FAP252, FAP273, FAP306 (RIB21), and FAP363. The remaining 22 MIPs were considered to have Bos taurus orthologs. We used the sequences of the Chlamydomonas MIPs to identify bovine orthologs from UniProt ( UniProt Consortium, 2021 ) or the NCBI protein database ( Sayers et al., 2021 ). The atomic models of the Chlamydomonas MIPs were mutated to match the sequence of the bovine proteins and loops and extensions were rebuilt. Sidechain density was used to distinguish between paralogs and isoforms. Additional paralogs were identified for FAP182 (Pierce1 and Pierce2) and RIB72 (EFHC1 and EFHC2). We also identified an additional copy of CFAP161. MIPs present in the bovine DMT but absent from Chlamydomonas (Tektins 1-4, TEKTIP1 (C19orf71), FAM166B and EFCAB6) were identified by de novo sequence assignment. Homology models of EFCAB6 were generated using SWISS-MODEL ( Waterhouse et al., 2018 ) and TrRosetta ( Yang et al., 2020 ) and were used to guide model building. Candidates for the additional MIPs were obtained from mass spectrometry analysis of the bovine DMT and extracted tektin samples (both Table S1 ) and the published proteome of human airway cilia ( Blackburn et al., 2017 ). ARMC4, CCDC114, CCDC151, and TTC25 were identified as components of the ODA-DC based on prior knowledge ( Hjeij et al., 2013 ; 2014 ; Onoufriadis et al., 2013 ; Wallmeier et al., 2016 ) and sidechain density. The fifth component of the ODA-DC, Calaxin (EFCAB1), was identified by fold recognition using the MOLREP-BALBES pipeline ( Brown et al., 2015 ). This pipeline identified a domain of two EF-hands (PDB 2OBH) as being the best fit with a contrast score of 4.2. We then searched our list of candidates from mass spectrometry ( Table S1 ) for proteins with EF-hand motifs. Calaxin was the most likely solution given the colocalization of Ciona calaxin with ODAs ( Mizuno et al., 2009 ). A homology model of bovine Calaxin was built using SWISS-MODEL and docked as a rigid body into the density using Coot. Following guidance from the HGNC, the five subunits of the mammalian ODA-DC are renamed outer dynein arm docking complex subunits ODAD1-5 ( Methods S1 ). The double-headed axonemal dynein of the ODA was interpreted by fitting the atomic model of the Chlamydomonas triple-headed axonemal dynein into the density (PDB 7KZM) ( Walton et al., 2021 ) and deleting additional subunits not found in Bos taurus (α-HC and LC4).
Model refinement
Atomic models of individual subunits were refined during model building using real-space refinement in Coot with torsion, planar peptide, trans peptide and Ramachandran restraints applied ( Brown et al., 2015 ). After model building, the subunits were combined into a single PDB file. The atomic model was then refined into the composite map using Phenix.real_space_refine v1.18.2-3874 ( Afonine et al., 2018 ). Secondary structure, Ramachandran and rotamer restraints were applied during refinement. Rotamer restraints target was set to fix outliers and weighting of nonbonded restraints was set 1000. A round of manual model correction in Coot was performed between rounds of real-space refinement in Phenix. The final refinement was performed for three macro cycles with strategies of minimization_global and local_grid_search. The quality of the refined model was analyzed by MolProbity integrated in Phenix ( Chen et al., 2010 ), with statistics reported in Table S2 . Structure analysis and bioinformatics A curated list of 439 tektin protein sequences was obtained from a previous phylogenetic study ( Bastin and Schneider, 2019 ). This list includes sequences from 111 species representing 24 metazoan phyla and Cryptophyta, Chlorophyta and Choanoflagellata. Of the 439 sequences, 249 were identified that aligned with the bovine Tektin 1 L2 loop upon protein basic local alignment search tool (BLAST) with an E-value threshold of 0.0001 and with a single well-defined L2 loop. The sequences were shifted to align their L2 loops with that of the longest tektin ( Clonorchis sinensis Tektin 1). Each residue’s predicted secondary structure was plotted ( Figure S3B ). Secondary structure predictions were performed using PSIPRED ( Jones, 1999 ). Evolutionary coupling (EC) analysis was performed using the EV-couplings V2 server ( Hopf et al., 2019 ; Figure S3C ). Sequences homologous to bovine Tektin 1 (UniProt ID Q32KZ9 ) were obtained using a search of the Uniprot90 database ( UniProt Consortium, 2021 ). Intramolecular contacts for Tektin 1 were determined using CMView ( Vehlow et al., 2011 ) with an 8 Å distance cutoff. Intermolecular contacts were determined using CONTACT from the CCP4 suite ( Winn et al., 2011 ) with a 7 Å distance cutoff. End-point PCR RNA was isolated from zebrafish embryos with Trizol (Ambion Life Technologies, # 15596018). Reverse transcription (RT) PCR was carried out using one-step RT-PCR kit (QIAGEN, #210212). 500 ng of total RNA from each experimental group was used to synthesize the first strand cDNA. End-point PCRs on the zebrafish pierce1 and actin-b1 genes were performed on the cDNA templates. The PCR products were resolved on agarose gels and imaged using a gel imaging system (Bio-Rad). All primers are listed in Table S4 . CRISPR single guide RNA (sgRNA) design and synthesis sgRNAs for the pierce1 and pierce2 genes were designed using the web tool CHOPCHOP ( Montague et al., 2014 ). Target sites for the sgRNA were designed by seeking sequences corresponding to sequence GGN 18 NGG in the DNA. BLAST was used to identify off-target sites of the sgRNAs. sgRNAs with off-target sequences with no mismatches in the last 15 nt including the NGG PAM were discarded. The sgRNA templates were synthesized with Phusion High-Fidelity DNA polymerase (NEB, M0530S). Two primers were used: one forward primer with the T7 polymerase promoter and gene target sequence, and one reverse primer containing the remaining gRNA sequence. The sgRNAs were transcribed from the templates using the MEGAshortscript T7 Transcription Kit (Ambion, AM1354).
Cas9 and sgRNAs microinjection
A mixture of 800 ng of the Cas9 protein (Toolgen, Cat #TGEN_CP1) and 500 ng of sgRNA were incubated at 37°C for 15 min. 1 nL of this mixture was injected into the animal pole of one-cell stage embryos. PCR analysis to identify mutants Genomic DNA was extracted from embryos and fins from adult fish using the alkaline lysis method of 50 mM NaOH incubated at 95°C for 30 minutes, followed by neutralization with 40 mM Tris-HCl ( Wilkinson et al., 2013 ). For embryonic genomic DNA extraction, 8-10 single embryos at 2 days old were used. To identify the mutations, primers were designed to bind upstream and downstream of the expected double-stranded breaks in the targeted exon. The PCR-amplified genomic DNA region from the mutants and WTs were cloned into a pCR II-TOPO vector and sequenced to confirm the mutation ( Figure S5 ). Morphological phenotype analysis of zebrafish embryos Phenotypes were scored in live WT, pierce1, pierce2 and the double knockout mutant embryos using a stereomicroscope. Phenotypes were analyzed in embryos at different stages. Otolith counts were performed at 20–22 hpf. Curved body axis and hydrocephaly were determined at 48 and 72 hpf. Kidney cysts and edema were scored at 4–5 days post fertilization (dpf). For left–right asymmetry, immunofluorescence microscopy was carried out at 36 hpf with anti-A4.1025 antibody (Developmental Studies Hybridoma Bank) to visualize heart jogging. Heart jogging was classified as left, right, or bilateral. To evaluate significance, we used the Fisher’s Exact Test (2 × 2 matrix, two-tailed).
Whole-mount in situ hybridization
(WISH) of zebrafish embryos RNA in situ hybridization was carried out according to standard protocol ( Thisse and Thisse, 2008 ). Briefly, zebrafish embryos were fixed overnight in 4% paraformaldehyde at 4°C. Digoxigenin-UTP-labeled antisense probes for spaw and lefty2 genes were used. Alkaline phosphatase-coupled anti-digoxigenin antibodies (Roche, #11093274910) were used to detect hybridized probes. NBT/BCIP solution (Roche, #11681460001) was used to visualize the signal under a stereomicroscope.
Immunofluorescence microscopy of zebrafish embryos
Zebrafish embryos were fixed in Dent’s fix (80% methanol, 20% DMSO), for at least 3 hr at room temperature or with fish fixative overnight at 4°C. Fixed embryos were stored in methanol at −20°C. Embryos were washed in a decreasing methanol:PBS gradient, followed by a PBS wash and blocking in PBDT (1% (w/v) BSA, 1% DMSO, 0.5% Triton X-100, PBS base) for 1 hr. Primary antibodies were added to PBDT and incubated with the embryos at 4°C overnight. Embryos were then washed in PBDT before incubating with fluorophore-conjugated secondary antibodies and DAPI (4′,6-diamidino-2-phenylindole; Invitrogen #D1306) for 3 hr at room temperature. The embryos were then stored in 70% glycerol, mounted, and imaged using an Olympus Fluoview Upright Confocal Microscope. Image acquisition and analysis was carried out using Olympus Fluoview FV10-ASW software. The primary antibodies used were: mouse anti-myosin heavy chain A4.1025 (Developmental Studies Hybridoma Bank, 1:20), rabbit anti-acetylated tubulin (Cell Signaling Technology #5335) and mouse anti-γ-tubulin GTU-88 (Sigma #T6557) (both 1:500). DAPI was used to label cell nuclei. High-speed video microscopy of zebrafish cilia To record cilia motility, zebrafish embryos were embedded in 2% agarose (with 0.0175% Tricaine for 24 hpf embryos) on 50 mm glass-bottom dishes. Ciliary motility was viewed with a 63X water-dipping objective on an upright Zeiss Axioplan2 microscope equipped with a Hamamatsu ORCA-Flash4.0 V2 C11440-22CU camera. Processing of videos was performed with ImageJ 1.44d ( Schneider et al., 2012 ).
Transmission electron microscopy
(TEM) of KV cilia Zebrafish embryos at 10 somites stage (~14 hpf) were fixed with a standard TEM fixative solution of 2.5% glutaraldehyde and 4% paraformaldehyde in 0.1 M HEPES at 4°C overnight. Samples were washed with HEPES buffer and post fixed in 1% osmium tetroxide in 0.1 M HEPES for 2 hr. After post fixation, samples were rinsed with 0.1 M HEPES three times and treated with 1% tannic acid in 0.1 M HEPES buffer for 1 hr. Consecutively, samples were washed thoroughly with water three times. Samples were treated with series of ethanol solutions (50%, 75% ethanol) for ten minutes. Embryos were processed for enblock staining with 1% uranyl acetate in 75% ethanol for 1 hr on ice. After enblock staining, samples were processed for dehydration in a series of ethanol solutions (85%, 90%, 95%) on ice. The final dehydration procedure was done at room temperature using 100% ethanol twice for 15 minutes. Dehydration was continued with propylene oxide for 15 minutes two times. Subsequently, infiltration was done using propylene oxide and epon resin mixture. Later 100% epon was used for overnight infiltration. Embryos were changed into 100% fresh epon resin two times before embedding. Samples were embedded in 100% resin and polymerized at 64°C. Ultrathin sections, with thickness of 60 nm, were collected, stained with lead citrate solution, and imaged with a JEOL Flash-1400 microscope.
Mouse genotyping
All mice were genotyped at 3 weeks of age by collection of ~1 mm diameter ear clips. DNA was extracted by adding 20 μg Proteinase K, 50 mM Tris pH 8.0, 0.5% Tween, 1 mM EDTA and H 2 O to a total volume of 35 ml, followed by incubation at 55°C for 1 hour (for proteinase activity) and 95°C for 5 mins (to inactivate the enzyme). 50 ng of extracted DNA was used in downstream genotyping assays. Allele counts were determined via quantitative reverse transcription PCR (RT-qPCR). Embryos were genotyped by collection of either the yolk sac during dissection, or a tail segment after analysis and alleles were determined via PCR and amplicon visualization on agarose gels. Quantitative reverse transcription PCR (RT-qPCR) Adult mouse tissue was collected, and total RNA extracted (QIAGEN RNeasy mini kit, #74104). cDNA was synthesized using an Applied Biosystems High-Capacity cDNA Reverse Transcription Kit (Thermo Fisher Scientific, #4368814). Primers were designed to be specific to the gene of interest and their amplification efficiency was checked using testis cDNA. Only primers that produced a single amplicon were used for analysis. All RT-qPCR experiments used Agilent Technologies qPCR Brilliant IISYBR Master Mix (Cat #600828) and experiments were performed on an Applied Biosystems 7500 Fast Real-Time PCR machine. Gene expression was assessed using 50 ng of cDNA in technical triplicates and 5 biological replicates, with Gapdh used at the reference gene for normalization.
Antibody Generation Recombinant 6xHis-tagged mouse
PIERCE1 protein was expressed in BL21(DE3)pLysS competent cells (Novagen) and purified by Ni-NTA affinity chromatography. Purified protein was injected into New Zealand White rabbits (by Covalab, France); antibodies were purified from rabbit sera by affinity purification using PIERCE1 recombinant protein bound to SulfoLink resin (Thermo Fisher Scientific, Cat #20401).
Western Blot Analysis
Whole cell lysates from mouse testes were extracted with SDS lysis buffer, containing protease inhibitor cocktail, on ice by homogenization. The homogenates were incubated on ice for 30 min, and cell debris was pelleted by centrifugation at 13,000 rpm, at 4°C for 10 min. Supernatant samples were resolved on 12% SDS-PAGE gels and transferred onto polyvinylidene fluoride (PVDF) membrane (Pall Corporation). Following transfer, membranes were blocked with 5% non-fat milk dissolved in 1X Tris Buffered Saline-Tween (TBS-TWEEN) for 1 hr at room temperature. Primary antibody (rabbit anti-Pierce1, polyclonal, 1:200), diluted in the same blocking solution, was added to the membrane, and incubated overnight at 4°C. The membrane was washed 3 times with TBS-TWEEN at 10 min intervals. Secondary antibody (polyclonal goat anti-rabbit conjugated with horseradish peroxidase (HRP), Agilent Cat #P0448), diluted (1:2000) in blocking solution, was added to the membrane and incubated for 1 hr at room temperature, followed by three TBS-TWEEN washes at 10 min intervals. Enhanced chemiluminescent (ECL) substrate (Geneflow) was used to detect the signal from the HRP-conjugated secondary antibody.
Mouse embryo phenotyping
Embryos were dissected in phosphate buffered saline (PBS) under a light microscope. The head was removed, and the thoracic cavity opened. For phenotyping, embryos were scored according to lung lobation, heart apex position, heart outflow tract patterning and stomach position. Any other gross abnormalities were also noted. All imaging was performed in PBS using a Teledyne Lumenera Infinity3-6URC camera on a Leica MZ12.5 microscope. Tail clips were taken after imaging for genotyping purposes.
LacZ embryo staining
Embryos were harvested in PBS at the desired developmental time point and fixed in 1% formaldehyde, 0.2% glutaraldehyde, 2 mM MgCl 2 , 5 mM EGTA and 0.02% NP-40 in PBS overnight. Samples were washed 3× with 0.02% NP-40 in PBS and stained for 18 hours at 37°C with 0.5 mg/ml X-gal, 10 mM K 3 Fe(CN) 6 , 10 mM K 4 Fe(CN) 6 , 2 mM MgCl 2 , 0.01% sodium deoxycholate and 0.02% NP-40 in PBS. Stained embryos were imaged in PBS using a Leica DFC420 camera on a Leica MZ16F microscope. Whole embryos were taken after imaging for genotyping purposes.
Nodal cilia analysis
Embryos from Pierce1 +/− × Pierce1 +/− or Pierce2 +/− × Pierce2 +/− crosses were harvested at E8.0 and dissected in pre-warmed DMEM (GIBCO, #10569010) supplemented with 10% FBS (GIBCO, #10500064). To visualize nodal cilia rotation, embryos were mounted on slides in the medium with the node facing up. Differential interference contrast (DIC) video capture was performed at 100 frames per second at 100X magnification using a Leica DM2500 compound microscope equipped with a monochrome high-speed Hamamatsu C9300 camera. Nodal cilia rotation was quantified by counting the number of frames per 5 complete rotations for a minimum of 5 cilia per embryo. Cilia movement type was also determined from the same videos. Embryos were taken for genotyping after imaging. Particle image velocimetry (PIV) of nodal cilia Embryos from Pierce1 +/− × Pierce1 +/− intercrosses were harvested at E8.0 in pre-warmed DMEM with 10% FBS. 0.2 μm diameter FluoSpheres (Thermo Fisher Scientific, #F8848) were diluted 1:10 with the same DMEM with 10% FBS medium and then placed over embryos mounted on pre-warmed (37°C) glass microscope slides. Videos were captured using a Zeiss EC Plan-Neofluar 40×/0.75 lens and an AxioCam HRm camera with a VivaTome attachment, on a Zeiss Observer.Z1 microscope. Data points were binarized and dilated using ImageJ ( Schneider et al., 2012 ), before particle image velocimetry analysis using PIVLab plugin in MATLAB ( Thielicke and Stamhuis, 2014 ) to track the movement of each fluorescent bead frame-to-frame. Embryos at 2-3 somite stages were used for this analysis.
Whole mount in situ hybridization
(WISH) of mouse nodal genes Anti-sense WISH probes for Pierce1 and Pierce2 were generated against DNA sequences corresponding to Pierce1 16-768 nt ( NM_027040.1 ) and Pierce2 98-550 nt ( NM_001198789.1 ). PCR-generated sequences were ligated into the pBluescript II KS(−) vector linearized with EcoRV. The identity of the cloned sequence was confirmed by DNA sequencing (Source BioScience) primed using the T3 and T7 promoter sequences. Digoxygenin-labeled anti-sense riboprobes for Cerl2 ( Marques et al., 2004 ), Pitx2 ( Ryan et al., 1998 ), Pierce1 , and Pierce2 were transcribed from either the T3 or T7 promoter. WISH experiments were performed as described ( Field et al., 2011 ) using anti-Digoxigenin antibody (Roche, #11093274910) and NBT/BCIP staining (Roche, #11681460001). Stained embryos were imaged in PBS using a Leica DFC420 camera on a Leica MZ16F microscope. Whole embryos were taken after imaging for genotyping. High-speed video microscopy of tracheal motile cilia Tracheas from 10–12-week-old mice were harvested, excess tissue removed, then cut into rings approximately the width of one cartilage ridge. Samples were incubated at 37°C, 5% CO 2 overnight in MEM (GIBCO, #11544456) medium with 1% penicillin-streptomycin (GIBCO, #11528876) and 0.2% nystatin (GIBCO, #11548886). Rings were allowed to settle for 20 mins on the stage of an inverted Olympus IX71 microscope in an environmental chamber at 37°C, prior to video capture. High-speed video recordings were taken at 500 frames per second, 60X magnification objective (Olympus LUCPlan FLN) using a Photron MC 2.1 FastCam camera. Average ciliary beat frequency (CBF) was measured by fast Fourier transform analysis using a CBF panel FFT V2.700 ImageJ plugin. Ciliary beat pattern (CBP, stiffness), amplitude and synchronization were independently assessed by 3 expert reviewers who were blind to sample genotypes, viewing videos at 30 frames per second. Videos containing debris or non-ciliated cells were excluded from the analysis. TEM of mouse tracheal cilia Tracheas were harvested as detailed above. Rings were fixed in 3% glutaraldehyde, 0.1 M cacodylate buffer (overnight), post-fixed in 2% osmium tetroxide in 0.1 M cacodylate buffer (2 hours), dehydrated in ethanol and embedded in Spurr’s resin ( Spurr, 1969 ) following an established protocol. Ultra-thin sections (100 nm) were cut (Leica EM UC7 ultramicrotome) and stained with lead citrate, then imaged using a Hitachi HT7700 transmission electron microscope. Ultrastructural defects were scored by examination of 300+ ciliary cross-sections per sample by an expert electron microscopist. Acilium was tagged as defective for axonemal dyneins if fewer than 7 ODAs or 5 IDAs were observed. Figures Figure panels depicting cryo-EM maps or atomic models were generated using Chimera ( Pettersen et al., 2004 ) or ChimeraX ( Pettersen et al., 2021 ). Maps colored by local resolution were generated using RELION 3.1 ( Zivanov et al., 2018 ). Structural biology software were installed and configured by SBGrid ( Morin et al., 2013 ).
Supplementary Material 1 2 4 6 3 8 9 10 7 12 5 13 11 14
📊 Figures
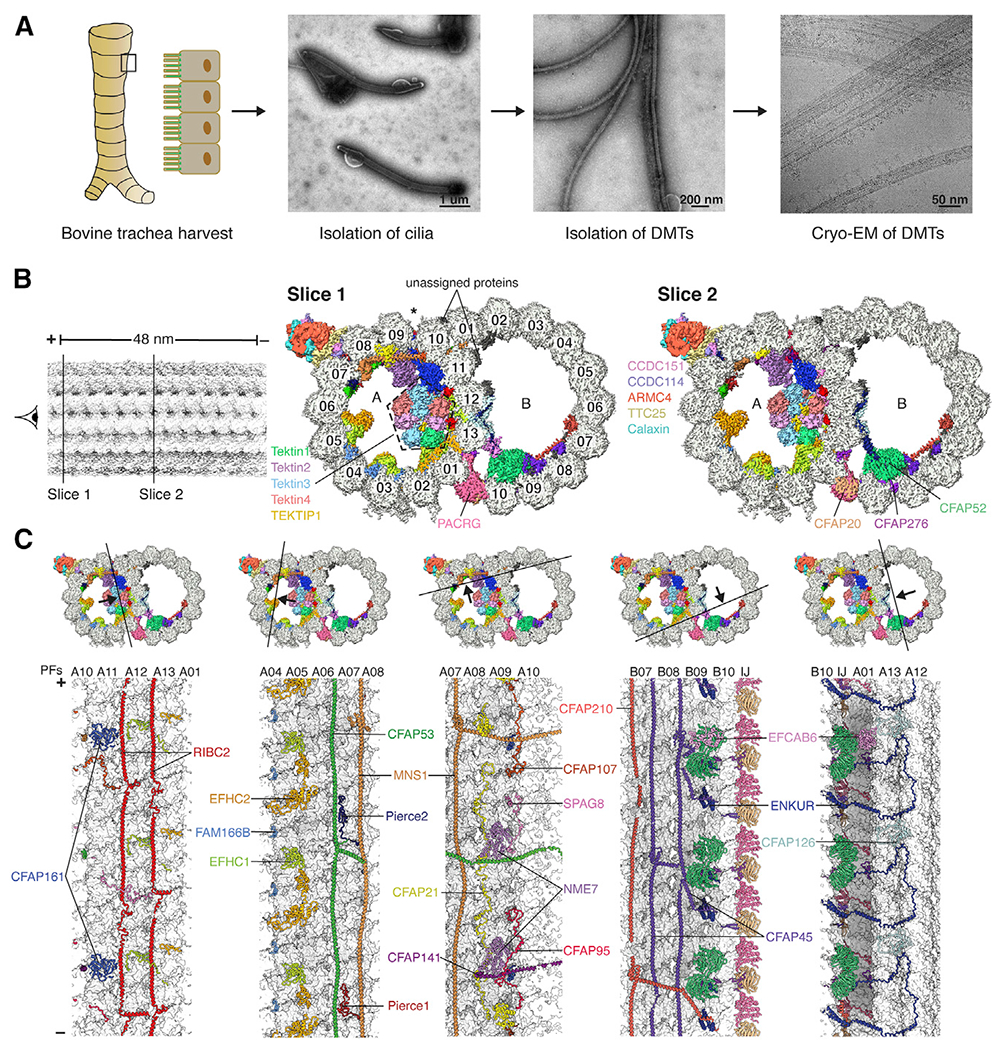
Figure 1.
The 48-nm repeat structure of bovine doublet microtubules (DMTs)
(A) Isolation of bovine DMTs for cryo-EM analysis. (B) Two slices through the DMT map, showing density for the MIPs and ODA-DC. Protofilaments are numbered, and the seam of the A tubule is marked with...
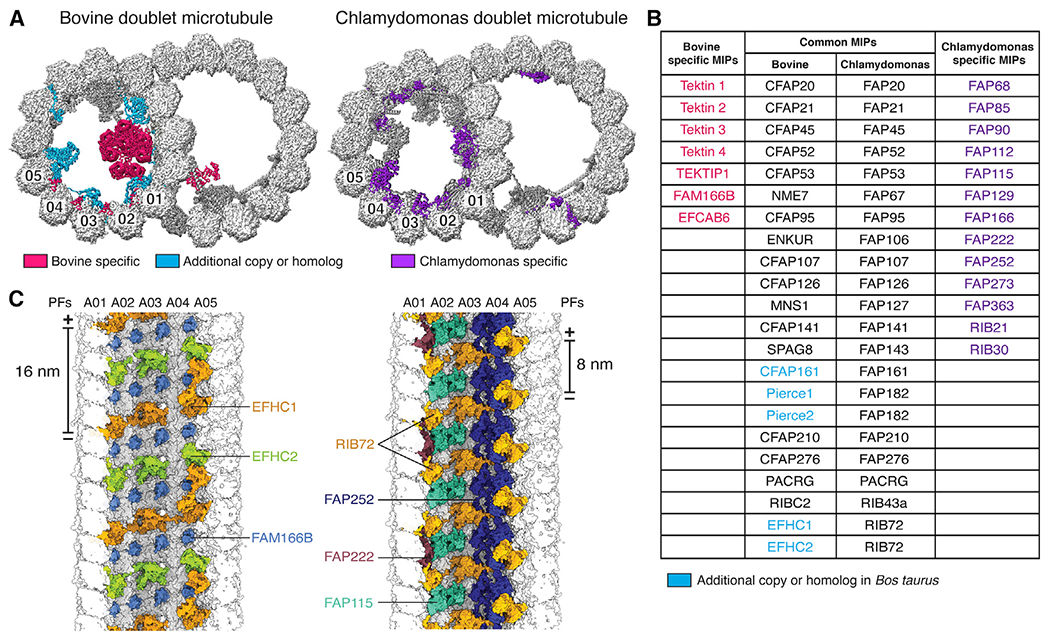
Figure 2.
Microtubule inner proteins (MIPs) of mammalian DMTs
(A) Cross-sections of bovine (left) and Chlamydomonas (right) DMTs, with MIPs colored by conservation. MIPs present in both organisms are colored dark gray. (B) Table of MIPs identified in bovine and ...
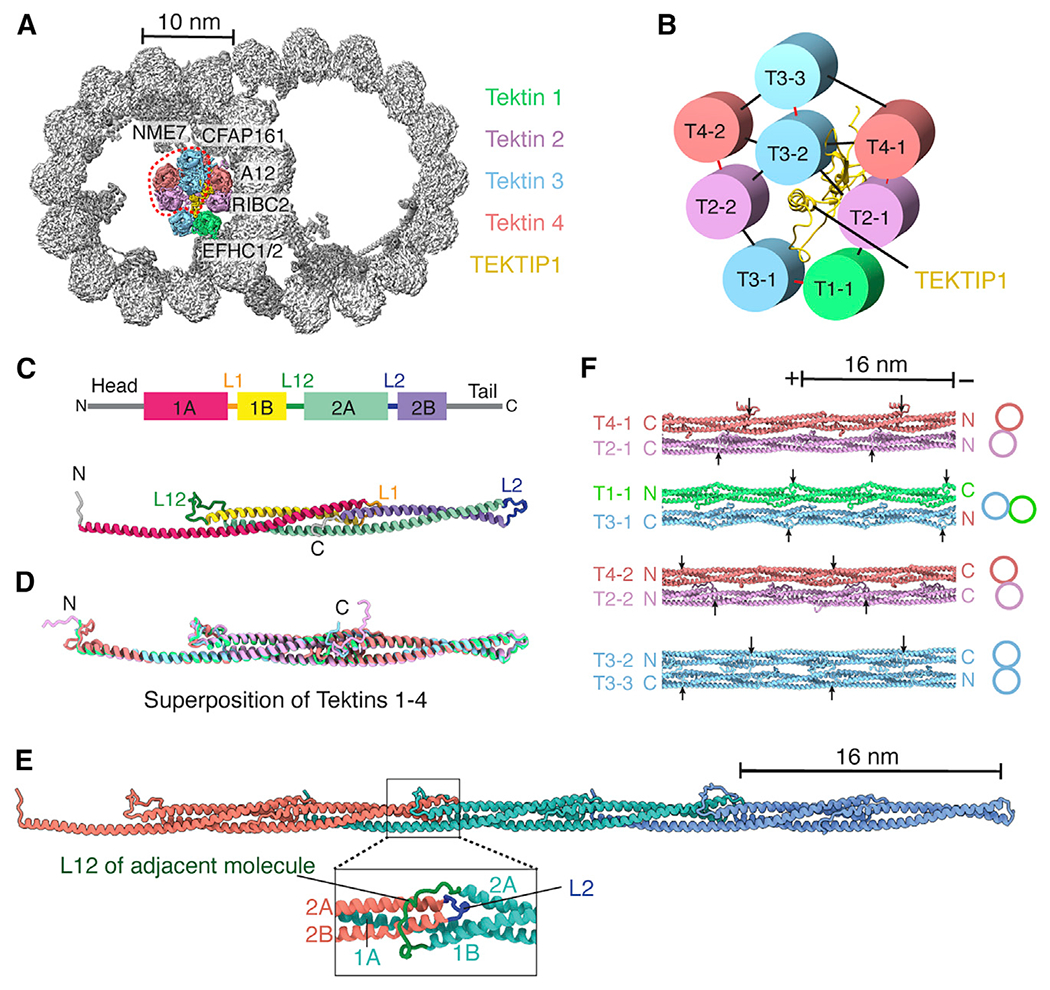
Figure 3.
Tracheal DMTs contain a luminal bundle of tektin filaments
(A) Cross-section of the bovine DMT, showing a luminal bundle of tektin filaments. The luminal-most tektin filaments (circled) are absent from some particles. The MIPs and PF A12 that interact with te...
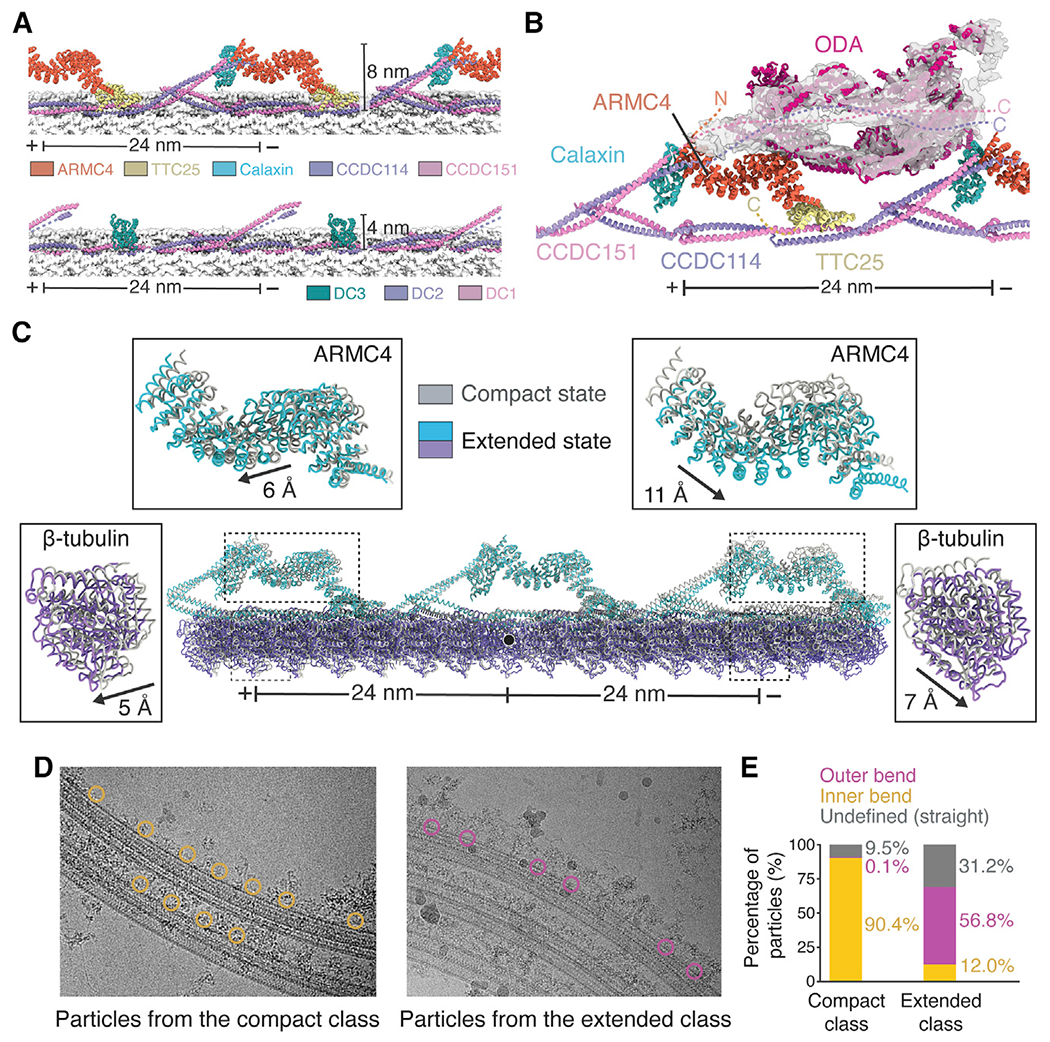
Figure 4.
Structure and dynamics of the mammalian outer dynein arm (ODA) and ODA docking complex (ODA-DC)
(A) Models of bovine (top) and Chlamydomonas (bottom) ODA-DCs. Tubulin is shown in surface representation. (B) Model of the Chlamydomonas ODA (PDB: 7KZM) docked into the cryo-EM map of the bovine ODA....
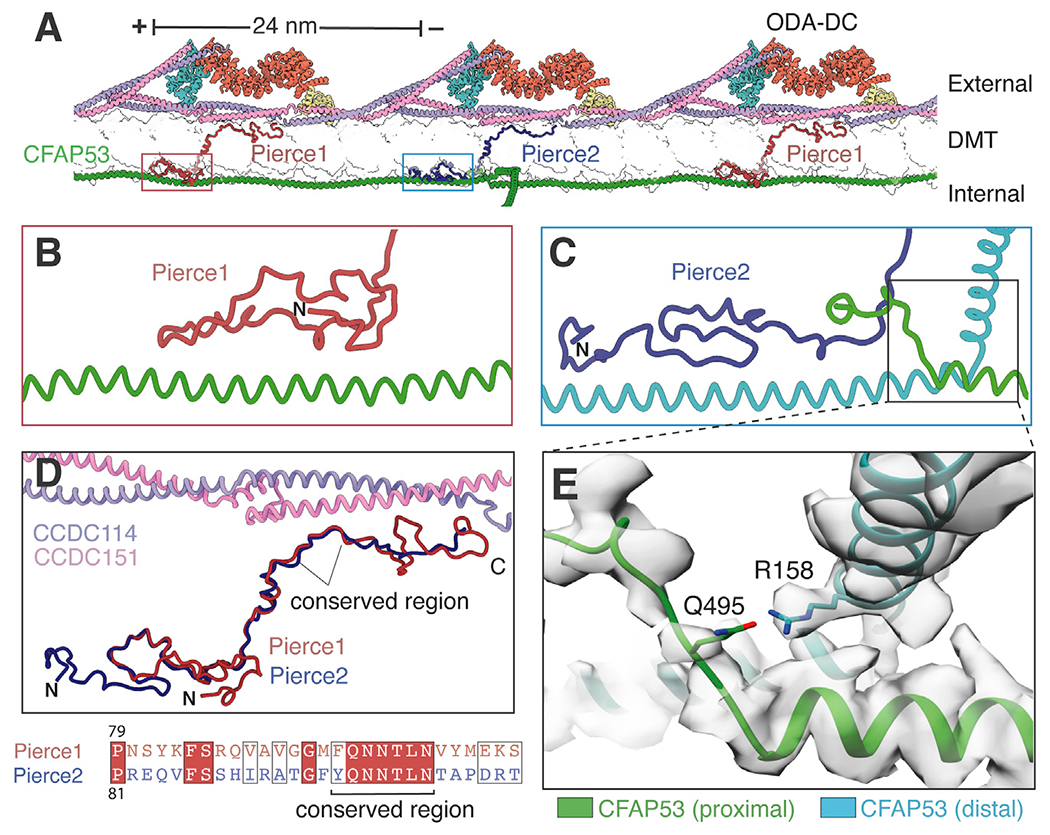
Figure 5.
Pierce1 and Pierce2 link the ODA-DC to the MIP architecture
(A) Atomic model showing Pierce1 and Pierce2 spanning the microtubule wall (shown in transparent surface representation) and linking the external ODA-DC to the filamentous MIP CFAP53. (B and C) Intera...
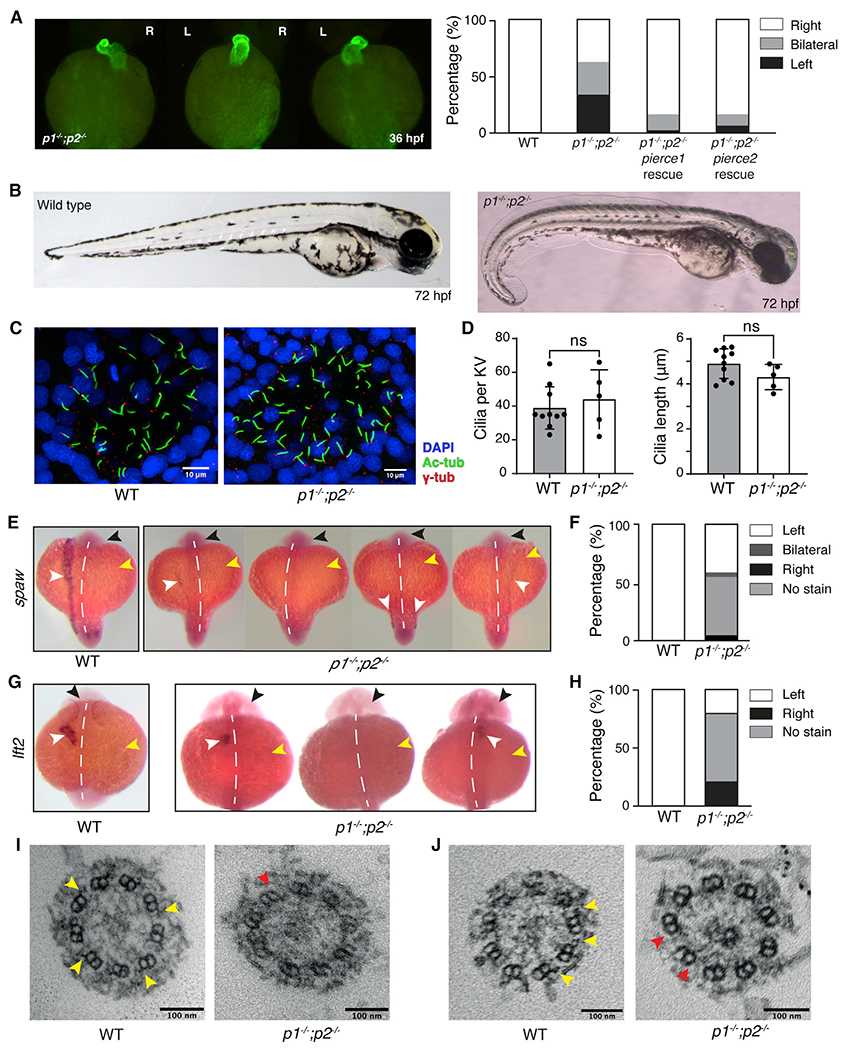
Figure 6.
Laterality defects in pierce1; pierce2 ( p1 u2212/u2212 ; p2 u2212/u2212 ) double-mutant zebrafish embryos
(A) Left: Immunofluorescence (IF) microscopy showing heart jogging directionality at 36 hpf. Images from left to right show the three heart jogging directions observed when imaged ventrally: rightward...
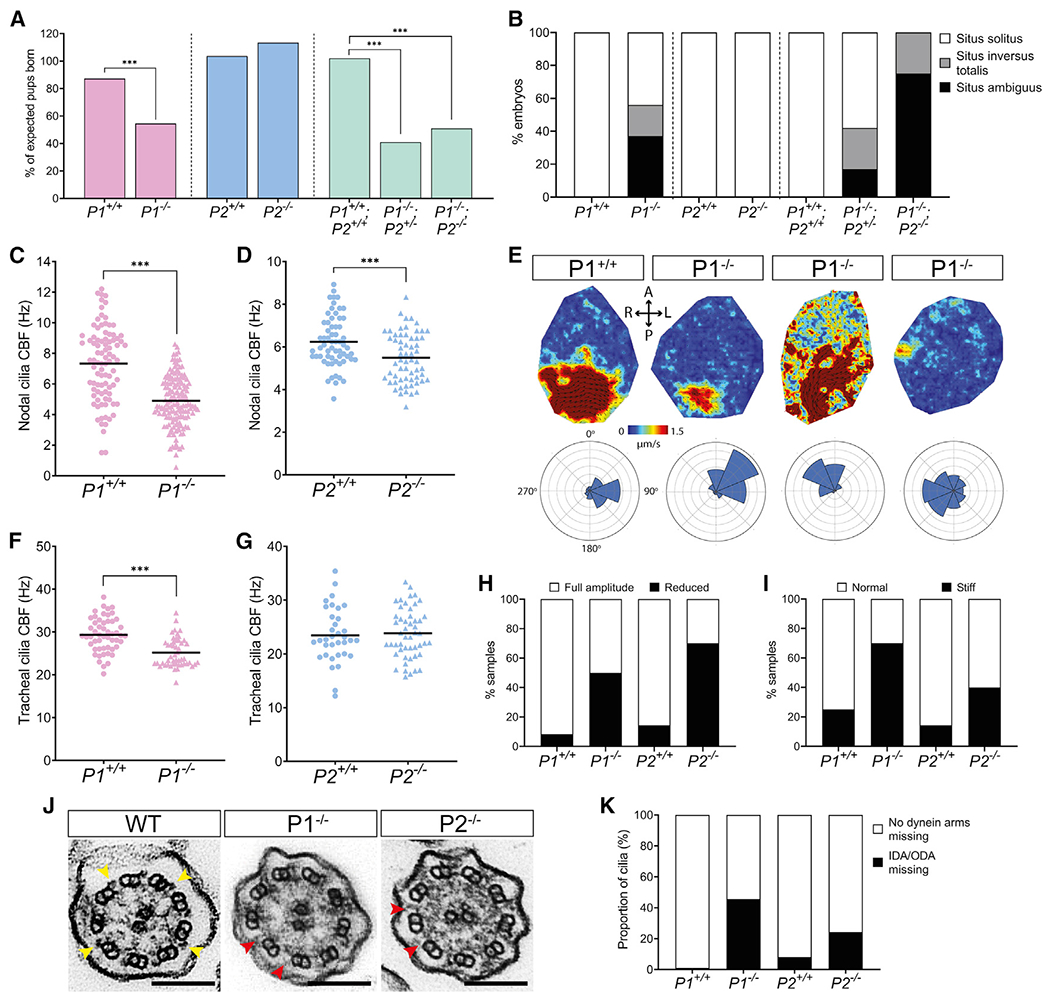
Figure 7.
Pierce1 -deficient mice have aberrant nodal and tracheal cilia motility
(A) Pierce1 (P1) u2212/u2212 and P1 u2212/u2212 ; P2 u2212/u2212 double knockout mice have high embryonic lethality, whereas P2 u2212/u2212 mice do not. All other genotypes were born at the expected f...
Figure images are served from the NIH/NLM PubMed Central Open Access Subset or Europe PMC; copyright remains with the publishers and authors.
💬 Discussion
0 commentsNo comments yet. Be the first to start a discussion!
Leave a Comment