Abstract
As key functional units in neural circuits, different types of neuronal synapses play distinct roles in brain information processing, learning, and memory. Synaptic abnormalities are believed to underlie various neurological and psychiatric disorders. Here, by combining cryo-electron tomography and cryo-correlative light and electron microscopy, we distinguished intact excitatory and inhibitory synapses of cultured hippocampal neurons, and visualized the in situ 3D organization of synaptic organelles and macromolecules in their native state. Quantitative analyses of >100 synaptic tomograms reveal that excitatory synapses contain a mesh-like postsynaptic density (PSD) with thickness ranging from 20 to 50 nm. In contrast, the PSD in inhibitory synapses assumes a thin sheet-like structure ∼12 nm from the postsynaptic membrane. On the presynaptic side, spherical synaptic vesicles (SVs) of 25-60 nm diameter and discus-shaped ellipsoidal SVs of various sizes coexist in both synaptic types, with more ellipsoidal ones in inhibitory synapses. High-resolution tomograms obtained using a Volta phase plate and electron filtering and counting reveal glutamate receptor-like and GABAA receptor-like structures that interact with putative scaffolding and adhesion molecules, reflecting details of receptor anchoring and PSD organization. These results provide an updated view of the ultrastructure of excitatory and inhibitory synapses, and demonstrate the potential of our approach to gain insight into the organizational principles of cellular architecture underlying distinct synaptic functions.SIGNIFICANCE STATEMENT To understand functional properties of neuronal synapses, it is desirable to analyze their structure at molecular resolution. We have developed an integrative approach combining cryo-electron tomography and correlative fluorescence microscopy to visualize 3D ultrastructural features of intact excitatory and inhibitory synapses in their native state. Our approach shows that inhibitory synapses contain uniform thin sheet-like postsynaptic densities (PSDs), while excitatory synapses contain previously known mesh-like PSDs. We discovered "discus-shaped" ellipsoidal synaptic vesicles, and their distributions along with regular spherical vesicles in synaptic types are characterized. High-resolution tomograms further allowed identification of putative neurotransmitter receptors and their heterogeneous interaction with synaptic scaffolding proteins. The specificity and resolution of our approach enables precise in situ analysis of ultrastructural organization underlying distinct synaptic functions.
🔬 Techniques
🔭 Microscopes
💻 Software
✨ Fluorophores
🧪 Sample Preparation
🔬 Cell Lines
🏭 Microscope Brands
🧪 Reagent Suppliers
📷 Detectors
💻 Software Details
💾 Data Repositories
🏷️ Research Resource Identifiers (RRIDs)
Verified research resources used in this paper:
🏛️ Research Organizations (ROR)
Affiliated research institutions:
📋 Methods
The overall workflow of experimental procedures is illustrated in Figure 1 A . Primary neuronal cultures were grown on EM grids and then plunge-frozen for cryo-ET imaging followed by 3D reconstruction. For some cultures transfected with constructs of fluorescent protein-tagged synaptic proteins, cryo-fluorescence microscopy was performed before cryo-ET for correlative imaging. All animal procedures were performed following the guidelines of the Animal Experiments Committee at the University of Science and Technology of China. Primary culture of hippocampal neurons. Low-density cultures of dissociated embryonic rat hippocampal neurons were prepared as previously described ( Bi and Poo, 1998 ) with modifications. Quantifoil R2/2 gold EM grids (200 mesh with holey carbon film of 2 μm hole size and 2 μm spacing) or Quantifoil R2/2 gold NH2 finder grids (100 mesh with holey carbon film of 2 μm hole size and 2 μm spacing) were plasma-cleaned with H 2 and O 2 for 10 s using a plasma cleaning system (Gatan), and sterilized with UV light for 30 min. These grids were then coated with poly- l -lysine (Sigma-Aldrich) overnight, followed by washing with HBSS and double-distilled H 2 O for ∼12 h each. Hippocampi were removed from embryonic day 18 rats (without distinguishing sex differences) and were treated with trypsin for 15 min at 37°C, followed by washing and gentle trituration. The dissociated cells were plated on the poly- l -lysine-coated EM grids in 35 mm Petri dishes at a density of 40,000–60,000 cells/ml, and maintained in incubators at 37°C in 5% CO 2 . The culture medium was NeuroBasal (Invitrogen) supplemented with 5% heat-inactivated bovine calf serum (PAA Laboratories) plus 5% heat-inactivated fetal bovine serum (HyClone), 1× Glutamax (Invitrogen), and 1× B27 (Invitrogen). Twenty-four hours after plating, half of the medium was replaced by serum-free culture medium. Subsequently, one-third of the culture medium was replaced with fresh culture medium twice a week. For correlative microscopy, cultures were coinfected with lentiviruses encoding PSD-95-EGFP and mCherry-gephyrin constructs (see below) for 5–7 d in vitro (DIV) before vitrification of the grid. Twelve hours after the infection, half of the culture medium was replaced by fresh medium. To prevent overgrowth of glial cells, the cultures were treated with cytosine arabinoside (Sigma-Aldrich) at various stages. Cultures were used for cryo-EM imaging at 14–18 DIV, when healthy, low-density cultures formed patches of monolayer neuronal processes ( Fig. 1 B1 ). We judge whether the culture is healthy based on morphological criteria, e.g., smooth soma and dendrites with multiple branches viewed under phase-contrast LM, and ≥1 probable synapse each few micrometers along the dendrites of transfected neurons, as viewed under fluorescence microscopy. According to our experience, such criteria predict retention of functional properties of synaptic transmission and plasticity evaluated with patch-clamp recording and calcium imaging. DNA constructs and lentivirus preparation. The PSD-95 cDNA was amplified from GW-PSD-95-EGFP plasmid (a generous gift from Dr. Weidong Yao) and subcloned into pLenti-CaMKII-mKate2 vector to produce pLenti-CaMKII-PSD-95-mKate2. The EGFP cDNA was amplified from the pEGFPN1 plasmid, and then subcloned into pLenti-CaMKII-PSD-95-mKate2 to produce the pLenti-CaMKII-PSD-95-EGFP plasmid. The mCherry-gephyrin lentiviral construct ( Dobie and Craig, 2011 ) was a generous gift from Dr. Ann Marie Craig. Both PSD-95-EGFP and mCherry-gephyrin lentiviral constructs were packaged into lentivirus following a protocol from Dr. Karl Deisseroth's laboratory ( Zhang F et al., 2010 ). Frozen-hydrated sample preparation. After being removed from the CO 2 incubator, low-density neuronal cultures (14–18 DIV) on EM grids were first placed in extracellular solution (ECS; containing 150 m m NaCl, 3 m m KCl, 3 m m CaCl 2 , 2 m m MgCl 2 , 10 m m HEPES, and 5 m m glucose, pH 7.3), then mounted on a Vitrobot IV (FEI). Protein A-coated colloidal gold beads (15 nm; CMC) were added to the grid (4 μl each, stock solution washed in ECS and diluted 10 times after centrifugation) as fiducial markers. The grids were then plunged into liquid ethane for rapid vitrification of the samples, which were then stored in liquid nitrogen until use. Cryo-ET imaging. Cryo-ET data were collected with single-axis tilt using either a Tecnai F20 transmission electron microscope (FEI) equipped with an Eagle 4K × 4K multiport CCD camera (FEI), or a Titan Krios (FEI) with a K2 Summit direct electron detector (K2 camera, Gatan). The Tecnai F20 was operated at an acceleration voltage of 200 kV. Tilt series were collected from −60 to +60° at of 2° intervals using FEI Xplore 3D software, with the defocus value set at −12 to −18 μm, and the total electron dosage of ∼100 e − /Å 2 . The final pixel size was 0.755 nm. The Titan Krios was operated at an acceleration voltage of 300 kV, with or without VPP and Gatan image filter (GIF). In either configuration, images were collected by the K2 camera in counting mode. In the absence of VPP and GIF, tilt series were acquired from −64 to +64° at 2° intervals using Leginon ( Suloway et al., 2005 ), with the defocus value maintained at −10 μm, and the total accumulated dose of ∼120 e − /Å 2 . The final pixel size was 0.765 nm. When VPP and GIF were used, the energy filter slit was set at 20 eV, and VPP was conditioned by preirradiation for 60 s to achieve an initial phase shift of ∼0.3π ( Fukuda et al., 2015 ). Tilt series were acquired from −66 to +60° at an interval of 2 or 3° using SerialEM ( Mastronarde, 2005 ) with the defocus value maintained at −1 μm and the total accumulated dose of ∼150 e − /Å 2 . The final pixel size was 0.435 nm. For this study, we examined 78 grids, of which 12 were used for data collection. The rest were discarded because the grids were damaged during transfer or freezing, cultures were too dense and/or too thick, or cultures appeared not healthy with few or no synapses found. Usually 3–5 grid squares (each ∼100 × 100 μm 2 ) per grid were selected for imaging. To obtain high-quality cryo-ET images, it is critical to choose thin culture areas with healthy yet relatively low-density dendrites ( Fig. 1 B2 ). Generally, areas >∼500 nm thick were ignored. At this thickness, subcellular structures, such as mitochondria, microtubules, and SVs, could not be distinguished in single-projection images. Cryo-correlative light and electron microscopy imaging. The hardware of our cryo-light microscope system includes a custom-built cryo-chamber with liquid nitrogen supply, a Gatan 626 EM cryo-holder, and an Olympus IX71 inverted fluorescence microscope ( Fig. 1 C ). The inside channel of the cryo-chamber was precooled to −190°C by liquid nitrogen, and maintained below −180°C, as monitored by a thermoelectric sensor. Nitrogen gas flowed through the objective lens and light-source windows during the experiment to prevent frost accumulation. Then, an EM grid with frozen-hydrated sample was loaded onto an EM cryo-holder, which was subsequently inserted into the cryo-chamber. For cryo-CLEM imaging, fluorescence images were taken using a 40× air-objective lens (Olympus LUCPLFLN 40×; numerical aperture, 0.6) and an ANDOR NEO sCMOS camera (Andor) attached to the fluorescence microscope. For each field of view, three images were collected, one in bright field, another in the EGFP channel [exciter (Ex): 470/40; dichroic mirror (DM): 495; emitter (Em): 525/50; Chroma, 49002], and the third in the mCherry channel (Ex: 562/40; DM: 593; Em: 641/75; Semrock, mCherry-B-000). Typically, ∼10 sets of images were sufficient to cover all good areas (∼40 squares) on each grid, which took ∼20 min to complete; a “good area” was defined as a grid square (∼100 × 100 μm 2 ) of appropriate sample thickness that displayed multiple dendritic branches, usually containing dozens of PSD-95-EGFP puncta or multiple mCherry-gephyrin puncta under fluorescence microscopy ( Fig. 1 D1 ). Immediately after the LM imaging, the EM cryo-holder with grid was directly transferred into a Tecnai F20 scope. Areas of the sample imaged in cryo-light microscope were identified in the EM using the indexes of the finder grids ( Fig. 1 D1 , D2 ). Low-magnification (330×) EM images were collected and approximately aligned with bright-field LM images using Midas program in the IMOD package (RRID: SCR_003297 ; Kremer et al., 1996 ). After rough alignment, a set of holes on the carbon layer of the grid were picked from both the low-magnification EM images and their corresponding fluorescence images using 3dmod in the IMOD package. Transformation functions between the EM and LM images were calculated based on the selected positions by minimizing the mean squared error. When the low-magnification EM image and LM image were optimally aligned ( Fig. 1 D3 ), ∼15 holes on carbon (in one square) in the low-magnification EM image were selected, with their pixel positions recorded. The same holes were identified at 5000× magnification and the mechanical coordinates were recorded. Afterward, the transformation function from the pixel positions to EM mechanical coordinates was determined using similar linear regression methods. With the transformation functions, positions of selected fluorescent puncta (putative excitatory or inhibitory synapses) were converted into corresponding EM mechanical coordinates, which were used to guide EM-image acquisition. Tilt series were collected on the area with selected fluorescent signals. Finally, tomographic slices were fine-aligned and merged with the fluorescence images to identify each synapse ( Fig. 1 D4 ) using Midas and ImageJ (RRID: SCR_003070 ). Python scripts (RRID: SCR_008394 ) to integrate the correlation procedures are available to interested readers upon request. Three-dimensional reconstruction and rendering. Tilt series were aligned and reconstructed using IMOD. Gold beads added to the sample before plunge freezing were used as fiducial markers to align the tilt series. Reconstruction was performed using a simultaneous iterative reconstruction technique with 5 or 15 iterations. A fraction of the data collected was discarded during reconstruction for technical reasons: for Tecnai F20, ∼50% of the data were discarded because of such issues as stage drift, beam blockade at high tilt angles, and occasional autofocus failure; for Titan Krios,
Show full methods section
The overall workflow of experimental procedures is illustrated in Figure 1 A . Primary neuronal cultures were grown on EM grids and then plunge-frozen for cryo-ET imaging followed by 3D reconstruction. For some cultures transfected with constructs of fluorescent protein-tagged synaptic proteins, cryo-fluorescence microscopy was performed before cryo-ET for correlative imaging. All animal procedures were performed following the guidelines of the Animal Experiments Committee at the University of Science and Technology of China. Primary culture of hippocampal neurons. Low-density cultures of dissociated embryonic rat hippocampal neurons were prepared as previously described ( Bi and Poo, 1998 ) with modifications. Quantifoil R2/2 gold EM grids (200 mesh with holey carbon film of 2 μm hole size and 2 μm spacing) or Quantifoil R2/2 gold NH2 finder grids (100 mesh with holey carbon film of 2 μm hole size and 2 μm spacing) were plasma-cleaned with H 2 and O 2 for 10 s using a plasma cleaning system (Gatan), and sterilized with UV light for 30 min. These grids were then coated with poly- l -lysine (Sigma-Aldrich) overnight, followed by washing with HBSS and double-distilled H 2 O for ∼12 h each. Hippocampi were removed from embryonic day 18 rats (without distinguishing sex differences) and were treated with trypsin for 15 min at 37°C, followed by washing and gentle trituration. The dissociated cells were plated on the poly- l -lysine-coated EM grids in 35 mm Petri dishes at a density of 40,000–60,000 cells/ml, and maintained in incubators at 37°C in 5% CO 2 . The culture medium was NeuroBasal (Invitrogen) supplemented with 5% heat-inactivated bovine calf serum (PAA Laboratories) plus 5% heat-inactivated fetal bovine serum (HyClone), 1× Glutamax (Invitrogen), and 1× B27 (Invitrogen). Twenty-four hours after plating, half of the medium was replaced by serum-free culture medium. Subsequently, one-third of the culture medium was replaced with fresh culture medium twice a week. For correlative microscopy, cultures were coinfected with lentiviruses encoding PSD-95-EGFP and mCherry-gephyrin constructs (see below) for 5–7 d in vitro (DIV) before vitrification of the grid. Twelve hours after the infection, half of the culture medium was replaced by fresh medium. To prevent overgrowth of glial cells, the cultures were treated with cytosine arabinoside (Sigma-Aldrich) at various stages. Cultures were used for cryo-EM imaging at 14–18 DIV, when healthy, low-density cultures formed patches of monolayer neuronal processes ( Fig. 1 B1 ). We judge whether the culture is healthy based on morphological criteria, e.g., smooth soma and dendrites with multiple branches viewed under phase-contrast LM, and ≥1 probable synapse each few micrometers along the dendrites of transfected neurons, as viewed under fluorescence microscopy. According to our experience, such criteria predict retention of functional properties of synaptic transmission and plasticity evaluated with patch-clamp recording and calcium imaging. DNA constructs and lentivirus preparation. The PSD-95 cDNA was amplified from GW-PSD-95-EGFP plasmid (a generous gift from Dr. Weidong Yao) and subcloned into pLenti-CaMKII-mKate2 vector to produce pLenti-CaMKII-PSD-95-mKate2. The EGFP cDNA was amplified from the pEGFPN1 plasmid, and then subcloned into pLenti-CaMKII-PSD-95-mKate2 to produce the pLenti-CaMKII-PSD-95-EGFP plasmid. The mCherry-gephyrin lentiviral construct ( Dobie and Craig, 2011 ) was a generous gift from Dr. Ann Marie Craig. Both PSD-95-EGFP and mCherry-gephyrin lentiviral constructs were packaged into lentivirus following a protocol from Dr. Karl Deisseroth's laboratory ( Zhang F et al., 2010 ). Frozen-hydrated sample preparation. After being removed from the CO 2 incubator, low-density neuronal cultures (14–18 DIV) on EM grids were first placed in extracellular solution (ECS; containing 150 m m NaCl, 3 m m KCl, 3 m m CaCl 2 , 2 m m MgCl 2 , 10 m m HEPES, and 5 m m glucose, pH 7.3), then mounted on a Vitrobot IV (FEI). Protein A-coated colloidal gold beads (15 nm; CMC) were added to the grid (4 μl each, stock solution washed in ECS and diluted 10 times after centrifugation) as fiducial markers. The grids were then plunged into liquid ethane for rapid vitrification of the samples, which were then stored in liquid nitrogen until use. Cryo-ET imaging. Cryo-ET data were collected with single-axis tilt using either a Tecnai F20 transmission electron microscope (FEI) equipped with an Eagle 4K × 4K multiport CCD camera (FEI), or a Titan Krios (FEI) with a K2 Summit direct electron detector (K2 camera, Gatan). The Tecnai F20 was operated at an acceleration voltage of 200 kV. Tilt series were collected from −60 to +60° at of 2° intervals using FEI Xplore 3D software, with the defocus value set at −12 to −18 μm, and the total electron dosage of ∼100 e − /Å 2 . The final pixel size was 0.755 nm. The Titan Krios was operated at an acceleration voltage of 300 kV, with or without VPP and Gatan image filter (GIF). In either configuration, images were collected by the K2 camera in counting mode. In the absence of VPP and GIF, tilt series were acquired from −64 to +64° at 2° intervals using Leginon ( Suloway et al., 2005 ), with the defocus value maintained at −10 μm, and the total accumulated dose of ∼120 e − /Å 2 . The final pixel size was 0.765 nm. When VPP and GIF were used, the energy filter slit was set at 20 eV, and VPP was conditioned by preirradiation for 60 s to achieve an initial phase shift of ∼0.3π ( Fukuda et al., 2015 ). Tilt series were acquired from −66 to +60° at an interval of 2 or 3° using SerialEM ( Mastronarde, 2005 ) with the defocus value maintained at −1 μm and the total accumulated dose of ∼150 e − /Å 2 . The final pixel size was 0.435 nm. For this study, we examined 78 grids, of which 12 were used for data collection. The rest were discarded because the grids were damaged during transfer or freezing, cultures were too dense and/or too thick, or cultures appeared not healthy with few or no synapses found. Usually 3–5 grid squares (each ∼100 × 100 μm 2 ) per grid were selected for imaging. To obtain high-quality cryo-ET images, it is critical to choose thin culture areas with healthy yet relatively low-density dendrites ( Fig. 1 B2 ). Generally, areas >∼500 nm thick were ignored. At this thickness, subcellular structures, such as mitochondria, microtubules, and SVs, could not be distinguished in single-projection images. Cryo-correlative light and electron microscopy imaging. The hardware of our cryo-light microscope system includes a custom-built cryo-chamber with liquid nitrogen supply, a Gatan 626 EM cryo-holder, and an Olympus IX71 inverted fluorescence microscope ( Fig. 1 C ). The inside channel of the cryo-chamber was precooled to −190°C by liquid nitrogen, and maintained below −180°C, as monitored by a thermoelectric sensor. Nitrogen gas flowed through the objective lens and light-source windows during the experiment to prevent frost accumulation. Then, an EM grid with frozen-hydrated sample was loaded onto an EM cryo-holder, which was subsequently inserted into the cryo-chamber. For cryo-CLEM imaging, fluorescence images were taken using a 40× air-objective lens (Olympus LUCPLFLN 40×; numerical aperture, 0.6) and an ANDOR NEO sCMOS camera (Andor) attached to the fluorescence microscope. For each field of view, three images were collected, one in bright field, another in the EGFP channel [exciter (Ex): 470/40; dichroic mirror (DM): 495; emitter (Em): 525/50; Chroma, 49002], and the third in the mCherry channel (Ex: 562/40; DM: 593; Em: 641/75; Semrock, mCherry-B-000). Typically, ∼10 sets of images were sufficient to cover all good areas (∼40 squares) on each grid, which took ∼20 min to complete; a “good area” was defined as a grid square (∼100 × 100 μm 2 ) of appropriate sample thickness that displayed multiple dendritic branches, usually containing dozens of PSD-95-EGFP puncta or multiple mCherry-gephyrin puncta under fluorescence microscopy ( Fig. 1 D1 ). Immediately after the LM imaging, the EM cryo-holder with grid was directly transferred into a Tecnai F20 scope. Areas of the sample imaged in cryo-light microscope were identified in the EM using the indexes of the finder grids ( Fig. 1 D1 , D2 ). Low-magnification (330×) EM images were collected and approximately aligned with bright-field LM images using Midas program in the IMOD package (RRID: SCR_003297 ; Kremer et al., 1996 ). After rough alignment, a set of holes on the carbon layer of the grid were picked from both the low-magnification EM images and their corresponding fluorescence images using 3dmod in the IMOD package. Transformation functions between the EM and LM images were calculated based on the selected positions by minimizing the mean squared error. When the low-magnification EM image and LM image were optimally aligned ( Fig. 1 D3 ), ∼15 holes on carbon (in one square) in the low-magnification EM image were selected, with their pixel positions recorded. The same holes were identified at 5000× magnification and the mechanical coordinates were recorded. Afterward, the transformation function from the pixel positions to EM mechanical coordinates was determined using similar linear regression methods. With the transformation functions, positions of selected fluorescent puncta (putative excitatory or inhibitory synapses) were converted into corresponding EM mechanical coordinates, which were used to guide EM-image acquisition. Tilt series were collected on the area with selected fluorescent signals. Finally, tomographic slices were fine-aligned and merged with the fluorescence images to identify each synapse ( Fig. 1 D4 ) using Midas and ImageJ (RRID: SCR_003070 ). Python scripts (RRID: SCR_008394 ) to integrate the correlation procedures are available to interested readers upon request. Three-dimensional reconstruction and rendering. Tilt series were aligned and reconstructed using IMOD. Gold beads added to the sample before plunge freezing were used as fiducial markers to align the tilt series. Reconstruction was performed using a simultaneous iterative reconstruction technique with 5 or 15 iterations. A fraction of the data collected was discarded during reconstruction for technical reasons: for Tecnai F20, ∼50% of the data were discarded because of such issues as stage drift, beam blockade at high tilt angles, and occasional autofocus failure; for Titan Krios,
📊 Figures
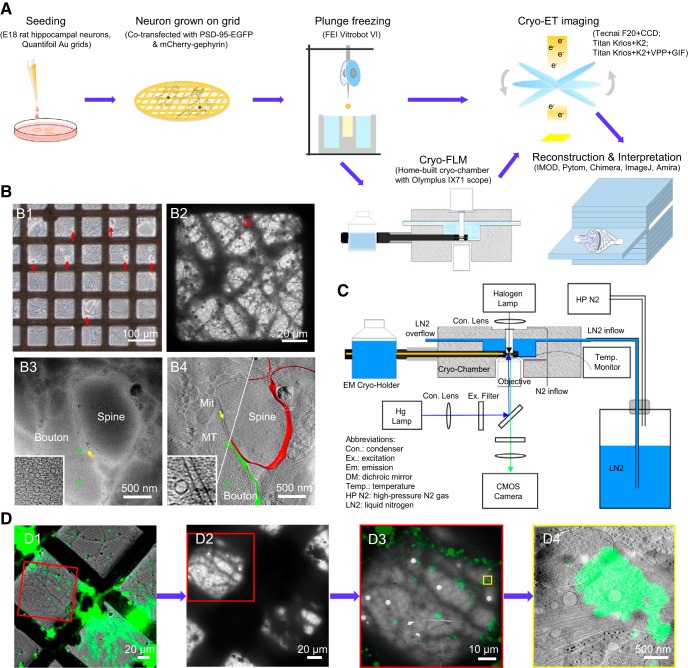
Figure 1.
Imaging primary rat hippocampal neurons with cryo-ET/cryo-CLEM. A , Illustration of the workflow of cryo-ET/cryo-CLEM imaging of neurons grown on gold EM grids. B , Representative results from differe...
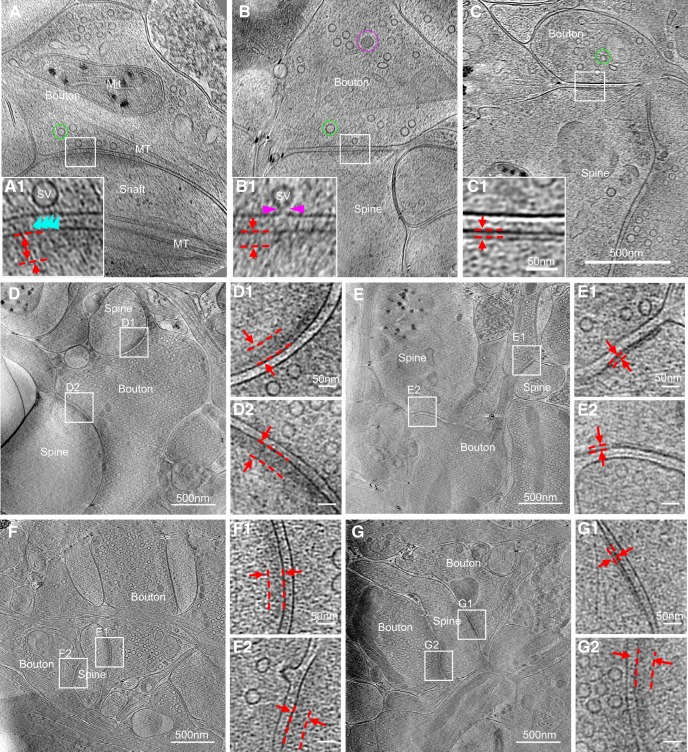
Figure 2.
Synapses of various sizes, shapes, and ultrastructural details imaged with cryo-ET. Au2013C , Three tomographic slices showing structures of different synapses. In the synapses, structures, such as SV...
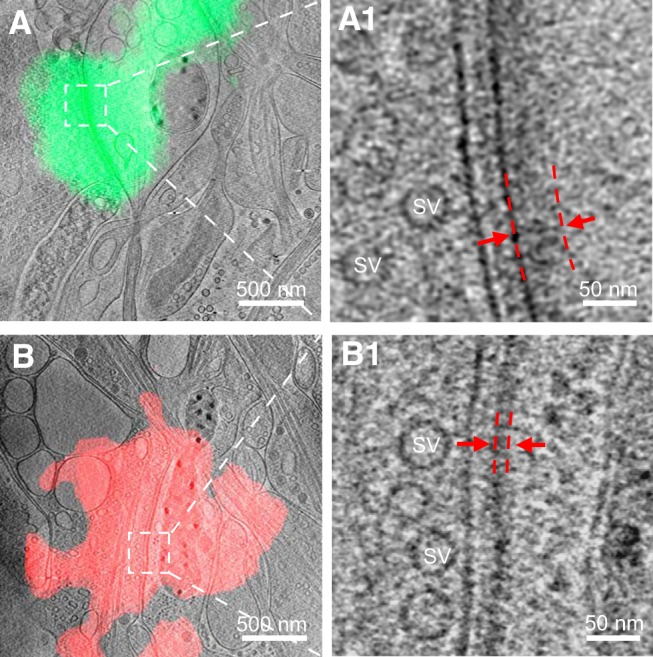
Figure 3.
Identification of excitatory and inhibitory synapses with cryo-CLEM. A , B , Tomographic slices of an excitatory ( A ) and inhibitory ( B ) synapse colocalized with PSD-95-EGFP and mCherry-gephyrin pu...
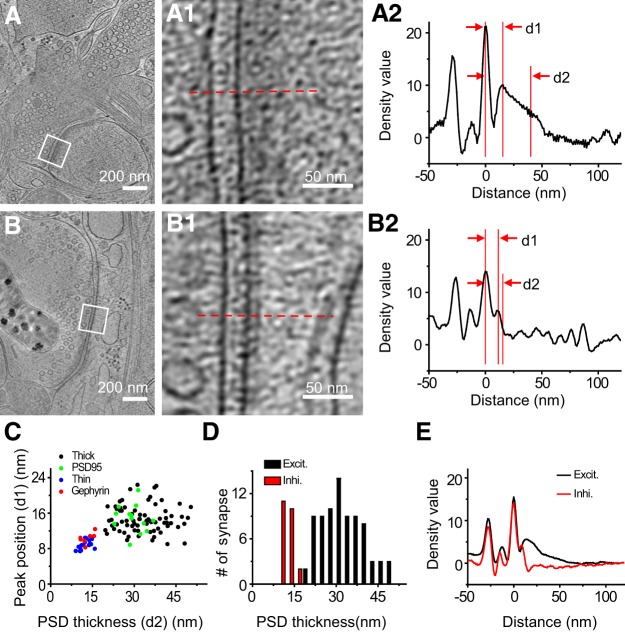
Figure 4.
Quantitative and statistical characterization of excitatory and inhibitory PSDs. A , B , Tomographic slices of two synapses with thick and thin PSD respectively. A1 , B1 , Zoomed-in views of the marke...
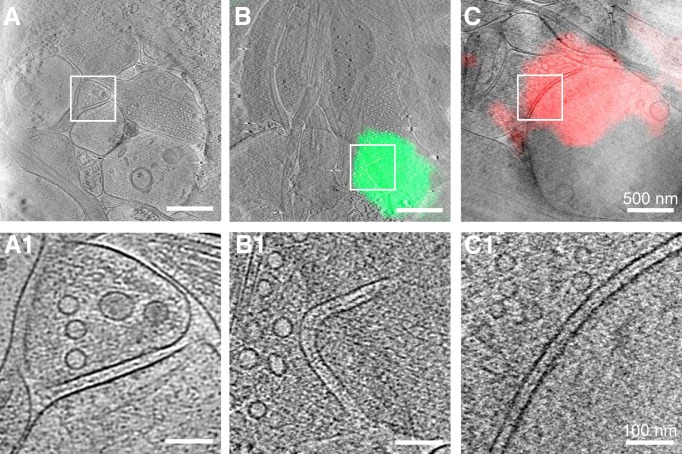
Figure 5.
Synapses without visible PSDs. A , A 15-nm-thick tomographic slice of an unidentified synapse imaged by cryo-ET only. B , C , A 15-nm-thick tomographic slice of an excitatory ( B ) and an inhibitory (...
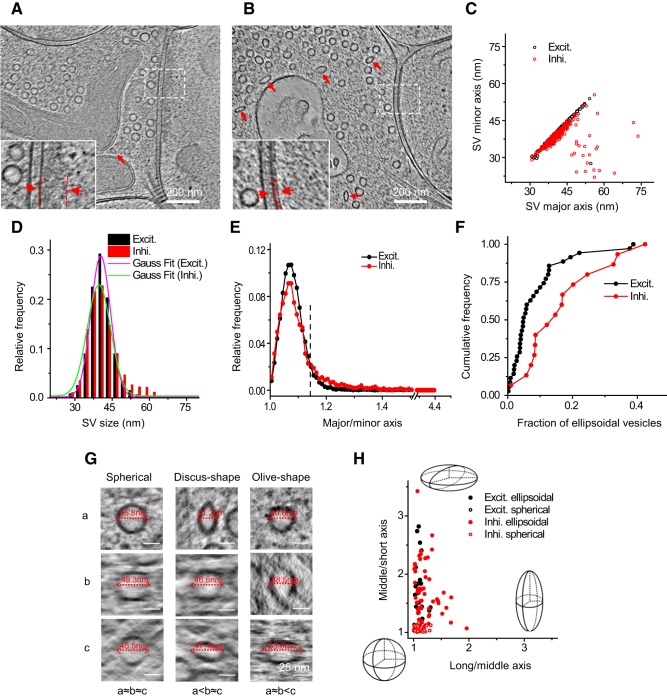
Figure 6.
Heterogeneity of synaptic vesicles in excitatory and inhibitory synapses. A , B , Tomographic slices of an excitatory and an inhibitory synapse respectively. Insets are zoomed-in views showing thick a...
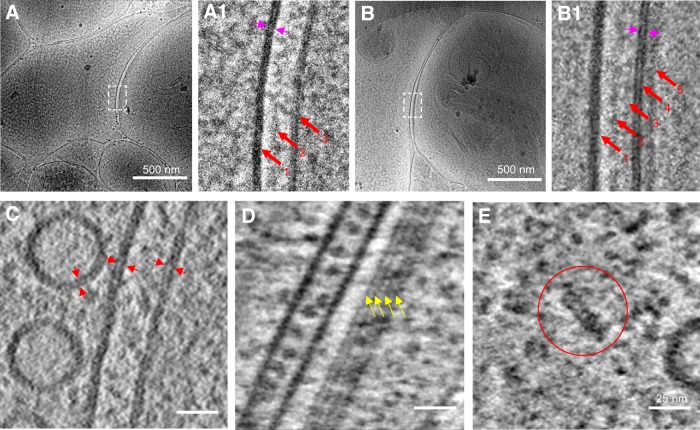
Figure 7.
High-resolution cryo-ET of synapses obtained using VPP, electron energy filter, and direct electron detection. A , B , Single-projection cryo-EM images of an excitatory and inhibitory synapse respecti...
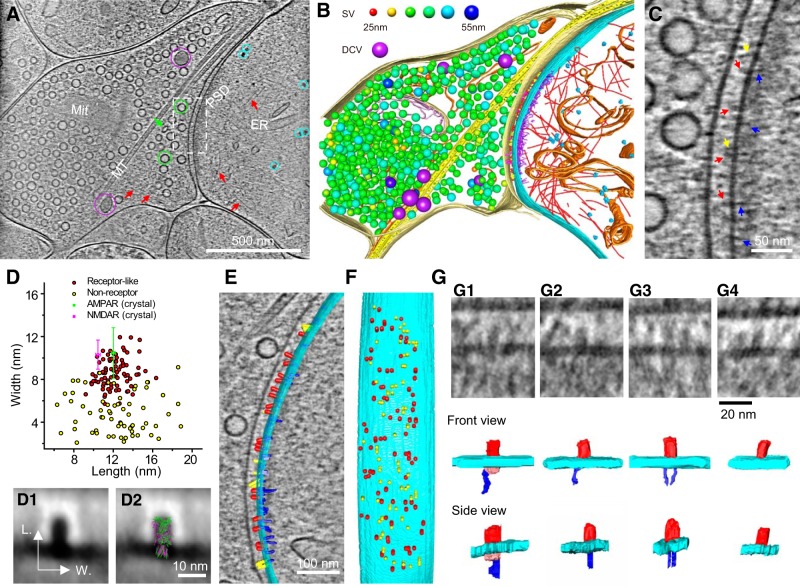
Figure 8.
Putative receptors and scaffolding proteins in an excitatory synapse. A , An 8.7-nm-thick tomographic slice of an excitatory synapse. Circles: SVs (green), DCVs (purple), ribosome-like structures (cya...
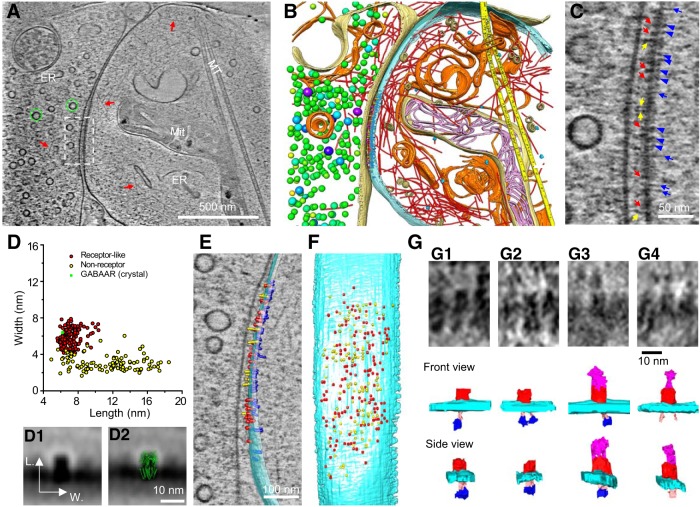
Figure 9.
Putative receptors and scaffolding proteins in an inhibitory synapse. A , An 8.7-nm-thick tomographic slice of an inhibitory synapse. Green circles, SVs; red arrows, actin filaments; ER, endoplasmic r...
Figure images are served from the NIH/NLM PubMed Central Open Access Subset or Europe PMC; copyright remains with the publishers and authors.
💬 Discussion
0 commentsNo comments yet. Be the first to start a discussion!
Leave a Comment