Abstract
AbstractIn eukaryotic cells, one-third of all proteins must be transported across or inserted into the endoplasmic reticulum (ER) membrane by the ER protein translocon. The translocon-associated protein (TRAP) complex is an integral component of the translocon, assisting the Sec61 protein-conducting channel by regulating signal sequence and transmembrane helix insertion in a substrate-dependent manner. Here we use cryo-electron tomography (CET) to study the structure of the native translocon in evolutionarily divergent organisms and disease-linked TRAP mutant fibroblasts from human patients. The structural differences detected by subtomogram analysis form a basis for dissecting the molecular organization of the TRAP complex. We assign positions to the four TRAP subunits within the complex, providing insights into their individual functions. The revealed molecular architecture of a central translocon component advances our understanding of membrane protein biogenesis and sheds light on the role of TRAP in human congenital disorders of glycosylation.
🔬 Techniques
🔭 Microscopes
🧬 Organisms
💻 Software
✨ Fluorophores
🧪 Sample Preparation
🔬 Cell Lines
🏭 Microscope Brands
🧪 Reagent Suppliers
💻 Software Details
💾 Data Repositories
🏛️ Research Organizations (ROR)
Affiliated research institutions:
📋 Methods
Cell culture
Human fibroblasts . Primary fibroblasts from SSR4-CDG and SSR3-CDG patients were used with permission following informed consent. Dr Charles Marques Lourenço provided the cells from the SSR3-CDG patient. TRAPγ-deficient cells (CDG359), TRAPδ-deficient cells (CDG406) and control fibroblasts (GM0038, from the Coriell Institute) were cultured in DMEM 1 g per L glucose with L -glutamine and sodium pyruvate (HyClone, GE Healthcare, Freiburg, Germany) containing 10% FBS (Sigma-Aldrich, Taufkirchen, Germany) and 1% penicillin and streptomycin (Gibco, Thermo Fisher Scientific, Darmstadt, Germany) in a humidified environment with 5% CO 2 at 37 °C. None of the cell lines used in this study are listed in the database of commonly misidentified cell lines maintained by ICLAC. All cell lines have been tested for mycoplasma contamination. All cell lines used in this study have been either acquired directly from patients or obtained from the Coriell Institute, which maintains strict verification of cell lines. C. reinhardtii cells . C. reinhardtii mat3-4 cells (Chlamydomonas Resource Center, Univ. of Minnesota) 32 were cultured in Tris-acetate-phosphate (TAP) medium with constant light and aeration with normal atmosphere. Cells were harvested at early- to mid-log growth phase and diluted to ∼1,000 cells per μl in fresh TAP prior to vitrification. Preparation of microsomes from patient primary fibroblasts Cells (20–40 × 10 6 ) were collected and successively washed with PBS and HEPES buffer (50 mM HEPES/KOH pH 7.5; 0.25 M sucrose; 50 mM KOAc; 6 mM MgOAc; 4 mM PMSF; 1 mM EDTA; 1 mM DTT; 0.1 mg ml −1 cycloheximide; 0.3 U ml −1 RNAsin (Promega, Heidelberg, Germany); protease inhibitor cocktail). Next, cells were homogenized in HEPES buffer with a glass/Teflon homogenizer, and the resulting lysate was cleared by two consecutive centrifugation steps (1,000 g for 10 min and 10,000 g for 10 min). The resulting supernatant was layered onto a 0.6 M sucrose cushion (50 mM HEPES/KOH pH 7.5; 0.6 M sucrose; 100 mM KOAc; 5 mM MgOAc; 4 mM DTT; 0.1 mg ml −1 cycloheximide; 40 U ml −1 RNAsin) to pellet membrane vesicles (230,000 g for 90 min), which were subsequently resuspended in HEPES buffer and stored at −80 °C. All steps after the first washing step were carried out on ice.
Show full methods section
Cell culture
Human fibroblasts . Primary fibroblasts from SSR4-CDG and SSR3-CDG patients were used with permission following informed consent. Dr Charles Marques Lourenço provided the cells from the SSR3-CDG patient. TRAPγ-deficient cells (CDG359), TRAPδ-deficient cells (CDG406) and control fibroblasts (GM0038, from the Coriell Institute) were cultured in DMEM 1 g per L glucose with L -glutamine and sodium pyruvate (HyClone, GE Healthcare, Freiburg, Germany) containing 10% FBS (Sigma-Aldrich, Taufkirchen, Germany) and 1% penicillin and streptomycin (Gibco, Thermo Fisher Scientific, Darmstadt, Germany) in a humidified environment with 5% CO 2 at 37 °C. None of the cell lines used in this study are listed in the database of commonly misidentified cell lines maintained by ICLAC. All cell lines have been tested for mycoplasma contamination. All cell lines used in this study have been either acquired directly from patients or obtained from the Coriell Institute, which maintains strict verification of cell lines. C. reinhardtii cells . C. reinhardtii mat3-4 cells (Chlamydomonas Resource Center, Univ. of Minnesota) 32 were cultured in Tris-acetate-phosphate (TAP) medium with constant light and aeration with normal atmosphere. Cells were harvested at early- to mid-log growth phase and diluted to ∼1,000 cells per μl in fresh TAP prior to vitrification. Preparation of microsomes from patient primary fibroblasts Cells (20–40 × 10 6 ) were collected and successively washed with PBS and HEPES buffer (50 mM HEPES/KOH pH 7.5; 0.25 M sucrose; 50 mM KOAc; 6 mM MgOAc; 4 mM PMSF; 1 mM EDTA; 1 mM DTT; 0.1 mg ml −1 cycloheximide; 0.3 U ml −1 RNAsin (Promega, Heidelberg, Germany); protease inhibitor cocktail). Next, cells were homogenized in HEPES buffer with a glass/Teflon homogenizer, and the resulting lysate was cleared by two consecutive centrifugation steps (1,000 g for 10 min and 10,000 g for 10 min). The resulting supernatant was layered onto a 0.6 M sucrose cushion (50 mM HEPES/KOH pH 7.5; 0.6 M sucrose; 100 mM KOAc; 5 mM MgOAc; 4 mM DTT; 0.1 mg ml −1 cycloheximide; 40 U ml −1 RNAsin) to pellet membrane vesicles (230,000 g for 90 min), which were subsequently resuspended in HEPES buffer and stored at −80 °C. All steps after the first washing step were carried out on ice.
Semi-quantitative western blot analysis
Western blots were scanned and analysed using the Typhoon-Trio imaging system (GE Healthcare) and the Image Quant TL software 7.0 (GE Healthcare). The primary antibodies were visualized using ECL Plex goat anti-rabbit IgG-Cy5 conjugate or ECL Plex goat antimouse IgG-Cy3 conjugate (GE Healthcare, Freiburg, Germany). Supplementary Table 1 lists primary antibodies used in this study. Full Western blot scans are shown in Supplementary Fig. 4 .
EM grid preparation and data acquisition
Rough microsomes . Rough microsomes from patient fibroblasts were diluted using ribosome buffer (20 mM Hepes, pH 7.6; 50 mM KCl; 2 mM MgCl 2 ) and 3 μl were applied to lacey carbon molybdenum grids (Ted Pella, USA). After an incubation time of 60 s at 22 °C, 3 μl of 10-nm colloidal gold in ribosome buffer were added to the grid and the sample was vitrified in liquid ethane using a Vitrobot Mark IV (FEI Company, The Netherlands). Tilt series were acquired using a FEI Titan Krios transmission electron microscope (TEM) equipped with a K2 Summit direct electron detector (Gatan, USA), operated in movie mode with 4–7 frames per projection image (exposure time 0.8–1.4 s). The TEM was operated at an acceleration voltage of 300 kV, a nominal defocus of 3–4 μm and an object pixel size of 2.62 Å. Single-axis tilt series were recorded from −60° to +60° (first half: −20° to +60°; second half; −22° to −60°) with an angular increment of 2° and a cumulative electron dose of 90–100 electrons per Å 2 using the SerialEM acquisition software 33 . C. reinhardtii cells . Cells were vitrified by plunge-freezing with a Vitrobot Mark IV and thinned by focused ion beam milling with either an FEI Quanta or FEI Scios dual-beam microscope. After coating the samples with platinum, cells were thinned by scanning gallium ions from both sides in a stepwise fashion to produce final cellular sections that were 100–200 nm thick 28 34 . Milled samples were transferred to a 300 kV FEI Titan Krios TEM and imaged with a K2 Summit detector operated in movie mode at 12 frames per second. Using SerialEM 33 , single-axis tilt series were acquired at 2° angular increments from approximately −60° to +60° (in two halves separated at either −20° or 0°), with an object pixel size of 3.42 Å and a cumulative electron dose of 70–120 electrons per Å 2 .
Tomogram reconstruction
Rough microsomes . In-house developed frame alignment software based on the algorithm described in ref. 35 was used for correction of beam-induced motion in electron micrographs acquired with the K2 direct electron detector. Phase reversals resulting from the contrast transfer function were corrected in single projections with MATLAB and PyTom 36 using strip-based periodogram averaging 37 . Interactively located gold markers were used for tilt series alignment, and tomograms were reconstructed in PyTom 36 by weighted back projection (binned object pixel: 2.1 nm). C. reinhardtii cells . Frames from the K2 direct electron detector were aligned as described above. Tilt series alignment by patch tracking, contrast transfer function correction of phase reversals and tomogram reconstruction by weighted back projection (binned object pixel: 1.37 nm) were performed in IMOD 38 .
Subtomogram analysis
Candidate particles were located in the tomograms by template matching in PyTom 36 against single-particle cryo-EM reconstructions of human 39 (rough microsomes) or wheat germ 40 ( C. reinhardtii cells) 80S ribosomes filtered to 50 Å resolution. For the 500 highest-scoring peaks of the cross correlation function, subtomograms were extracted from the tomograms and subsequently classified using constrained principal component analysis (CPCA) 41 focused on the ER membrane and the large ribosomal subunit. This allowed separation of ER membrane-associated ribosomes from non-membrane-bound ribosomes and most false-positive matches. The remaining subtomograms were reconstructed at full spatial sampling either with PyTom (rough microsomes: 220 3 voxels, object pixel: 0.262 nm) or with IMOD ( C. reinhardtii cells: 192 3 voxels, object pixel: 0.342 nm) and iteratively aligned using PyTom 36 . Subsequently, CPCA focused on the translocon was used to separate ribosomes bound to the OST-containing translocon from ribosomes bound to the OST-lacking translocon, remaining non-membrane-bound ribosomes and false positives. For the TRAPδ-deficient fibroblasts, a third round of CPCA focused on the TRAP complex separated ribosomes bound to the TRAP-containing translocon from ribosomes bound to the TRAP-lacking translocon. The number of subtomograms used for averaging in each dataset is noted in Supplementary Fig. 1 . For all data sets, Fourier shell correlation of two maps derived from each half of the data (FSC=0.5) and Fourier shell cross resolution (FSC=0.33) against a cryo-EM single particle reconstruction of the human (rough microsomes) 39 or wheat germ ( C. reinhardtii cells) 40 80S ribosome were used to assess the resolution of the subtomogram averages.
Analysis of EM densities The UCSF
Chimera software package 42 was used for EM map analysis, fitting of atomic models, segmentation and visualization. For computation of difference density maps, the two EM densities were filtered to the same resolution (TOM/av3), aligned onto each other (Chimera), interpolated on a common reference system (Chimera), normalized according to the density mean and density standard deviation (TOM/av3), and subtracted from each other (TOM/av3). Due to the heterogeneous OST occupancy on the ER membrane-associated ribosome from C. reinhardtii cells, the OST region was masked out from both EM densities before computing the difference density, in this case. Segmentation of the ER membrane in Fig. 4a was performed in Amira software (FEI Visualization Sciences Group), guided by a tensor voting algorithm 43 .
Data availability
Subtomogram averages of the ER membrane-associated ribosome from human TRAPδ- or TRAPγ-deficient fibroblasts and C. reinhardtii cells have been deposited in the EMDataBank with accession codes EMD-4143, EMD-4144 and EMD-4145, respectively. All the remaining data are available from the corresponding authors upon reasonable request. Previously published electron microscopy densities (EMD-3068, EMD-5592, EMD-1780) and atomic models (PDB 5EUL) were used in this study.
Supplementary Material Supplementary Information Supplementary figures, supplementary table and supplementary references. Supplementary Movie 1 Overall structure of TRAP in the native mammalian translocon. The movie shows isolated densities for the mammalian ribosome (grey), the Sec61 protein-conducting channel (blue), TRAP (green) and OST (red). Atomic models for Sec61 (blue), rpL38 (magenta) and an rRNA ES (yellow) are superimposed on the EM density. Interfaces between TRAP, Sec61 and OST are indicated when the structure rotates to suitable perspectives. Supplementary Movie 2 The movie shows difference densities originating from the TRAPδ-deficient fibroblast translocon (blue mesh) and the algal translocon (red mesh) mapped back on the isolated density of the TRAP complex (transparent green). The interface between TRAP and OST is indicated. Approximate positions of the individual TRAP subunits are illustrated at the end of the movie. Coloring matches Supplementary Movie 1. Peer review file
📊 Figures
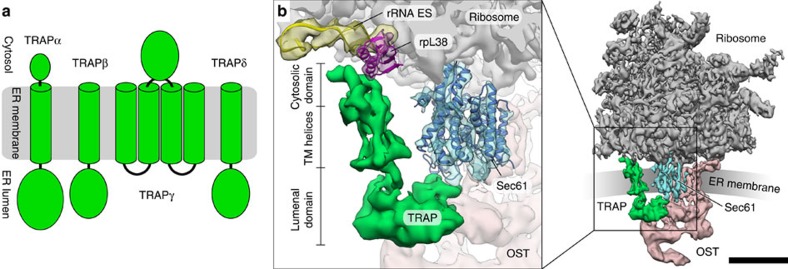
Figure 1
Overall structure and subunit composition of the mammalian TRAP complex.
( a ) TRAP subunit composition and membrane topology as predicted by bioinformatic analysis. ( b ) Isolated densities for the mammalian ribosome (grey), the Sec61 protein-conducting channel (blue), TR...
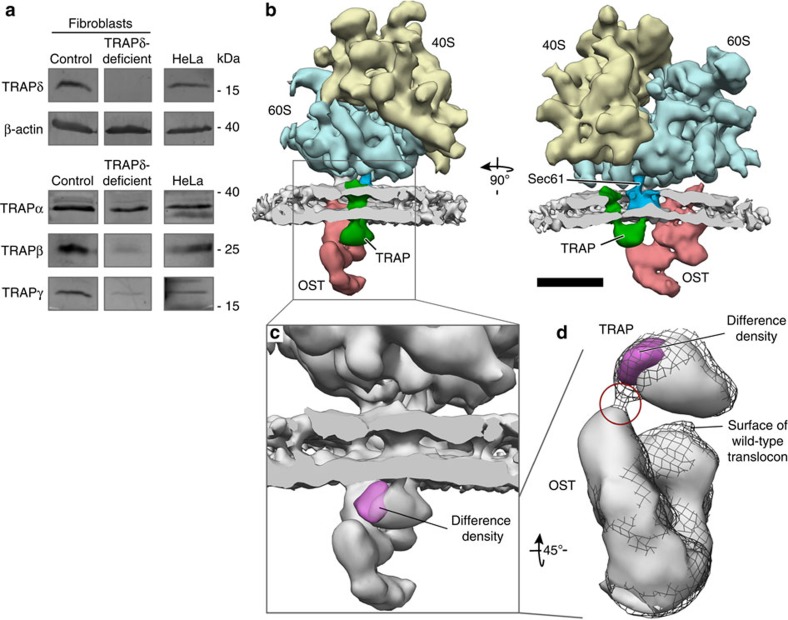
Figure 2
TRAPu03b4 is located at the TRAP-OST interface.
( a ) Western blot analysis of control and TRAPu03b4-deficient patient primary fibroblasts. HeLa cells were used as positive control for the TRAP antibodies. Please note that bands for HeLa cells and ...
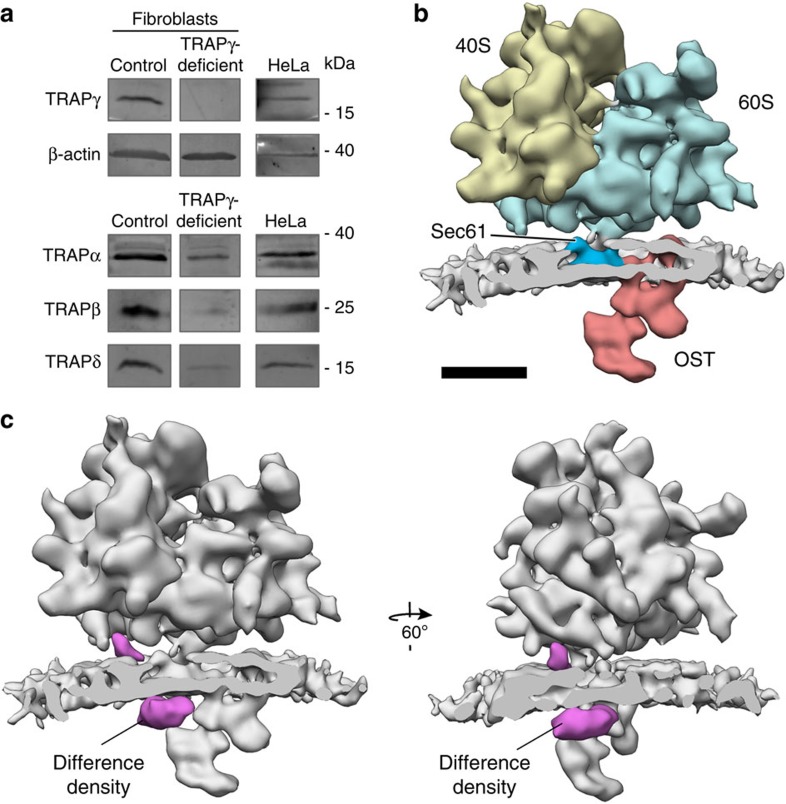
Figure 3
TRAP is destabilized in TRAPu03b3-deficient patient fibroblasts.
( a ) Western blot analysis of control and TRAPu03b3-deficient patient primary fibroblasts. HeLa cells were used as positive control for the TRAP antibodies. Please note that bands for HeLa cells and ...
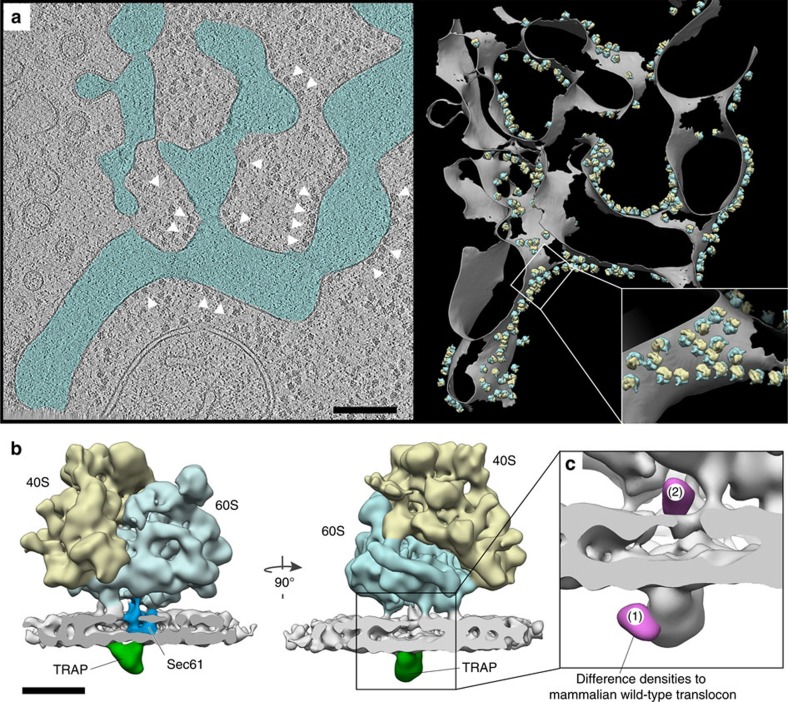
Figure 4
Structure of an algal translocon reveals the positions of TRAPu03b3 and TRAPu03b4.
( a ) Left: slice through a representative tomogram from a FIB-milled vitreous C. reinhardtii cell, depicting a section of the native rough ER network (blue). White arrowheads point to exemplary ER-as...
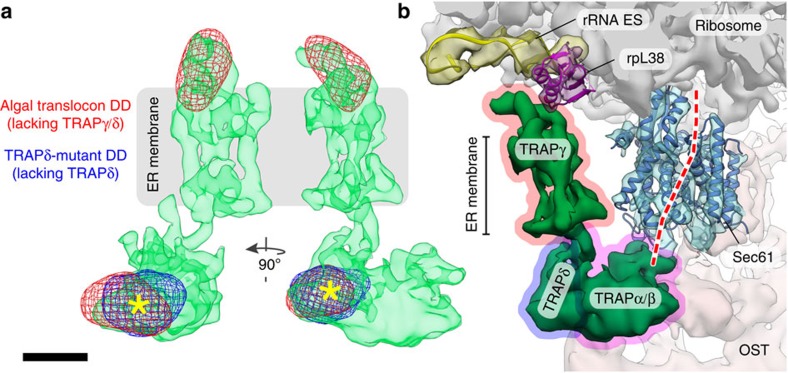
Figure 5
Dissecting the molecular organization of the TRAP complex.
( a ) Set of difference densities (DD) originating from the TRAPu03b4-deficient fibroblast translocon (blue mesh) and the algal translocon (red mesh) mapped back on the isolated density of the TRAP co...
Figure images are served from the NIH/NLM PubMed Central Open Access Subset or Europe PMC; copyright remains with the publishers and authors.
💬 Discussion
0 commentsNo comments yet. Be the first to start a discussion!
Leave a Comment