Abstract
Desmosomes are adhesive junctions composed of two desmosomal cadherins: desmocollin (Dsc) and desmoglein (Dsg). Previous studies demonstrate that E-cadherin (Ecad), an adhesive protein that interacts in both trans (between opposing cells) and cis (on the same cell surface) conformations, facilitates desmosome assembly via an unknown mechanism. Here we use structure-function analysis to resolve the mechanistic roles of Ecad in desmosome formation. Using AFM force measurements, we demonstrate that Ecad interacts with isoform 2 of Dsg via a conserved Leu-175 on the Ecad cis binding interface. Super-resolution imaging reveals that Ecad is enriched in nascent desmosomes, supporting a role for Ecad in early desmosome assembly. Finally, confocal imaging demonstrates that desmosome assembly is initiated at sites of Ecad mediated adhesion, and that Ecad-L175 is required for efficient Dsg2 and desmoplakin recruitment to intercellular contacts. We propose that Ecad trans interactions at nascent cell-cell contacts initiate the recruitment of Dsg through direct cis interactions with Ecad which facilitates desmosome assembly.
🔬 Techniques
🔭 Microscopes
💻 Software
✨ Fluorophores
🧪 Sample Preparation
🔬 Cell Lines
🏭 Microscope Brands
🧪 Reagent Suppliers
🔎 Objectives
💻 Software Details
💾 Data Repositories
🏛️ Research Organizations (ROR)
Affiliated research institutions:
📋 Methods
Purification of cadherin ectodomains
The generation of HEK293T cells stably expressing Ecad WT and Ecad W2A-K14E fused to a C-terminal Avi-tag and His-tag have been described previously ( Rakshit et al., 2012 ; Zhang et al., 2009 ).
Plasmids for full length
Dsc2 and Dsg2 ectodomains fused to a C-terminal Avi-tag and His-tag were a kind gift from Prof. W. James Nelson (Stanford University) while HEK293T cells stably expressing full-length Ecad mutant L175D fused to a C-terminal Avi-tag and His-tag were a kind gift from Dr. Yunxiang Zhang (Stanford University). As described previously ( Lowndes et al., 2014 ), the Dsc2 and Dsg2 plasmids were transiently transfected into HEK 293 T cells using lipofactamine 2000 (Life Technologies) following the manufacturer’s protocol. Two days post transfection, the conditioned media was collected for protein purification. The transfected cells expressing WT/mutant Ecads were grown to confluence in DMEM containing 10% FBS and 200 µg/ml of Genecitin (G418; Invitrogen) and exchanged into serum free DMEM with 400 µg/ml of Genecitin. Conditioned media was collected 4 days after media exchange. Purification and biotinylation of His-tagged Dsc2, Dsg2, Ecad WT, W2A-K14E, and L175D followed a protocol that has been described previously ( Lowndes et al., 2014 ; Rakshit et al., 2012 ; Zhang et al., 2009 ). Media containing cadherin was incubated overnight, at 4°C, with Ni NTA agarose beads (Qiagen). The beads were loaded onto a glass chromatography column (BioRad) and washed with buffer at pH 7.5 (20 mM NaH 2 PO 4 , 500 mM NaCl and 1 mM CaCl 2 ) containing 50 mM imidazole. The bound protein was eluted with the same buffer containing 250 mM imidazole. Following purification, the protein was exchanged into a pH 7.5 buffer containing 25 mM Hepes, 5 mM NaCl, and 1 mM CaCl 2 and biotinylated with BirA enzyme (BirA500 kit; Avidity). After biotinylation for 1 hr at 30°C, free biotins were removed using either a spin column (Millipore) or superdex 200 10/300 GL column.
Show full methods section
Purification of cadherin ectodomains
The generation of HEK293T cells stably expressing Ecad WT and Ecad W2A-K14E fused to a C-terminal Avi-tag and His-tag have been described previously ( Rakshit et al., 2012 ; Zhang et al., 2009 ).
Plasmids for full length
Dsc2 and Dsg2 ectodomains fused to a C-terminal Avi-tag and His-tag were a kind gift from Prof. W. James Nelson (Stanford University) while HEK293T cells stably expressing full-length Ecad mutant L175D fused to a C-terminal Avi-tag and His-tag were a kind gift from Dr. Yunxiang Zhang (Stanford University). As described previously ( Lowndes et al., 2014 ), the Dsc2 and Dsg2 plasmids were transiently transfected into HEK 293 T cells using lipofactamine 2000 (Life Technologies) following the manufacturer’s protocol. Two days post transfection, the conditioned media was collected for protein purification. The transfected cells expressing WT/mutant Ecads were grown to confluence in DMEM containing 10% FBS and 200 µg/ml of Genecitin (G418; Invitrogen) and exchanged into serum free DMEM with 400 µg/ml of Genecitin. Conditioned media was collected 4 days after media exchange. Purification and biotinylation of His-tagged Dsc2, Dsg2, Ecad WT, W2A-K14E, and L175D followed a protocol that has been described previously ( Lowndes et al., 2014 ; Rakshit et al., 2012 ; Zhang et al., 2009 ). Media containing cadherin was incubated overnight, at 4°C, with Ni NTA agarose beads (Qiagen). The beads were loaded onto a glass chromatography column (BioRad) and washed with buffer at pH 7.5 (20 mM NaH 2 PO 4 , 500 mM NaCl and 1 mM CaCl 2 ) containing 50 mM imidazole. The bound protein was eluted with the same buffer containing 250 mM imidazole. Following purification, the protein was exchanged into a pH 7.5 buffer containing 25 mM Hepes, 5 mM NaCl, and 1 mM CaCl 2 and biotinylated with BirA enzyme (BirA500 kit; Avidity). After biotinylation for 1 hr at 30°C, free biotins were removed using either a spin column (Millipore) or superdex 200 10/300 GL column.
Single molecule AFM force measurements
Purified cadherins were immobilized on coverslips (CS) and AFM cantilevers (Olympus, model TR400PSA) using a previously described method ( Manibog et al., 2016 ). Briefly, the CS and cantilevers were cleaned with 25% H 2 O 2 :75% H 2 SO 4 and washed with DI water. The CS was then cleaned with 1 M KOH and washed with DI water. Both the CS and cantilevers were washed with acetone and functionalized using 2% (v/v) 3-aminopropyltriethoxysilane (Sigma) dissolved in acetone. Next, N-hydroxysuccinimide ester functionalized PEG spacers (MW 5000, Lysan Bio) were covalently attached to the silanized AFM tip and coverslip; 7% of the PEG spacers were decorated with biotin groups. Prior to a measurement, the functionalized AFM cantilever and coverslip were incubated overnight with BSA (1 mg/ml) to further reduce non-specific binding. The tip and surface were then incubated with 0.1 mg/ml streptavidin for 30 min and biotinylated cadherins were attached to the streptavidin. Finally, the surfaces were incubated with 0.02 mg/ml biotin for 10 min to block the free biotin binding sites on streptavidin. Force measurements were performed using an Agilent 5500 AFM with a closed loop scanner. The spring constants of the cantilevers were measured using the thermal fluctuation method ( Hutter and Bechhoefer, 1993 ). All the experiments were performed in a pH 7.5 buffer containing 10 mM Tris-HCl, 100 mM NaCl and 10 mM KCl with either 2.5 mM Ca 2+ or 2 mM EGTA. The region of PEG stretching in each unbinding force curve was fit to an extended freely jointed chain model using a total least squares fitting protocol. The contour length L c of the PEG tethers was determined from the fits. The histogram of L c for each experiment was fit to a Gaussian distribution and only force curves that had an L c within one standard deviation from the center were accepted for further analysis. Loading rates were calculated as described elsewhere ( Ray et al., 2007 ). K-means clustering method was used to group loading rates ( Yen and Sivasankar, 2018 ). Mean force F * and mean loading rate r f were calculated for each group and plots of F * vs. r f were fit using nonlinear least-squares fitting with bisquare weights to the Bell-Evans model ( Bell, 1978 ; Evans and Ritchie, 1997 ) . Confidence intervals (CIs) for k o f f 0 and x β were determined using bootstrap-with-replacement, as described previously ( Yen et al., 2016 ). SIM imaging and analysis of cadherin localization within desmosomes Primary human keratinocytes (HKs, passage 2) were isolated from neonatal foreskin as previously described ( Calkins et al., 2006 ) and cultured in KBM-Gold basal medium (100 µM calcium) supplemented with KGM-Gold Single-Quot Kit (Lonza, Walkersville, MD). HKs were cultured to 70% confluence on glass coverslips, switched to 550 µM calcium to induce junction assembly for the various time points indicated and then processed for structured illumination microscopy (SIM) as described below. HKs were fixed in methanol and immunostained with primary antibodies for 1 hr and secondary antibodies for 30 min, both at 37°C. The following primary antibodies were used in the SIM experiments: mouse anti-Ecad antibody (HECD-1, Abcam); rat anti-uvomorulin (DECMA-1, Sigma); mouse anti-Dsg2 antibody (AH12.2, a kind gift from Dr. Asma Nusrat, Emory University); desmoplakin antibody (NW6, a kind gift from Dr. Kathleen Green, Northwestern University). Secondary antibodies conjugated to Alexa Fluorophore were purchased from Invitrogen. SIM was performed using the Nikon N-SIM system on an Eclipse Ti-E microscopy system equipped with a 100x/1.49 NA oil immersion objective and 488 and 561 nm solid-state lasers. 3D SIM images were captured with an EM charge-coupled device camera (DU-897, Andor Technology) and reconstructed using NIS-Elements software with the N-SIM module (version 3.22, Nikon). SIM is able to resolve the distance from plaque to plaque when desmosomes are stained with a C-terminal DP antibody and an N-terminal cadherin antibody, as shown in the example SIM image ( Figure 3A ). For analysis of cadherin localization within desmosomes, desmosomes were first defined by regions of parallel DP staining, or ‘railroad tracks’. Using ImageJ, a desmosome region of interest (black rectangle) was identified via DP staining ( Figure 3A ). Once a DP and ‘railroad track’-positive region of interest was identified, cadherin (red) fluorescence intensity levels were then independently measured along with DP (green) levels. Pairwise multiple comparisons were performed via a Tukey test with a significance level of α = 0.05. Isolation, culture, transfection and confocal imaging of primary keratinocytes Spontaneously immortalized primary keratinocytes, isolated from newborn mice, were cultured in DMEM/HAM’s F12 (FAD) medium with low Ca 2+ (50 μM) (Biochrom) supplemented with 10% FCS (chelated), penicillin (100 U ml −1 ), streptomycin (100 μg ml −1 , Biochrom A2212), adenine (1.8 × 10 −4 M, Sigma A3159), L-glutamine (2 mM, Biochrom K0282), hydrocortisone (0.5 μg ml −1 , Sigma H4001), EGF (10 ng ml −1 , Sigma E9644), cholera enterotoxin (10 −10 M, Sigma C-8052), insulin (5 μg ml −1 , Sigma I1882), and ascorbic acid (0.05 mg ml −1 , Sigma A4034). Keratinocytes were kept at 32°C and 5% CO 2 . Ecad KO /Pcad KD cells were generated by lentiviral transduction of Ecad-deficient keratinocytes using C14 shRNA directed against Pcad ( Michels et al., 2009 ). Cultured cells were regularly monitored for mycoplasma contamination and discarded in case of positive results. Cellular identity was validated by PCR genotyping from genomic DNA and western blot analysis of Dsg 1-2 as markers for keratinocyte identity. In addition, loss of Ecad and efficient knockdown of Pcad was confirmed on the RNA level by RT-PCR as well as on the protein level through western blot analysis. Ecad-K14E and Ecad-L175D mutants were generated using WT mouse Ecad cDNA in a pcDNA3 backbone including a C-terminal 6myc-tag. Mutations were carried out using ‘QuikChange Lightning Site-Directed Mutagenesis Kit’ (Agilent). Keratinocytes were transfected at 80–100% confluency with ViromerRed (lipocalyx) according to the manufacturer’s protocol. In brief 1.5 µg DNA were diluted in 100 µl Buffer, added to 1.25 µl ViromerRED and incubated for 15 min at room temperature. Approximately 33 µl transfection mix were used per well (24 well plate). Confocal images were obtained with a Leica TCS SP8, equipped with a white light laser and gateable hybrid detectors (HyDs) and a PlanApo 63x, 1.4 NA objective. Epifluorescence images were obtained with a Leica DMI6000 with a PlanApo 63x, 1.4 NA objective. The following primary antibodies were used in this study: rabbit monoclonal against Dsg2 (1:500, Abcam #ab150372); mouse monoclonal against DP1/2 (1:200, Progen #61003); mouse monoclonal against c-myc (IF 1:2000, Cell Signaling #2276); Secondary antibodies were species-specific antibodies conjugated with either AlexaFluor 488, 594 or 647, used at a dilution of 1:500 for immunofluorescence (Molecular Probes, Life Technologies)
Additional files 10.7554/eLife.37629.010 Transparent reporting form Data availability All data generated or analyzed during this study are included in the manuscript and supporting files.
📊 Figures
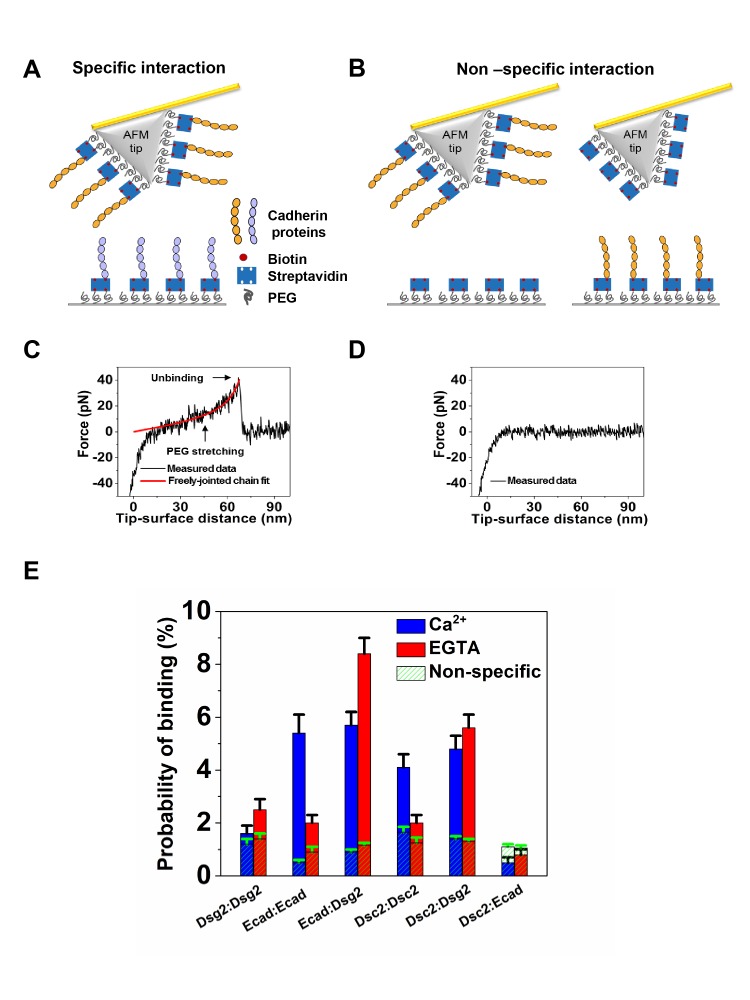
Figure 1.
Ecad interacts with Dsg2 to form Ca 2+ -independent dimers.
( A ) Schematic of specific interaction experiment.u00a0The AFM tip and substrate were functionalized with PEG linkers some of which were decorated with streptavidins. Biotinylated cadherin proteins w...
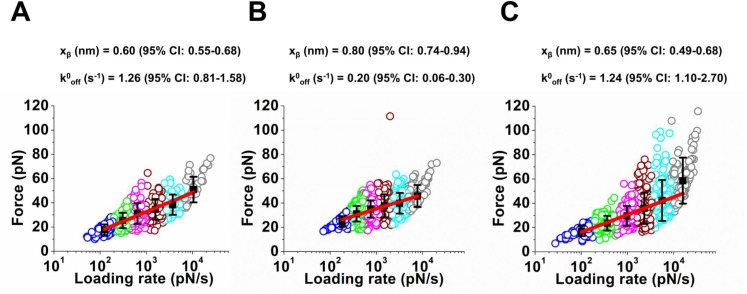
Figure 2.
Lifetimes of the Ecad/Dsg2 dimer and the Dsc2/Dsc2 dimer are shorter than the lifetime of the Dsg2/Dsc2 complex.
Loading rates of the rupture events measured in Ca 2+ at six different pulling velocities were grouped using K-means clustering method.u00a0Each clustered loading rate is shown by a different color, w...
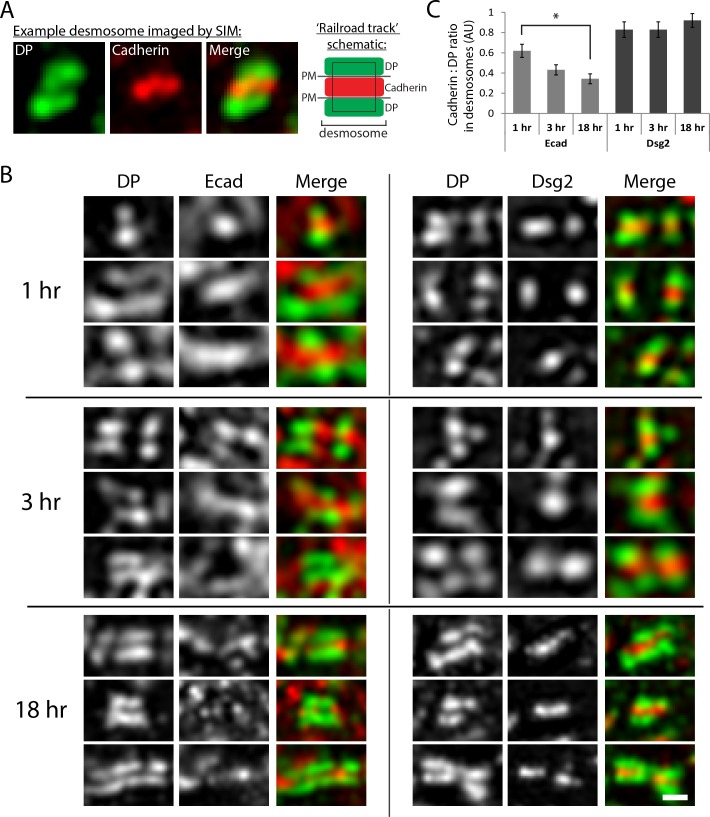
Figure 3.
Ecad and Dsg2 are both localized in nascent desmosomes.
( A ) Analysis of cadherin localization within desmosomes. Structured illumination microscopy (SIM) is able to resolve the distance from plaque to plaque when desmosomes are stained with a C-terminal ...
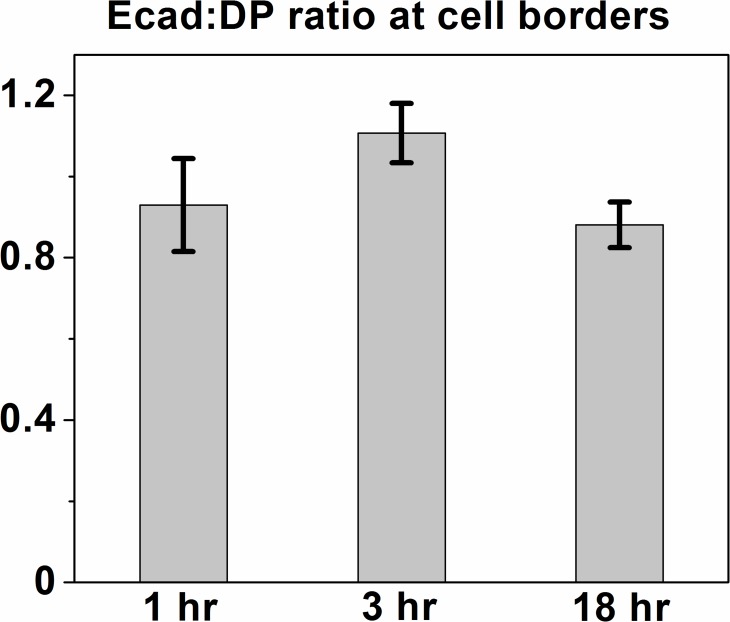
Figure 3u2014figure supplement 1.
Relative Ecad levels remain unchanged over a calcium switch time-course.
Quantification of Ecad:DP ratio at cell borders. Entire cell border regions (in contrast to individual desmosomes as for Figure 3) were selected using the polygon selection tool in Fiji and the mean i...
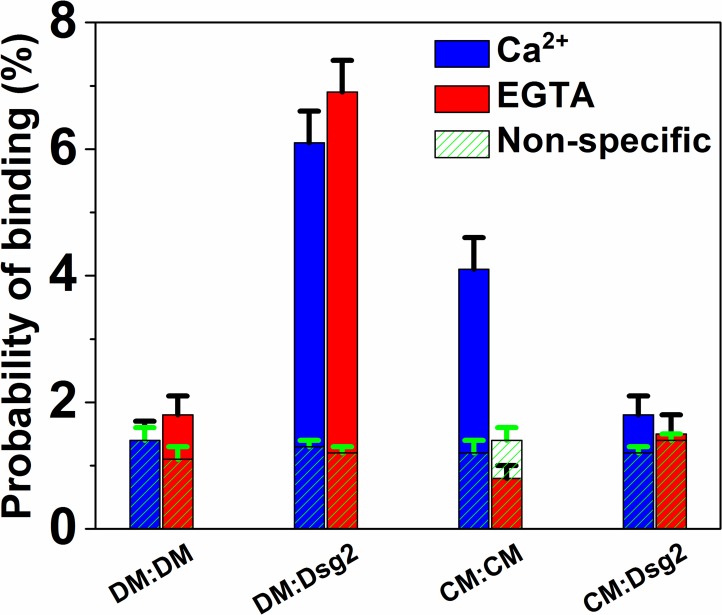
Figure 4.
Ecad interacts with Dsg2 via Leu 175.
Homophilic binding probability of Ecad W2A-K14E double mutant (DM); heterophilic binding probability of DM and Dsg2; homophilic binding probability of Ecad L175D cis dimer mutant (CM); and the heterop...
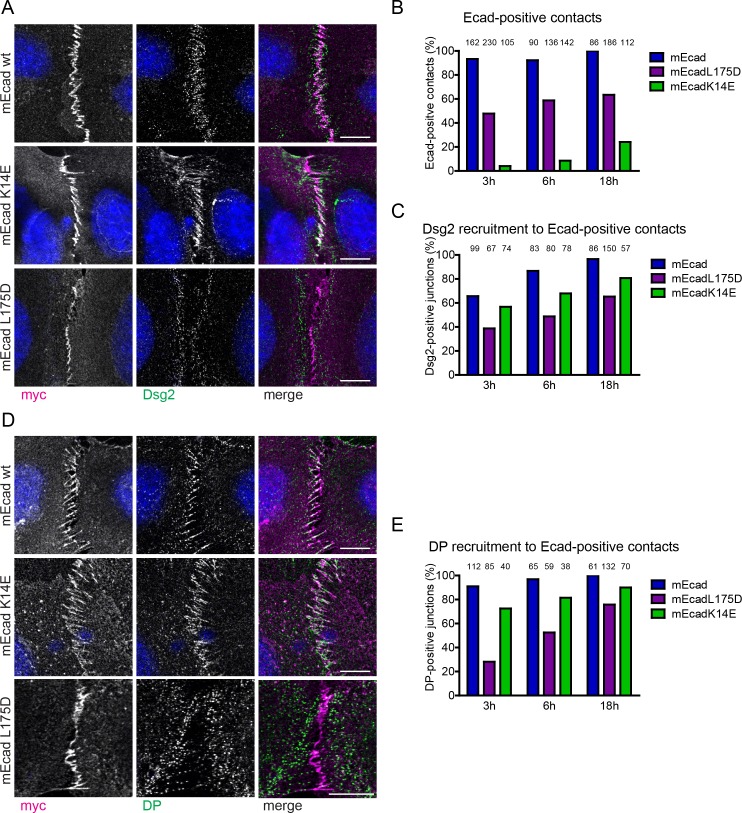
Figure 5.
Ecad-L175 promotes desmosome assembly in cells.
( A ) Immunofluorescence analysis for transfected WT or mutant Ecad (myc) and Dsg2, 6 hr after allowing de novo junction formation in Ecad KO /Pcad KD keratinocytes. Note decreased localization of Dsg...
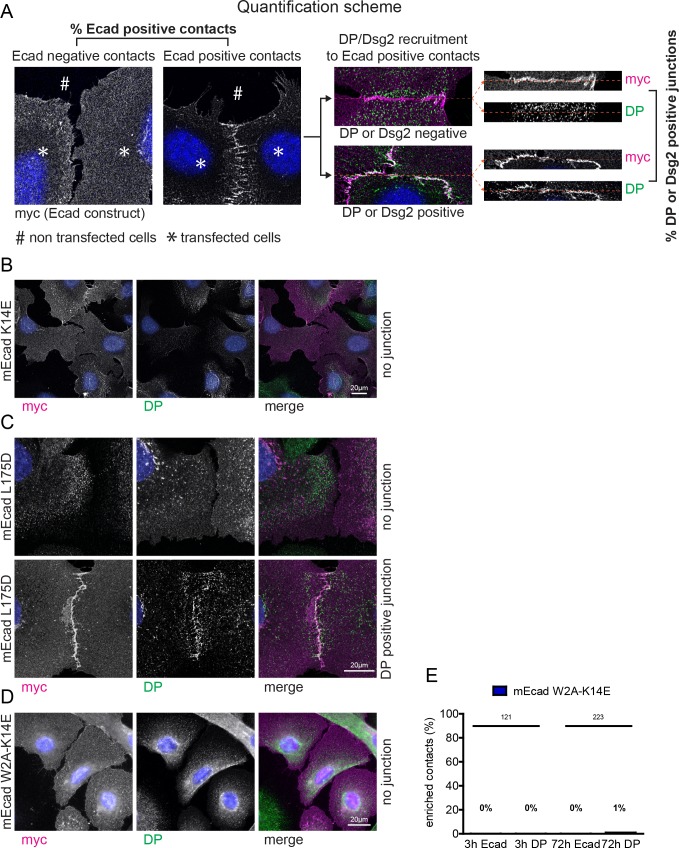
Figure 5u2014figure supplement 1.
Impaired junction formation in Ecad-K14E, Ecad-L175D, and Ecad-W2A/K14E (DM) mutants.
( A ) Representation of the quantification criteria and junctional categories that were used in the analysis. Examples of cells transfected with Ecad mutant that do not (left panel) or do (right panel...
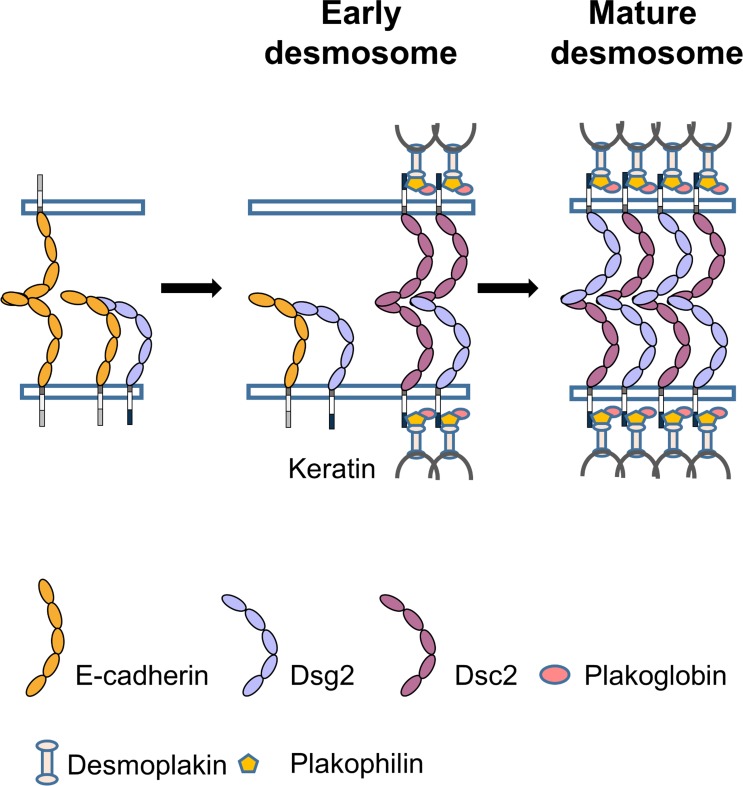
Figure 6.
Proposed model for the role of Ecad in desmosome assembly.
Ecad (orange) interacts with Dsg2 (light blue) to form a low-lifetime cis heterodimer.u00a0Formation of Ecad/Dsg2 complex requires prior Ecad trans homodimerization. The Ecad/Dsg2 complex is incorpora...
Figure images are served from the NIH/NLM PubMed Central Open Access Subset or Europe PMC; copyright remains with the publishers and authors.
💬 Discussion
0 commentsNo comments yet. Be the first to start a discussion!
Leave a Comment