Abstract
The sequential activation of neurons has been observed in various areas of the brain, but in no case is the underlying network structure well understood. Here we examined the circuit anatomy of zebra finch HVC, a cortical region that generates sequences underlying the temporal progression of the song. We combined serial block-face electron microscopy with light microscopy to determine the cell types targeted by HVC(RA) neurons, which control song timing. Close to their soma, axons almost exclusively targeted inhibitory interneurons, consistent with what had been found with electrical recordings from pairs of cells. Conversely, far from the soma the targets were mostly other excitatory neurons, about half of these being other HVC(RA) cells. Both observations are consistent with the notion that the neural sequences that pace the song are generated by global synaptic chains in HVC embedded within local inhibitory networks.
🔬 Techniques
🔭 Microscopes
💻 Software
✨ Fluorophores
🧪 Sample Preparation
🏭 Microscope Brands
🧪 Reagent Suppliers
🔎 Objectives
💻 Software Details
📋 Protocols
💻 Code & Software
Aligner for large scale serial section image data
Python library for interacting with KNOSSOS data sets and annotation files
Aligner for large scale serial section image data
Python library for interacting with KNOSSOS data sets and annotation files
Supplementary code and URLs to data
💾 Data Repositories
🏛️ Research Organizations (ROR)
Affiliated research institutions:
📋 Methods
Animals
We used adult (>90 days post hatch) male zebra finches that were obtained from an outside breeder and maintained in a temperature- and humidity-controlled environment with a 12/12 hr light/dark schedule. All animal maintenance and experimental procedures were performed according to the guidelines established by the Institutional Animal Care and Use Committee at the New York University Langone Medical Center.
Surgery
To label only neurons that projected from HVC to the robust nucleus of the arcopallium (RA), we injected lysine-fixable retrograde dextran tracers (Invitrogen) conjugated to either Tetramethylrhodamine (fluoro-Ruby, mol. Weight: 10,000) or biotin (BDA, mol. weight: 3000) for preparations to be inspected with light microscopy (LM) or electron microscopy (EM), respectively. We injected 200 nL of either Fluoro-Ruby (50 mg/mL) or BDA (100 mg/mL) into RA of anesthetized (1–3% isoflurane in oxygen) zebra finches using an injection system (Nanoject, Drummond Scientific, Broomall, PA) outfitted with a glass injection pipette (tip diameter: 30–40 µm). RA was targeted using stereotaxic coordinates (2.30 mm lateral and 1.85 mm posterior from the midsagittal sinus) and success in finding the RA region was confirmed by observing characteristic spontaneous activity ( Long and Fee, 2008 ) using a carbon-fiber electrode (Carbostar-1, Kation Scientific, Minneapolis, MN) and an extracellular amplifier (NPI Electronic Instruments, Germany). For in vivo imaging and dye loading, we first had to enable optical access to HVC. To accomplish this, a craniotomy (1 mm x 1 mm) was prepared over HVC. The underlying dura was then carefully removed with a flame sharpened tungsten wire (starting diameter: 0.5 mm). A small drop of saline buffer was applied to the exposed brain, followed by a 3 mm-diameter round cover glass (#0 thickness, Warner Instruments, Hamden, CT) as an optical window, which was first secured to the surrounding skull by applying light-curable acrylic (Flow-IT ALC; Pentron Clinical Technologies) around the edges of the glass. Dental acrylic (Cooralite Dental MFG, Diamond Springs, CA) and cyanoacrylate were then added to permanently and stably attach the cover glass to the skull. A small metal head plate with two tapped holes was then implanted at the anterior part of the skull using dental acrylic for head fixation.
Show full methods section
Animals
We used adult (>90 days post hatch) male zebra finches that were obtained from an outside breeder and maintained in a temperature- and humidity-controlled environment with a 12/12 hr light/dark schedule. All animal maintenance and experimental procedures were performed according to the guidelines established by the Institutional Animal Care and Use Committee at the New York University Langone Medical Center.
Surgery
To label only neurons that projected from HVC to the robust nucleus of the arcopallium (RA), we injected lysine-fixable retrograde dextran tracers (Invitrogen) conjugated to either Tetramethylrhodamine (fluoro-Ruby, mol. Weight: 10,000) or biotin (BDA, mol. weight: 3000) for preparations to be inspected with light microscopy (LM) or electron microscopy (EM), respectively. We injected 200 nL of either Fluoro-Ruby (50 mg/mL) or BDA (100 mg/mL) into RA of anesthetized (1–3% isoflurane in oxygen) zebra finches using an injection system (Nanoject, Drummond Scientific, Broomall, PA) outfitted with a glass injection pipette (tip diameter: 30–40 µm). RA was targeted using stereotaxic coordinates (2.30 mm lateral and 1.85 mm posterior from the midsagittal sinus) and success in finding the RA region was confirmed by observing characteristic spontaneous activity ( Long and Fee, 2008 ) using a carbon-fiber electrode (Carbostar-1, Kation Scientific, Minneapolis, MN) and an extracellular amplifier (NPI Electronic Instruments, Germany). For in vivo imaging and dye loading, we first had to enable optical access to HVC. To accomplish this, a craniotomy (1 mm x 1 mm) was prepared over HVC. The underlying dura was then carefully removed with a flame sharpened tungsten wire (starting diameter: 0.5 mm). A small drop of saline buffer was applied to the exposed brain, followed by a 3 mm-diameter round cover glass (#0 thickness, Warner Instruments, Hamden, CT) as an optical window, which was first secured to the surrounding skull by applying light-curable acrylic (Flow-IT ALC; Pentron Clinical Technologies) around the edges of the glass. Dental acrylic (Cooralite Dental MFG, Diamond Springs, CA) and cyanoacrylate were then added to permanently and stably attach the cover glass to the skull. A small metal head plate with two tapped holes was then implanted at the anterior part of the skull using dental acrylic for head fixation.
2-Photon guided cell labeling
Juxtacellular labeling ( Pinault, 1996 ; Narayanan et al., 2015 ) with Neurobiotin (Vector Labs, Burlingame, CA) was used to fill individual RA-projecting HVC (HVC (RA) ) neurons out of a population that had been retrogradely labeled from RA with fluoro-Ruby in vivo. After waiting at least 48 hr following the injection of the retrograde tracer into RA, two-photon imaging ( Denk and Webb, 1990 ) was used to identify the target cell and guide the pipette. On the day of single-cell labeling, a small pipette access hole (~400–500 µm) was drilled in the glass coverslip immediately lateral to the target recording region using a carbide bur drill bit (1/4 FG-100; Johnson-Promident). Glass pipettes were fabricated using a horizontal puller (P97, Sutter Instrument Company, Novato, CA) and had a final resistance of 4–5 MΩ when loaded with internal solution that consisted of 150 mM K-Gluconate (Sigma-Aldrich, St. Louis, MO) and 3% Neurobiotin. The microscope (MOM, Sutter Instrument Company) was of the moveable objective design ( Euler et al., 2009 ) and was controlled using ScanImage ( Pologruto et al., 2003 ) 3.8 with a 16x/0.8 NA water immersion objective (Nikon, Japan). Pipettes were made fluorescent either by adding 40 µM of Alexa 488 (Invitrogen) to the internal solution or by coating the pipette with green fluorescent quantum dots ( Andrásfalvy et al., 2014 ). The activity of HVC (RA) neurons was recorded (IR-183, Cygnus Technology Inc, Delaware Water Gap, PA), and cells were filled with Neurobiotin by applying 1000–1500 positive current pulses with an amplitude between 3 and 15 nA and a duration of 200 ms delivered at a frequency of 2.5 Hz. Histological procedures (LM) Birds were anesthetized with pentobarbital sodium and perfused transcardially with 4% w/v paraformaldehyde (EMS) at least one hour after dye loading to permit adequate Neurobiotin diffusion. Brains were removed from the skull using a surgical scoop, immersed in 4% paraformaldehyde for 3–5 days to achieve thorough fixation, and incubated in phosphate buffer for an additional 1–3 days to decrease endogenous peroxidase activity. To prepare sections, the brain was cut across the midline, mounted on the sagittal surface with cyanoacrylate, and stabilized with 3% agarose. Parasagittal sections (100 µm thickness) of HVC were cut using a vibratome (Leica VT1000S). Slices were washed five times with phosphate buffer and treated with 3% H 2 O 2 to further reduce endogenous peroxidase activity. Slices were then immersed overnight at 4°C in a solution containing avidin/biotin complexes and 0.5% Triton X-100 in phosphate buffer (Vector Labs and Sigma-Aldrich, respectively) to tag the Neurobiotin with peroxidase complex. On the following day, slices were washed five times with phosphate buffer and then immersed in a solution containing 2.3 mM diaminobenzidine (DAB, Sigma-Aldrich) and 0.01% H 2 O 2 in phosphate buffer to label processes containing Neurobiotin. Slices were then washed and mounted on slides with Vectashield (Vector Labs) or Mowiol (Sigma-Aldrich) mounting medium. To quantify the number of HVC-projecting RA neurons, we injected a retrograde tracer into HVC (DiI, Invitrogen D3911; 46 nL total injection volume) that labels neurons with high efficiency in zebra finches ( Scott et al., 2012 ). Following a two-day incubation period, animals were perfused with 4% paraformaldehyde, and 100 µm sagittal sections were cut across the entirety of RA, Nucleus Interfacialis (NIf), and nucleus Uvaeformis (Uva). Sections were mounted on slides using Vectashield (Vector Labs) and imaged with a confocal microscope (LSM 800, Zeiss, Germany; excitation / emission: 551/569 nm) using a 20x objective (0.8 NA). The z-stacks of retrogradely labeled RA (HVC) neurons were captured across the extent of RA, and the position of each cell was manually marked using the landmark function in Amira.
LM imaging
Only well-filled HVC (RA) neurons were selected for reconstruction, specifically those in which the soma, dendrite, and axon were all labeled (even if faintly) without interruptions and with clearly labeled dendritic spines and presynaptic boutons were selected for high resolution LM imaging with a custom-designed high-resolution mosaic/optical-sectioning brightfield microscope system ( Oberlaender et al., 2007 ). In brief, a transmitted light brightfield microscope (Olympus BX51, Olympus, Japan), equipped with a motorized x-y-z stage (Maerzhaeuser, Germany), a narrow bandpass (546 ± 5 nm) illumination filter and a 100x magnification oil-immersion objective (numerical aperture 1.4) was used to acquire image stacks from consecutive 100 µm thick brain sections. For each section, a 3D mosaic of images (e.g., 10 × 15 fields of view) covering the entire HVC was acquired at 92 × 92 nm pixel size and in steps of 500 nm mechanical defocus. Next we applied a linear image restoration algorithm (Tikhonow-Miller) using the Huygens software package (Scientific Volume Imaging, Netherlands). By inverting the gray values of the brightfield image stacks they could be treated as fluorescent data with an emission wavelength of 546 nm. The deconvolution used a point-spread-function that takes the optical properties of biocytin-labeled brain tissue into account ( Oberlaender et al., 2009 ). Deconvolved image stacks were then downsampled by a factor of two in x/y, yielding a final voxel size of 184 × 184 × 500 nm before axonal reconstruction. To quantify the bouton density, subvolumes that contained primarily horizontal (i.e. within the image plane) axonal branches were acquired at 200 nm focus increments and used without deconvolution. Neuron reconstructions (LM) Neuronal branches (dendrites and axons) were reconstructed in 3D using NeuroMorph ( Oberlaender et al., 2007 ). Automated tracing results from each histological section were manually proof-edited using FilamentEditor ( Dercksen et al., 2014 ), custom-designed based on Amira visualization software (FEI-VisualizationSciencesGroup). In brief, maximum-intensity z-projections of the original image stacks were superimposed onto automatically generated 3D skeleton tracings of all putative neuronal branches contained within the imaged volume and segmented objects that had no correspondence in the projection image were manually deleted ( Dercksen et al., 2014 ). Fragmented segments were spliced, and axonal branches were classified as ‘dendrite’ or ‘axon’ based on whether, respectively, spines or boutons were visible in the projection images. Whenever a neuronal branch reached one of the borders of the imaged volume, additional image stack regions were acquired that allowed us to follow the branch further. To account for shrinkage during histological processing, the reconstruction was scaled to match the thickness of 100 µm, as defined by the vibratome. The scaled 3D tracings from all consecutive sections were then combined and manually aligned using the FilamentEditor. The z-coordinate of each point was then replaced by the average of nine points (the point itself and the four adjacent points in each direction) and resampled to a point spacing of about 1 µm. Smoothing in z and downsampling make path length measurements comparable to manual tracing results using Neurolucida Software (Microbrightfield, Williston, VT). The NeuroMorph and FilamentEditor tools enable tracings that are independent of the experience of the human operator, with an interuser-variability of approximately 20 µm per 1 mm axonal length( Dercksen et al., 2014 ). The borders of HVC were manually traced in each 100 µm tissue section using Neurolucida.
Analysis of LM reconstructions
The fraction of dendritic length contained within a certain distance of the soma was determined by conducting a spherical Sholl analysis ( Sholl, 1953 ) in Neurolucida (Microbrightfield). The proportion of axonal pathlength both within HVC and within a 200 µm radius from the soma was computed in Amira for each neuron using the ZIB extension package ( Egger et al., 2014 ). Axonal boutons and dendritic spines were annotated manually in Amira using high-resolution LM stacks. The location of each bouton or spine was marked in 3D and aligned in Amira to the corresponding branch reconstruction. Spine-densities were calculated for each branch by dividing its total spine count by its path length. Branch nodes (points where the axon bifurcates) were manually located in the reconstructions using Amira. Branch nodes for which one of the daughter branches was 10 µm) was selected that often included the place where the axon was in contact with the dendrite. We counted as a spine every skeleton branch with a length greater than 1 µm that emerged from the dendritic shaft. Some postsynaptic protrusions found on interneurons contained multiple synapses (e.g., Figure 2—figure supplement 1b ). Therefore, spines were defined as receiving no more than one synapse at their ends by three independent annotators. The resulting spine density D spine (in µm −1 ) was used to classify the dendritic stretch as belonging to an interneuron (D spine < 0.11), HVC (RA) (0.11 < D spine < 0.46), or HVC (X) neuron (0.46 < D spine ). To detect dendritic reconstructions that were traced from separate synapses but belonged to the same dendrite, we detected overlap between skeletons using the following criterion: a node was considered to overlap another skeleton if it was less the 400 nm from any edge of all other skeletons. Dendritic reconstructions were defined as belonging to the same neuron when at least 25% of their nodes overlapped. Since the postsynaptic dendritic reconstructions were never complete (i.e. only parts of the entire neuron could be reconstructed), our analysis could only positively identify reconstructions as belonging to the same cell. For dendrites that were found to belong to the same cell (grouped together after being traced from different synapses), spine density was averaged before classification. Estimating the axon-to-soma distance We used two different ways to estimate the distance between an orphaned branch and its soma from its number of branch nodes inside the EM volume, both based on the LM observation that the density of branch nodes, D b , varies with soma distance (r) ( Figure 3c ). The first way used a Bayesian approach to calculate the probability distribution over r, given a branch of length l and a branch-node count of N ( Figure 3c ), which can be used to estimate, as needed, mean, median, variance or any quantile for r: P ( r | N , l ) ∝ P ( N , l | r ) ∗ P a ( r ) , whereby P ( N , l | r ) = ( D b ( r ) * l ) N * e − D b ( r ) * l N ! , which assumes that the branch nodes are placed independently from each other and are, therefore, Poisson distributed with a node-count expectation value of λ = D b ( r ) * l . Fitting the LM measurements to an exponential gave D b ( r ) = ( 35.448 * e − r 43.5 m m + 0.613 ) mm . The Bayesian prior, P a ( r ) , i.e. the probability that an axon segment is found at a distance between r and r± � from its soma, was estimated by applying Gaussian kernel density estimation (Python scipy.stats.gaussian_kde, scott bandwidth selector) to the LM based axon distribution measurements. The other way to relate r to N and l is to sample the LM data directly: We divided each of the 15 LM stacks into volumes shaped identically to the EM volume and recorded for each volume and for all contained orphaned branches their lengths, distances from the soma, and branch-node counts. Only branches that both entered and left the sampled subvolume were considered (about 95% of the total) because all of the reconstructed orphaned branches in the EM volume also had that property. This was repeated with the origin of the division grid shifted in 10 µm increments along all three axes resulting in 17 × 17 × 8 different divisions for each LM stack. For a given orphaned branch in the EM volume, we selected all those sample branches that had the same node count and a length within ± 10%. The distribution of their soma distances was then used in the same way as the probability distribution coming from the Bayesian approach. Estimating the fraction of homotypic HVC (RA) synapses In order to estimate the homotypic fraction of all excitatory synapses onto HVC (RA) cells, we determined the density of homotypic synapses by counting the number of double labeled synapses and correcting it for the axonal labeling efficiency. Labeling efficiency was estimated by comparing the volume density of labeled axon length by inspecting 300 randomly placed 1 µm 3 cubes with the density expected for HVC (RA) neurons using published estimates for their total number ( Wang et al., 2002 ) and the average axonal path length from LM reconstructions. To count the number of double labeled synapses, BDA-labeled dendrites were searched by an expert annotator for synapses with labeled axons by following them in KNOSSOS at the full voxel resolution, instructed to annotate also synapses with weak labeling. The found synapses were then scrutinized by JK and the result was confirmed by ML and SB. All error estimates were calculated assuming independence of the errors using the variance formula for error propagation.
Histological procedures (LM) Birds were anesthetized with pentobarbital sodium and perfused transcardially with 4% w/v paraformaldehyde (EMS) at least one hour after dye loading to permit adequate Neurobiotin diffusion. Brains were removed from the skull using a surgical scoop, immersed in 4% paraformaldehyde for 3–5 days to achieve thorough fixation, and incubated in phosphate buffer for an additional 1–3 days to decrease endogenous peroxidase activity. To prepare sections, the brain was cut across the midline, mounted on the sagittal surface with cyanoacrylate, and stabilized with 3% agarose. Parasagittal sections (100 µm thickness) of HVC were cut using a vibratome (Leica VT1000S). Slices were washed five times with phosphate buffer and treated with 3% H 2 O 2 to further reduce endogenous peroxidase activity. Slices were then immersed overnight at 4°C in a solution containing avidin/biotin complexes and 0.5% Triton X-100 in phosphate buffer (Vector Labs and Sigma-Aldrich, respectively) to tag the Neurobiotin with peroxidase complex. On the following day, slices were washed five times with phosphate buffer and then immersed in a solution containing 2.3 mM diaminobenzidine (DAB, Sigma-Aldrich) and 0.01% H 2 O 2 in phosphate buffer to label processes containing Neurobiotin. Slices were then washed and mounted on slides with Vectashield (Vector Labs) or Mowiol (Sigma-Aldrich) mounting medium. To quantify the number of HVC-projecting RA neurons, we injected a retrograde tracer into HVC (DiI, Invitrogen D3911; 46 nL total injection volume) that labels neurons with high efficiency in zebra finches ( Scott et al., 2012 ). Following a two-day incubation period, animals were perfused with 4% paraformaldehyde, and 100 µm sagittal sections were cut across the entirety of RA, Nucleus Interfacialis (NIf), and nucleus Uvaeformis (Uva). Sections were mounted on slides using Vectashield (Vector Labs) and imaged with a confocal microscope (LSM 800, Zeiss, Germany; excitation / emission: 551/569 nm) using a 20x objective (0.8 NA). The z-stacks of retrogradely labeled RA (HVC) neurons were captured across the extent of RA, and the position of each cell was manually marked using the landmark function in Amira.
Histological procedures (EM) The bird used for the EM experiments was transcardially perfused in a way that preserves the extracellular space and leads to minimal shrinkage (JK, unpublished observations), by using high pressure and the following fixative solution: 0.07 M sodium cacodylate (Serva, Germany), 140 M sucrose (Sigma-Aldrich), 2 mM CaCl 2 (Sigma-Aldrich) with 2% paraformaldehyde and 2% glutaraldehyde (Serva) added ( Cragg, 1980 ). The brain was removed and, using a vibratome (Leica VT1000S), cut into slices each about 200 µm thick. One of the slabs that centrally intersected HVC was selected and post-fixed in the same solution overnight, rinsed several times with cacodylate buffer and permeabilized in a 30% sucrose solution by exposing it to one freeze-thaw cycle in liquid nitrogen. Residual peroxidase activity was suppressed by soaking the sample in 3% H 2 O 2 for 30 min before labeling the sample with an avidin-peroxidase complex and DAB, as described in a previous section. The sample was then rinsed several times in cacodylate buffer. Heavy metal staining was added through a conventional ROTO protocol using the following steps interspersed with rinses in cacodylate buffer (after first Osmium step) or H 2 O (all others): 2% OsO 4 (Serva), reduced with 2.5% potassium hexacyanoferrate(II) (Sigma-Aldrich) 2 hr, room temperature; 1% thiocarbohydrazide in H 2 O, 1 hr, 58°C (Sigma-Aldrich); 2% OsO 4 , 2 hr; 1.5% uranyl-acetate in H 2 O, 53°C (Serva); 20 mM lead-aspartate, 2 hr, 53°C (Sigma-Aldrich) ( Seligman et al., 1966 ; Karnovsky, 1971 ; Walton, 1979 ). Dehydration was performed using an ethanol series with 10, 15, 10, 10 min at 70%, 100%, 100%, and 100% ethanol (Electron Microscopy Sciences). The sample was infiltrated with epoxy monomer (epon hard, Serva) ( Glauert and Lewis, 2014 ) dissolved in propylene oxide (Sigma-Aldrich) for 3 hr and for 3 hr with pure monomer before final embedding and curing (48 hr at 60°C). The sample was then trimmed and glued with epoxy to a custom-made aluminum holder and trimmed into a pyramidal-shape before gold coating for better conductivity.
📊 Figures
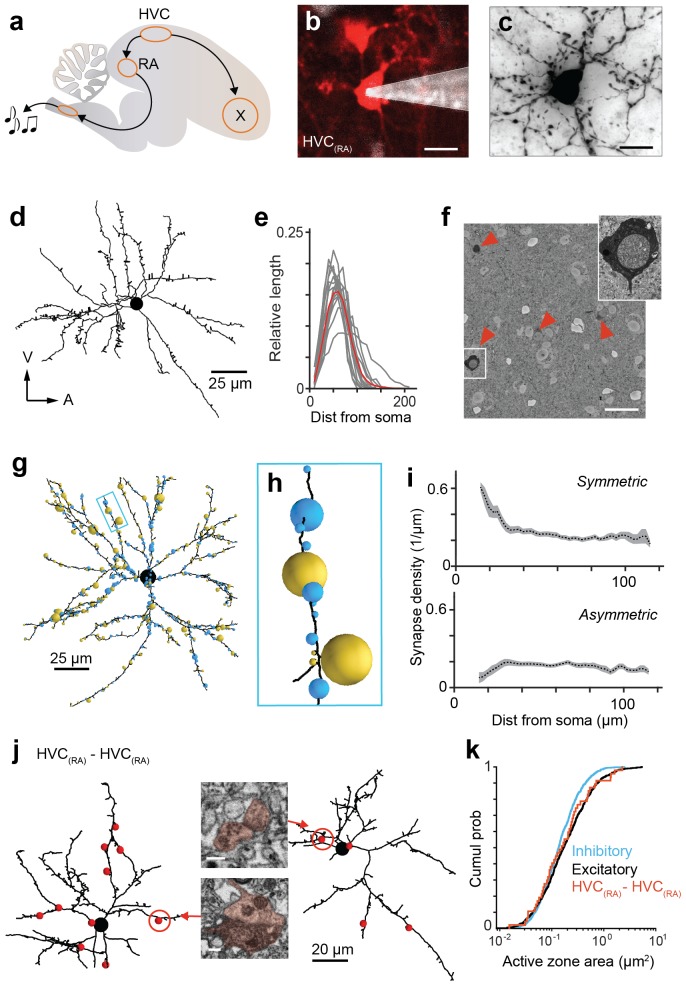
Figure 1.
Analysis of synaptic inputs onto HVC (RA) dendrites.
( a ) A schematic of the songbird brain showing HVC and its two main downstream targets, RA and Area X. ( b ) A backlabeled HVC (RA) neuron (red) during juxtacellular filling (pipette shown in white) ...
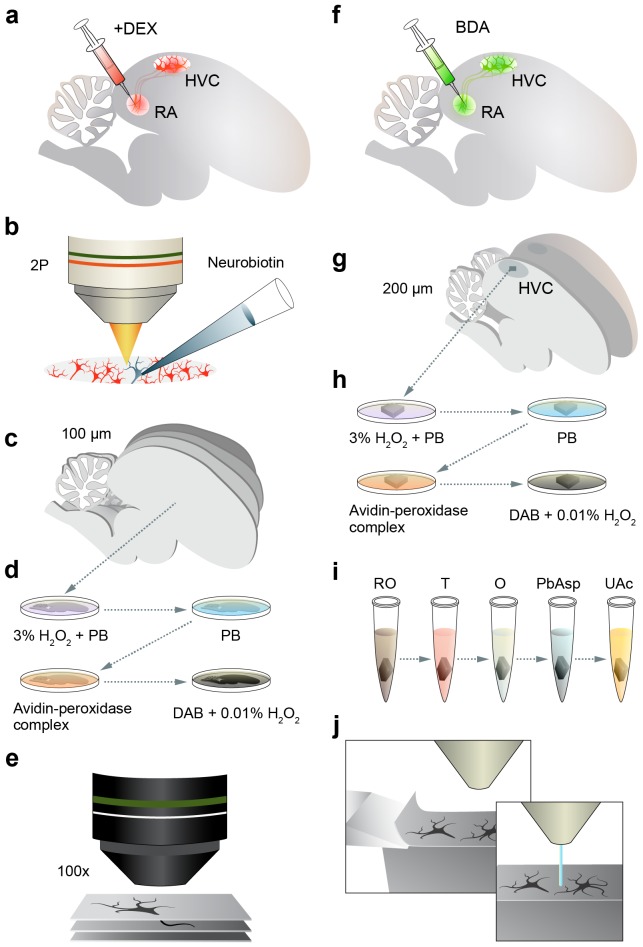
Figure 1u2014figure supplement 1.
Sample preparation for LM and EM.
( a,b ) For LM, HVC (RA) neurons are retrogradely labeled by injecting a fluorescent dextran (fluoro-Ruby) into RA ( a ), and a single labeled neuron is targeted and filled with Neurobiotin under the ...
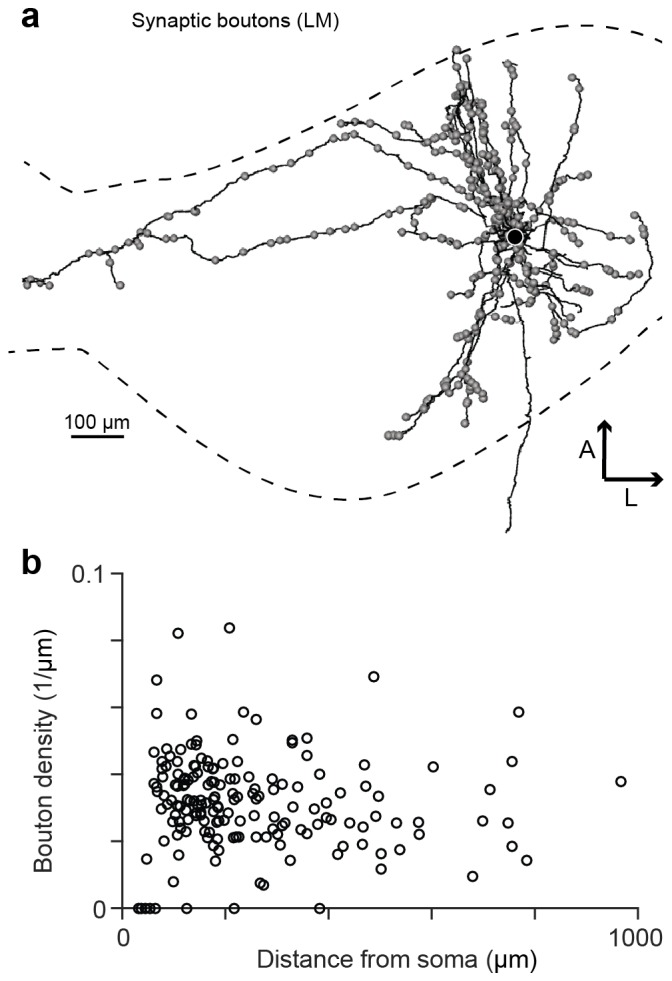
Figure 1u2014figure supplement 2.
Synaptic boutons on HVC (RA) axon collaterals.
( a ) An LM reconstruction of HVC (RA) axon collaterals of one neuron with the HVC border indicated by dashed lines. Locations of all synaptic boutons are marked by grey spheres. ( b ) Bouton density ...
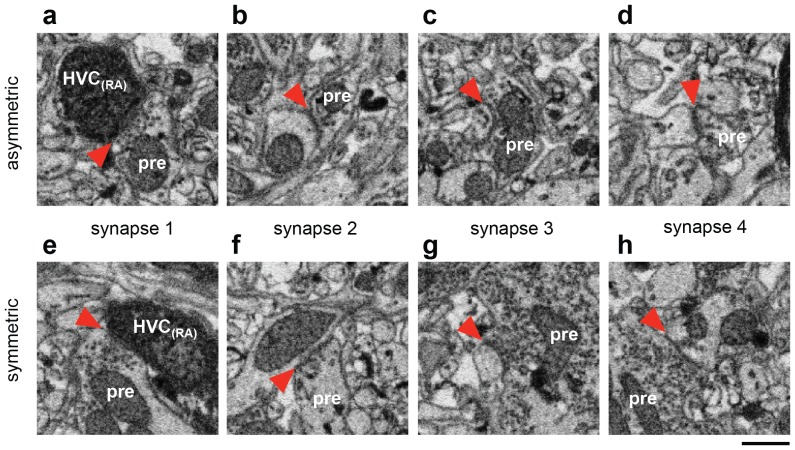
Figure 1u2014figure supplement 3.
Ultrastructural classification of synapses.
( a ) An asymmetric synapse onto a BDA-labeled HVC (RA) dendrite whose morphology is partially obscured by the label. Red arrows indicate the synaptic cleft. ( b to d ) Other synapses made by the same...
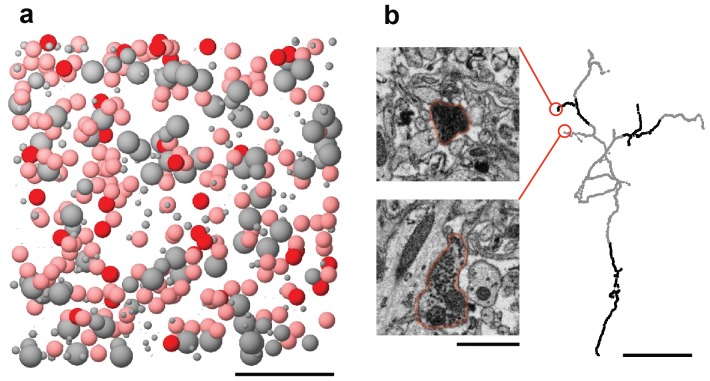
Figure 1u2014figure supplement 4.
The BDA label is inefficient and incomplete.
( a ) All cells within our SBEM dataset are represented by spheres at the location of the cell body. Known HVC (RA) neurons, which were labeled with BDA, were colored red. Also shown are putative HVC ...
Video 1.
Video shifting through a z-stack of a sagittal section within HVC, containing a Neurobiotin-filled HVC (RA) neuron stained with DAB.
Number of z-sections shown is 144. Voxel size is 92 u00d7 92u00a0u00d7u00a0500 nm. DOI: http://dx.doi.org/10.7554/eLife.24364.008
Video 2.
Video of a subregion of the acquired SBEM dataset, showing the original data resolution (lossy compression).
Number of z-sections shown is 100, translating to 2.9 u00b5m. DOI: http://dx.doi.org/10.7554/eLife.24364.009
Video 3.
Video of a subregion of the acquired SBEM dataset, showing a larger field of view with a BDA-labeled HVC (RA) soma (lossy compression).
Number of z-sections shown is 200, translating to 5.8 u00b5m. DOI: http://dx.doi.org/10.7554/eLife.24364.010
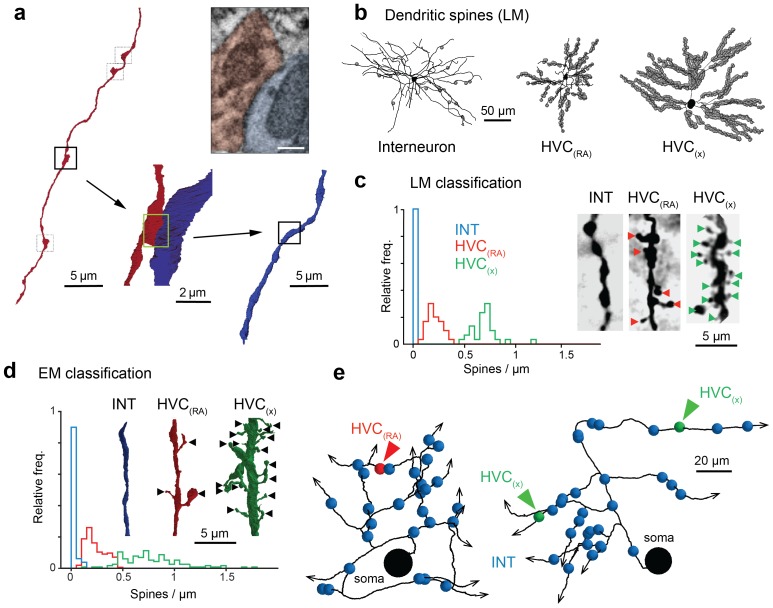
Figure 2.
Classification of postsynaptic targets.
( a ) A BDA-labeled axon with four synaptic boutons (boxes). One bouton and its postsynaptic structure labeled in red and blue, respectively: In cross section (top right) and as a surface reconstructi...
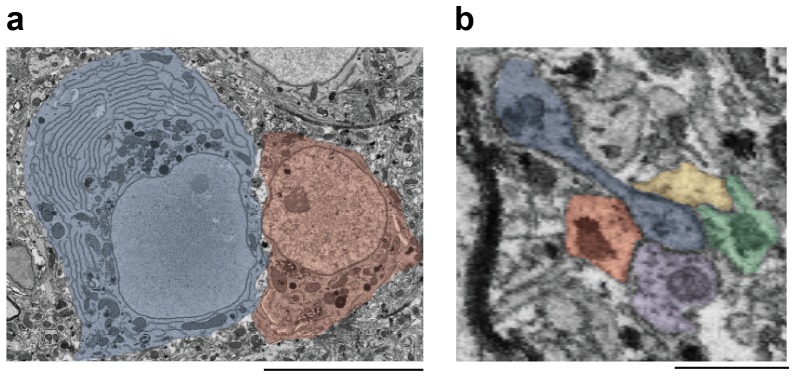
Figure 2u2014figure supplement 1.
Morphological markers of interneurons.
( a ) Ultrastructural and morphological differences of the somata of an HVC interneuron (left, blue shade) and an HVC (RA) neuron (right, red shade). Compared with HVC (RA) neurons, interneurons had l...
Video 4.
Video of a z-stack of 18 consecutive images (100 u00d7 100 pixels) showing a symmetric synapse.
Voxel dimensions: 11 u00d7 11u00a0u00d7u00a029. DOI: http://dx.doi.org/10.7554/eLife.24364.013
Video 5.
Video of a z-stack of 18 consecutive images (100 u00d7 100 pixels) showing an asymmetric synapse.
Voxel dimensions: 11 u00d7 11u00a0u00d7u00a029. DOI: http://dx.doi.org/10.7554/eLife.24364.014
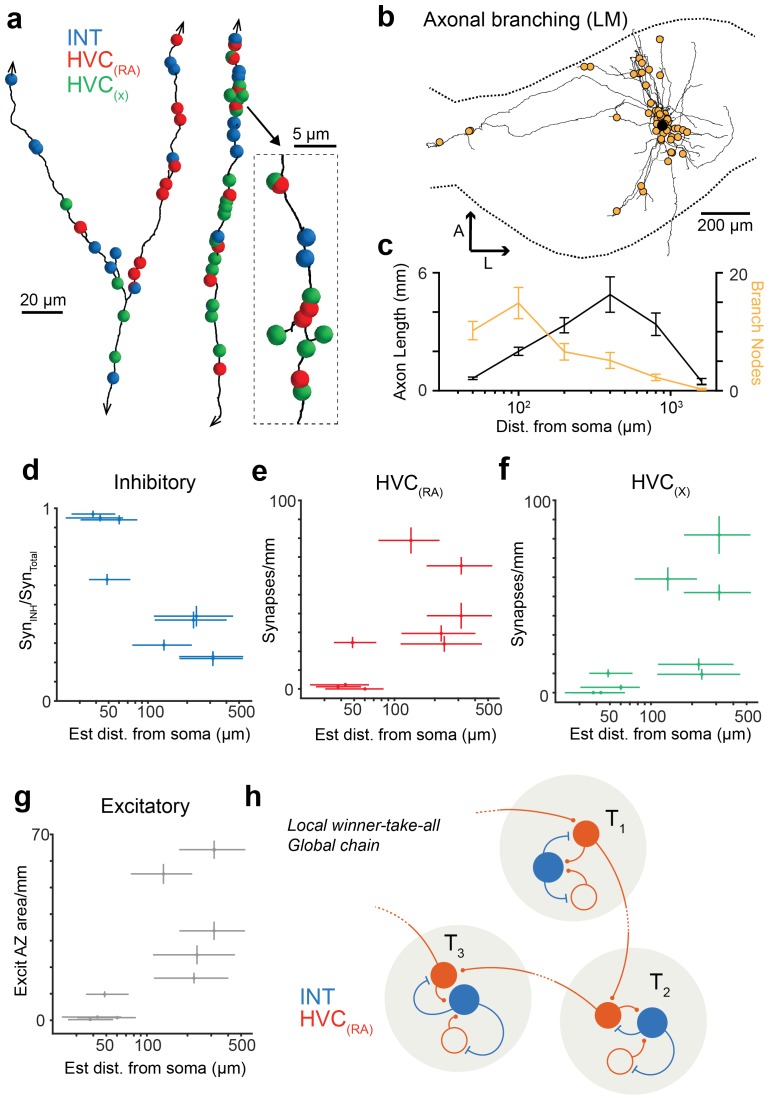
Figure 3.
Spatial variation of postsynaptic cell type.
( a ) SBEM-based reconstructions and synaptic targets for two orphaned axon segments. Colored spheres mark the locations and types of synapses. ( b ) Axon collaterals (LM-based reconstruction) of an H...
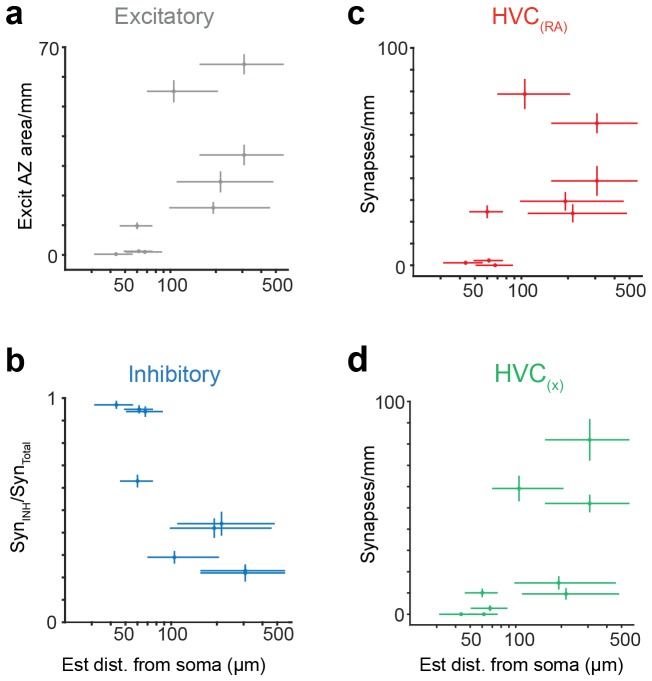
Figure 3u2014figure supplement 1.
Synaptic properties of HVC (RA) axons, using a Bayesian approach to estimate distance from soma.
( a ) Total synaptic strength (summated active zone area/pathlength) onto excitatory neurons vs. estimated distance of the presynaptic axon from the soma (p<0.05, Pearson's correlation). ( b )...
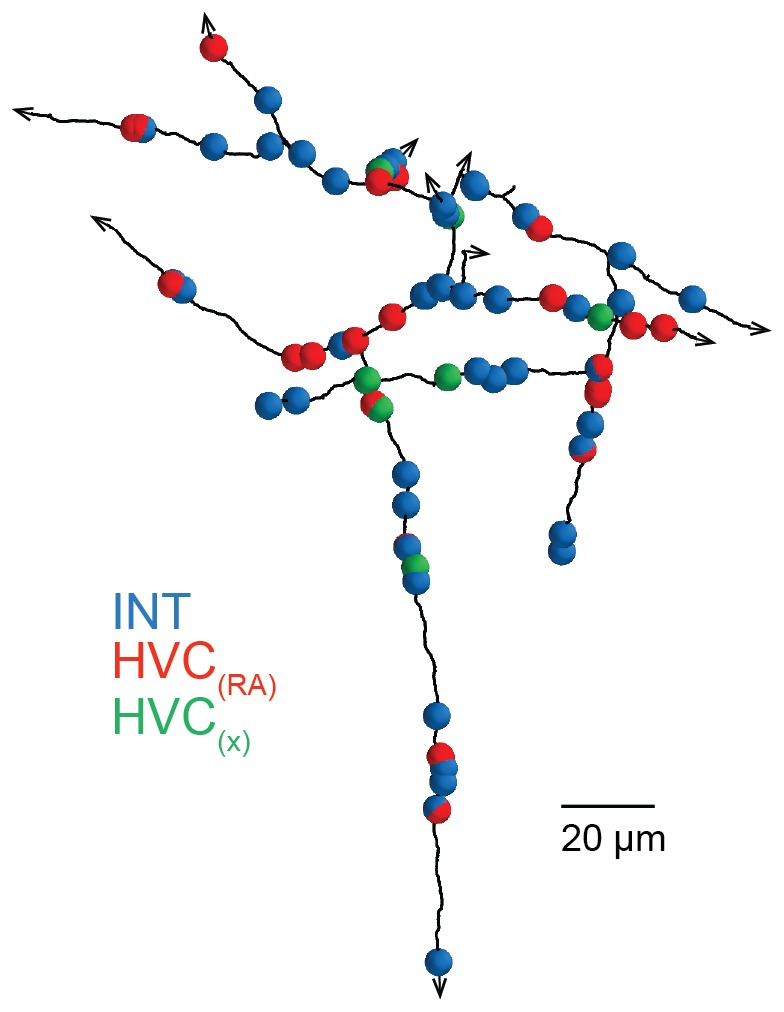
Figure 3u2014figure supplement 2.
A SBEM-based reconstruction and synaptic targets for an orphaned axon with high branch density.
Small spheres mark the location of synapses, with the color indicating the target type. Note the higher frequency of inhibitory targets (blue) along the length of the reconstruction compared with othe...
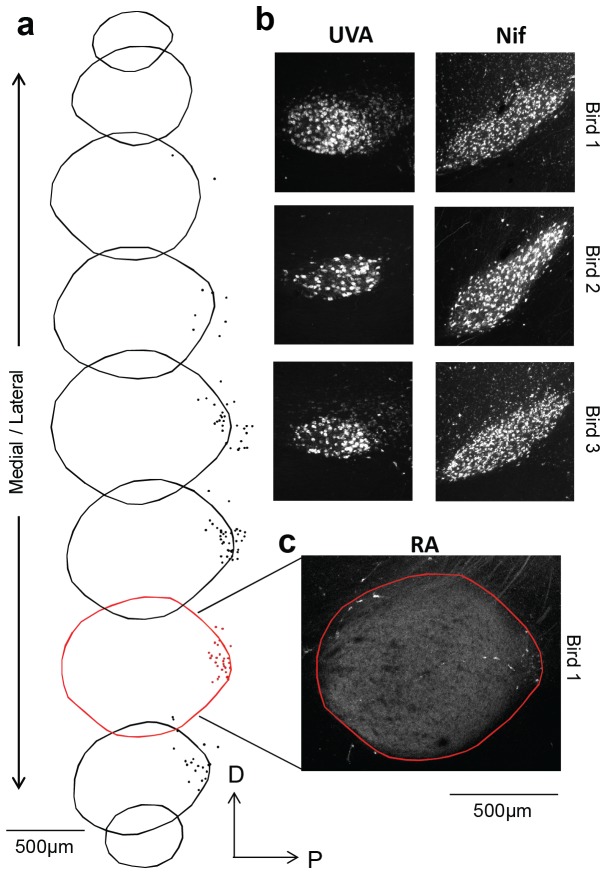
Figure 3u2014figure supplement 3.
A small population of RA neurons project to HVC.
( a ) The borders of RA were traced across nine sequential 100 u00b5m thick sagittal sections, and the location of each retrogradely labeled HVC-projecting RA neuron is marked with a dot. ( b ) DiI in...
Figure images are served from the NIH/NLM PubMed Central Open Access Subset or Europe PMC; copyright remains with the publishers and authors.
💬 Discussion
0 commentsNo comments yet. Be the first to start a discussion!
Leave a Comment