Abstract
AbstractNicotinic Acid Adenine Dinucleotide Phosphate (NAADP) stimulates calcium release from acidic stores such as lysosomes and is a highly potent calcium-mobilising second messenger. NAADP plays an important role in calcium signalling in the heart under basal conditions and following β-adrenergic stress. Nevertheless, the spatial interaction of acidic stores with other parts of the calcium signalling apparatus in cardiac myocytes is unknown. We present evidence that lysosomes are intimately associated with the sarcoplasmic reticulum (SR) in ventricular myocytes; a median separation of 20 nm in 2D electron microscopy and 3.3 nm in 3D electron tomography indicates a genuine signalling microdomain between these organelles. Fourier analysis of immunolabelled lysosomes suggests a sarcomeric pattern (dominant wavelength 1.80 μm). Furthermore, we show that lysosomes form close associations with mitochondria (median separation 6.2 nm in 3D studies) which may provide a basis for the recently-discovered role of NAADP in reperfusion-induced cell death. The trigger hypothesis for NAADP action proposes that calcium release from acidic stores subsequently acts to enhance calcium release from the SR. This work provides structural evidence in cardiac myocytes to indicate the formation of microdomains between acidic and SR calcium stores, supporting emerging interpretations of NAADP physiology and pharmacology in heart.
🔬 Techniques
🔭 Microscopes
💻 Software
✨ Fluorophores
🧪 Sample Preparation
🏭 Microscope Brands
🧪 Reagent Suppliers
💻 Software Details
💾 Data Repositories
🏛️ Research Organizations (ROR)
Affiliated research institutions:
📋 Methods
All animal experiments were performed in accordance with the United Kingdom Home Office Guide on the Operation of Animal (Scientific Procedures) Act of 1986. All experimental protocols (Schedule 1) were approved by the University of Oxford.
Rabbit ventricular cell isolation
Cardiomyocytes were isolated using a method modified from Powell, et al . 66 . Briefly, Male New Zealand White rabbits (approximately 1 kg) were sacrificed by intravenous overdose of sodium pentobarbitone. The heart was rapidly excised, washed in heparin-containing solution (5 U/mL), and mounted on a Langendorff apparatus for perfusion with zero-calcium solution containing (in mM) NaCl 136, KCl 5.4, NaHCO 3 12, sodium pyruvate 1, NaH 2 PO 4 1, MgCl 2 1, EGTA 0.04, glucose 5, gassed with 95% O 2 /5% CO 2 to maintain pH 7.4. After 2 min, digestion was initiated using an identical solution containing 0.5 mg.ml −1 type II collagenase (Worthington Biochemical Corp, Lakewood, NJ, USA) and 100 μM CaCl 2 instead of EGTA. This was allowed to recirculate for 30–35 minutes after which cells were mechanically isolated, filtered, centrifuged and suspended in Dulbecco’s Modified Eagle Medium (DMEM), or fixed within 60 min for electron microscopy and immunocytochemistry.
Electron microscopy
Samples (from n = 3 animals) were prepared from either chemically fixed isolated myocytes or from chemically fixed intact ventricular tissue. Rabbit ventricular cardiomyocytes isolated using the method described above, or approximately 1 mm 3 pieces of tissue from ventricles were rapidly dissected (post Langendorff perfusion) and fixed in Karnovsky fixative (paraformaldehyde 4%, glutaraldehyde 5%, cacodylate buffer 80 mM, pH 7.4, Karnovsky) 67 and were embedded in Spurr’s resin 68 . Sections were cut to approximately 80 nm thickness (Reichart Ultracut) and post-stained to achieve contrast by use of 2% aqueous uranyl acetate and Reynolds lead citrate. Images were obtained using a transmission electron microscope (TEM, Joel 1200EX II). Analysis and measurements were made using Gatan DigitalMicrograph and ImageJ software. Lysosomes were identified by their previously well-documented appearance; that is, a matrix slightly more electron dense than the surrounding cytoplasm enclosed by a single lipid bilayer membrane 32 , see Fig. 1 . Measurements from both cells and tissue were included in analysis and the subcellular appearance of these two preparations was indistinguishable under electron microscopy. Electron tomography (ET) Rabbit left ventricular tissue fragments (n = 6 animals), were fixed via Langendorff perfusion in iso-osmotic (300 mOsm) Karnovsky’s reagent (2.4% sodium cacodylate, 0.75% paraformaldehyde, 0.75% glutaraldehyde), were washed with 0.1 M sodium cacodylate, post-fixed in 1% OsO 4 for 1 h, dehydrated in graded acetone, and embedded in Epon-Araldite resin. Thick sections were cut (~275 nm, 3 sections per animal), transferred onto copper slot grids coated with 1% formvar and post-stained with 2% aqueous uranyl acetate, followed by Reynolds’ lead citrate. Colloidal gold particles (15 nm) were added to both surfaces of the sections to serve as fiducial markers for subsequent tilt series alignment. All sections were prepared and imaged at the Boulder Laboratory for 3D Electron Microscopy of Cells (University of Colorado, Boulder, CO), using an intermediate voltage electron microscope (Tecnai TF30; 4FEI-Company, Eindhoven, The Netherlands) operating at 300 kV, with images captured on a charge-coupled device camera (UltraScan; Gatan, Pleasanton, CA), at a pixel size of (1.206 nm 2 ). For dual-axis tomography, series of tilted views were collected from + 60° to −60° at 1° increments at 20,000x magnification. After the first tilt series was acquired, the specimen was rotated by 90° in the horizontal plane, and another + 60° to −60° tilt series was taken. Images from each tilt-series were aligned by fiducial marker tracking and back-projected to generate two single full-thickness reconstructed volumes (tomograms), which were then combined to generate a high-resolution 3D reconstruction of the original volume of interest. Tomograms were processed and analysed using the IMOD software, also used to segment and generate 3D models of the structures of interest 69 70 . The models were smoothed and meshed to obtain a final 3D representation, in which spatial relationships of T-tubules, sarcoplasmic reticulum, mitochondria with lysosomes can be visualised.
Show full methods section
All animal experiments were performed in accordance with the United Kingdom Home Office Guide on the Operation of Animal (Scientific Procedures) Act of 1986. All experimental protocols (Schedule 1) were approved by the University of Oxford.
Rabbit ventricular cell isolation
Cardiomyocytes were isolated using a method modified from Powell, et al . 66 . Briefly, Male New Zealand White rabbits (approximately 1 kg) were sacrificed by intravenous overdose of sodium pentobarbitone. The heart was rapidly excised, washed in heparin-containing solution (5 U/mL), and mounted on a Langendorff apparatus for perfusion with zero-calcium solution containing (in mM) NaCl 136, KCl 5.4, NaHCO 3 12, sodium pyruvate 1, NaH 2 PO 4 1, MgCl 2 1, EGTA 0.04, glucose 5, gassed with 95% O 2 /5% CO 2 to maintain pH 7.4. After 2 min, digestion was initiated using an identical solution containing 0.5 mg.ml −1 type II collagenase (Worthington Biochemical Corp, Lakewood, NJ, USA) and 100 μM CaCl 2 instead of EGTA. This was allowed to recirculate for 30–35 minutes after which cells were mechanically isolated, filtered, centrifuged and suspended in Dulbecco’s Modified Eagle Medium (DMEM), or fixed within 60 min for electron microscopy and immunocytochemistry.
Electron microscopy
Samples (from n = 3 animals) were prepared from either chemically fixed isolated myocytes or from chemically fixed intact ventricular tissue. Rabbit ventricular cardiomyocytes isolated using the method described above, or approximately 1 mm 3 pieces of tissue from ventricles were rapidly dissected (post Langendorff perfusion) and fixed in Karnovsky fixative (paraformaldehyde 4%, glutaraldehyde 5%, cacodylate buffer 80 mM, pH 7.4, Karnovsky) 67 and were embedded in Spurr’s resin 68 . Sections were cut to approximately 80 nm thickness (Reichart Ultracut) and post-stained to achieve contrast by use of 2% aqueous uranyl acetate and Reynolds lead citrate. Images were obtained using a transmission electron microscope (TEM, Joel 1200EX II). Analysis and measurements were made using Gatan DigitalMicrograph and ImageJ software. Lysosomes were identified by their previously well-documented appearance; that is, a matrix slightly more electron dense than the surrounding cytoplasm enclosed by a single lipid bilayer membrane 32 , see Fig. 1 . Measurements from both cells and tissue were included in analysis and the subcellular appearance of these two preparations was indistinguishable under electron microscopy. Electron tomography (ET) Rabbit left ventricular tissue fragments (n = 6 animals), were fixed via Langendorff perfusion in iso-osmotic (300 mOsm) Karnovsky’s reagent (2.4% sodium cacodylate, 0.75% paraformaldehyde, 0.75% glutaraldehyde), were washed with 0.1 M sodium cacodylate, post-fixed in 1% OsO 4 for 1 h, dehydrated in graded acetone, and embedded in Epon-Araldite resin. Thick sections were cut (~275 nm, 3 sections per animal), transferred onto copper slot grids coated with 1% formvar and post-stained with 2% aqueous uranyl acetate, followed by Reynolds’ lead citrate. Colloidal gold particles (15 nm) were added to both surfaces of the sections to serve as fiducial markers for subsequent tilt series alignment. All sections were prepared and imaged at the Boulder Laboratory for 3D Electron Microscopy of Cells (University of Colorado, Boulder, CO), using an intermediate voltage electron microscope (Tecnai TF30; 4FEI-Company, Eindhoven, The Netherlands) operating at 300 kV, with images captured on a charge-coupled device camera (UltraScan; Gatan, Pleasanton, CA), at a pixel size of (1.206 nm 2 ). For dual-axis tomography, series of tilted views were collected from + 60° to −60° at 1° increments at 20,000x magnification. After the first tilt series was acquired, the specimen was rotated by 90° in the horizontal plane, and another + 60° to −60° tilt series was taken. Images from each tilt-series were aligned by fiducial marker tracking and back-projected to generate two single full-thickness reconstructed volumes (tomograms), which were then combined to generate a high-resolution 3D reconstruction of the original volume of interest. Tomograms were processed and analysed using the IMOD software, also used to segment and generate 3D models of the structures of interest 69 70 . The models were smoothed and meshed to obtain a final 3D representation, in which spatial relationships of T-tubules, sarcoplasmic reticulum, mitochondria with lysosomes can be visualised.
Immunocytochemistry
Isolated rabbit ventricular cardiomyocytes were fixed within 60 minutes of isolation. Briefly, cells were allowed to settle for 20 minutes on flamed glass coverslips. The cells were fixed with 4% paraformaldehyde solution (Sigma, UK), before permeablisation with 0.2% Triton-X 100 (Sigma-Aldrich, Dorset, UK) and blocked with 5% donkey serum. Cells were labelled with primary antibodies overnight at 4 °C (rabbit-anti-LAMP-2, Thermofisher PA1-655, Lot: PA189864 , 1:100; mouse-anti-RyR2, Abcam ab2827, 1:100; mouse-anti-phospholamban, Abcam ab2865, 1:100). Secondary antibodies were diluted in 5% donkey serum (donkey-anti-rabbit-AlexaFluor-488, Thermofisher A-21206; donkey-anti-mouse-Dylight-555, Newmarket Scientific AS12-1935), and incubated at room temperature for 2 h (control cells where the primary or secondary was to be excluded were incubated with 5% donkey serum alone without addition of the relevant antibody). Coverslips were mounted using Vectashield Hardset with DAPI (Vectorlabs, Peterborough, UK) and sealed. Slides were stored in the dark at 4 °C, and imaged within 48 h using an Olympus Fluoview FV1200 confocal microscope. Images obtained using the Olympus FV1200 confocal microscope with Fluoview software were not deconvolved and Kalman averaging of four pictures was used to obtain each final image. A 60x oil-immersion low-chromatic aberration objective was used and the confocal aperture was set to one Airy unit.
Analysis of images obtained using immunocytochemistry
Confocal images were analysed using custom MatLab (Mathworks, Cambridge, UK) scripts written in-house. Briefly, cell orientation was automatically detected and rotated to vertically align striations of RyR2 or PLB before thresholding to remove background noise. Total intensity for each vertical pixel column was calculated and waveforms subjected to a Fourier transform using the MatLab Signal Processing Toolbox ‘periodogram’ command to determine component frequencies. To analyse the distance between adjacent staining, signal waveforms were overlaid and the pixel-wise distance between the maxima of each pair of peaks was calculated. DAPI fluorescence signals were subjected to the same process as a control; no sarcomeric signal was detectable for this stain. MatLab code has been published on Figshare under the doi:10.6084/m9.figshare.3102769.
Live cell confocal microscopy
Isolated rabbit ventricular myocytes were incubated with 100 μM Ned-19 for 40 minutes at room temperature with addition of 500 nM LysoTracker red for the final 2 min. Cells were allowed to adhere to a glass coverslip and superfused with Tyrode’s solution containing (in mM): 135 NaCl, 4.5 KCl, 11 glucose, 20 HEPES, 1 MgCl2, 1.8 CaCl2, pH 7.4 with NaOH. Ned-19 fluorescence was excited at 355 nm and detected at 415 ± 30 nm (experimental approach similar to that described in Barcelo-Torns et al . 42 ), whilst LysoTracker red was excited at 514 nm and collected at 590–747 nm. Imaging was performed with a Leica SP5 inverted confocal microscope with a 40x or 63x oil-immersion objective. To analyse co-localisation, images were smoothed with a Gaussian filter (radius 2 pixels) and median image intensity (36 × 36 pixel) subtracted from the smoothed image to remove background noise. Pearson’s correlation coefficients were calculated from resulting images using ImageJ coloc2 plugin.
Statistics
Data is presented as mean ± standard error for normally distributed data and median (interquartile range) for skewed or non-parametric groups. Outliers were identified using ROUT analysis with Q = 1% (GraphPad Prism 6). Pearson’s product-moment correlation coefficient (r) was calculated to compute the degree of correlation between two variables.
Supplementary Material Supplementary Information Supplementary Video 1
📊 Figures
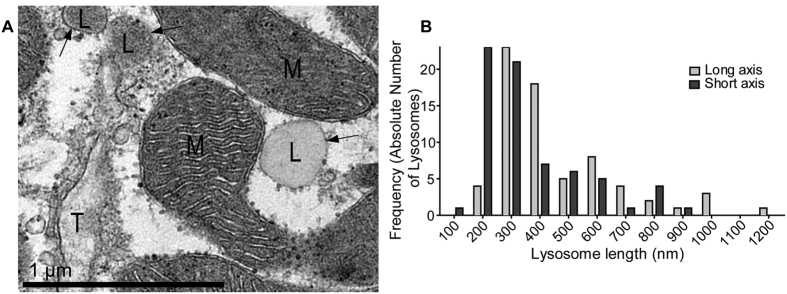
Figure 1
Identification of lysosomes in cardiac ventricular myocytes.
( A ) Electron micrograph of rabbit ventricular tissue containing both u2018electron denseu2019 and u2018electron lucentu2019 lysosomes (L). Both forms were used for analysis described in text and sub...
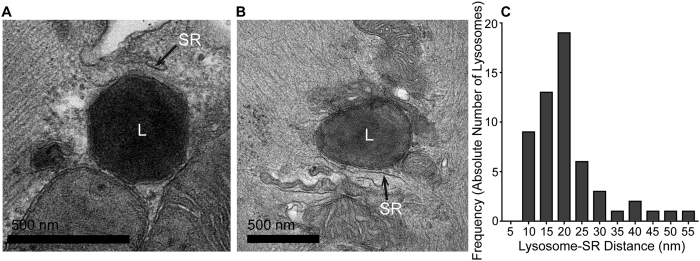
Figure 2
Lysosomes are in close proximity to the sarcoplasmic reticulum (SR) in rabbit ventricular myocytes, forming nanojunctions.
( A , B ) Representative examples of lysosomes (L) in close proximity to the SR. ( C ) Population data showing the shortest distance from a lysosomal-related organelle membrane to the nearest SR membr...
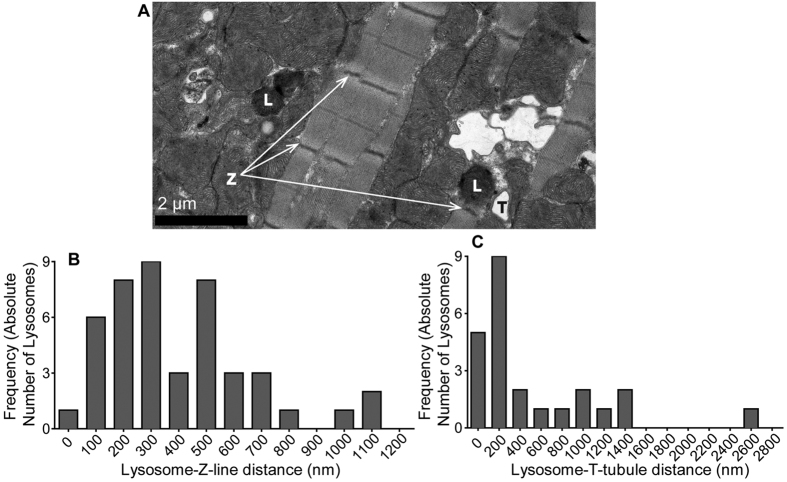
Figure 3
Measured distances from lysosomes to T-tubules and Z-lines.
( A ) Representative wide-field TEM images illustrating lysosomes (L) in relation to T-tubules (T) and Z-lines (Z). ( B ) Population data illustrating the distance between a lysosomes and the nearest ...
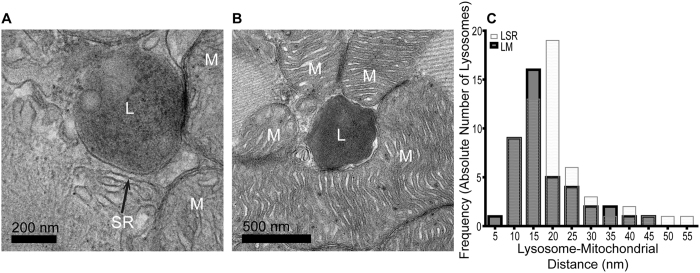
Figure 4
Lysosomes are in close proximity to mitochondria in cardiac ventricular myocytes, feasibly forming nanojunctions.
( A , B ) Representative examples of lysosome (L) in contact with ( A ) and in close proximity to ( B ) mitochondria (M) in isolated rabbit ventricular cardiomyocytes. SRu2009=u2009Sarcoplasmic Reticu...
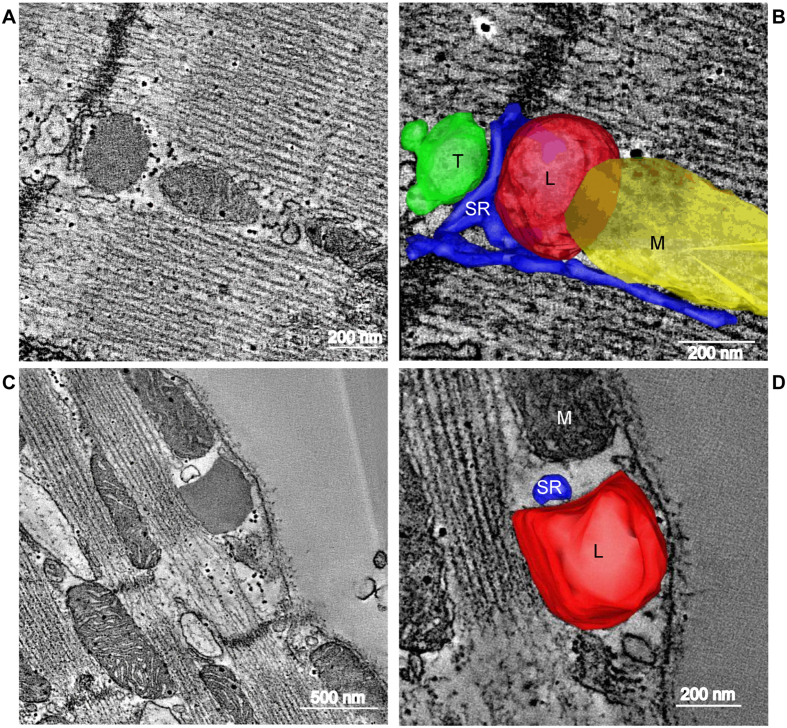
Figure 5
3D Electron Tomography reconstruction of lysosomes, SR, T-tubules and mitochondria.
Representative electron tomography (ET) images of lysosomes near calcium signalling organelles, including raw images ( A , C ) and reconstructed organelles in 3D ( B , D ) of sarcoplasmic reticulum ( ...
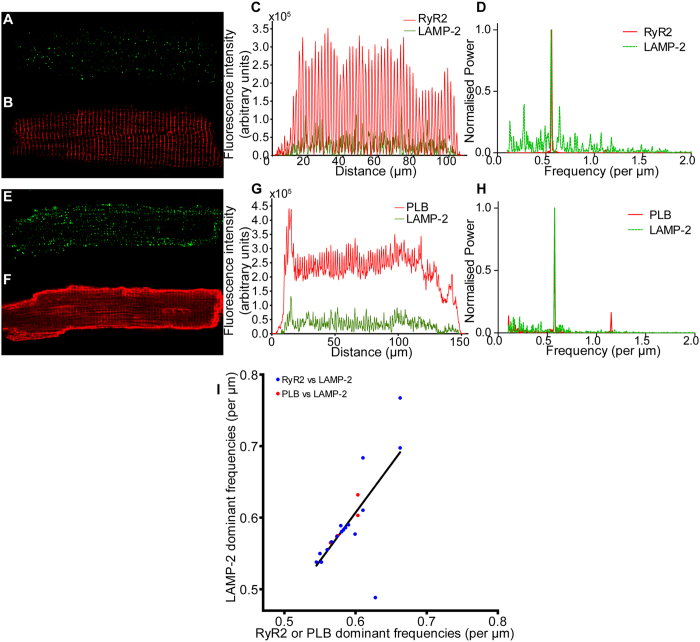
Figure 6
Lysosomes are localised in a periodic pattern with sarcomeric distribution, similar to RyR and PLB, in fixed, isolated rabbit ventricular myocytes.
(Top line) Representative example of LAMP-2 and RyR2 co-labelling experiment. Immunolabelling of LAMP-2 ( A ) and RyR2 ( B ) co-stained in the same, fixed, myocyte. ( C ) Intensity plot illustrating t...
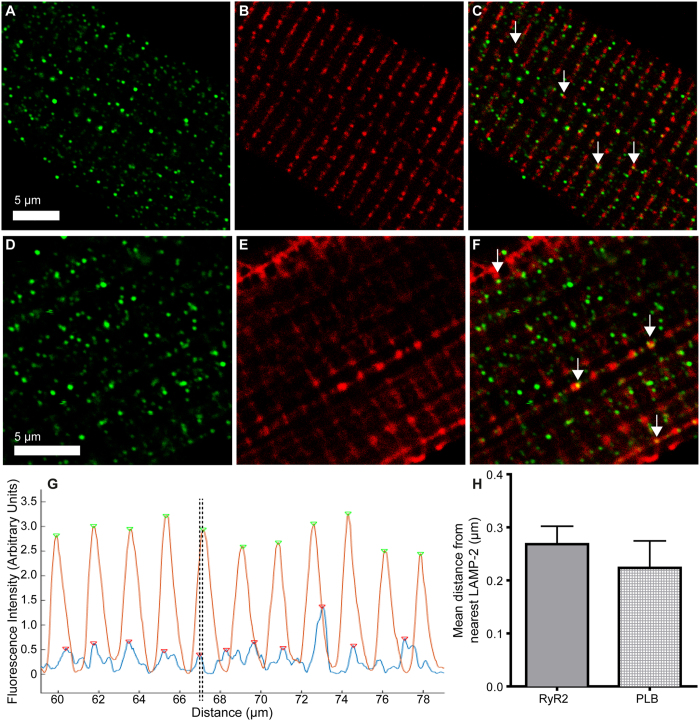
Figure 7
LAMP-2 and RyR2 or PLB are closely aligned but not co-localised in fixed, isolated rabbit ventricular myocytes.
(Top line) Representative immunolabelling of LAMP-2 ( A ) and RyR2 ( B ). ( C ) Merged image. White arrows indicate areas of close proximity. (Middle line) Representative immunolabelling of LAMP-2 ( D...
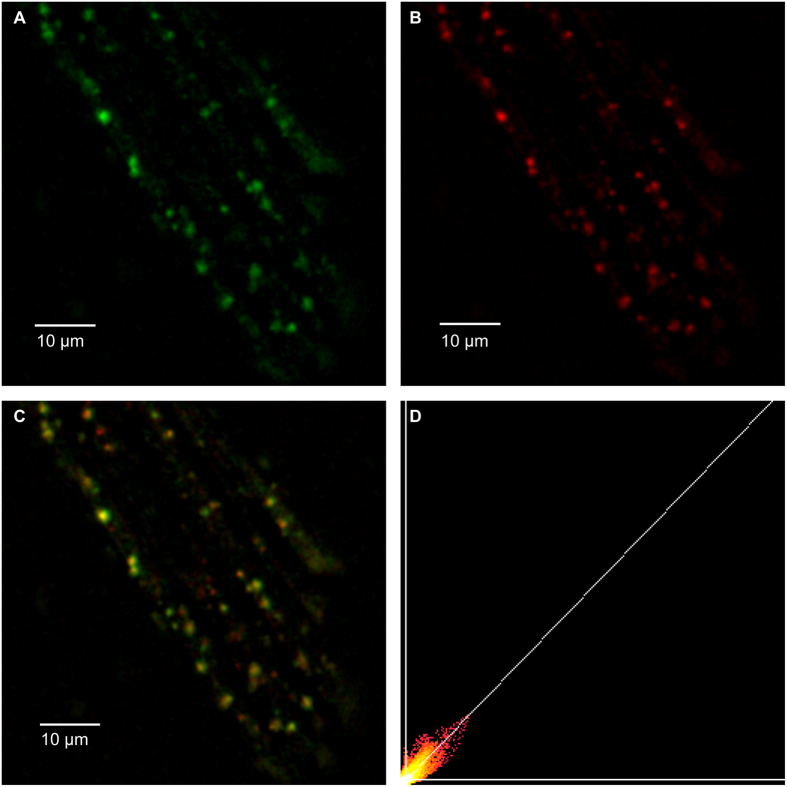
Figure 8
NAADP binding sites co-label with acidic calcium stores in live rabbit ventricular myocytes.
( A ) Punctate staining of Ned-19 (100u2009u03bcM, 40u2009min), a fluorescent NAADP antagonist which binds at the NAADP receptor. ( B ) LysoTracker red (500u2009nM, 2u2009min) labelling of acidic orga...
Figure images are served from the NIH/NLM PubMed Central Open Access Subset or Europe PMC; copyright remains with the publishers and authors.
💬 Discussion
0 commentsNo comments yet. Be the first to start a discussion!
Leave a Comment