Abstract
AbstractHistone H2AX phosphorylation is an early signalling event triggered by DNA double-strand breaks (DSBs). To elucidate the elementary units of phospho-H2AX-labelled chromatin, we integrate super-resolution microscopy of phospho-H2AX during DNA repair in human cells with genome-wide sequencing analyses. Here we identify phospho-H2AX chromatin domains in the nanometre range with median length of ∼75 kb. Correlation analysis with over 60 genomic features shows a time-dependent euchromatin-to-heterochromatin repair trend. After X-ray or CRISPR-Cas9-mediated DSBs, phospho-H2AX-labelled heterochromatin exhibits DNA decondensation while retaining heterochromatic histone marks, indicating that chromatin structural and molecular determinants are uncoupled during repair. The phospho-H2AX nano-domains arrange into higher-order clustered structures of discontinuously phosphorylated chromatin, flanked by CTCF. CTCF knockdown impairs spreading of the phosphorylation throughout the 3D-looped nano-domains. Co-staining of phospho-H2AX with phospho-Ku70 and TUNEL reveals that clusters rather than nano-foci represent single DSBs. Hence, each chromatin loop is a nano-focus, whose clusters correspond to previously known phospho-H2AX foci.
🔬 Techniques
🔭 Microscopes
💻 Software
✨ Fluorophores
🧪 Sample Preparation
🔬 Cell Lines
🏭 Microscope Brands
🧪 Reagent Suppliers
💻 Software Details
💾 Data Repositories
🏛️ Research Organizations (ROR)
Affiliated research institutions:
📋 Methods
Cellular system and experimental strategy validation
For our study, we employed HeLa cells, an established human cell line whose (epi)genome is extensively annotated in the context of the ENCODE project (genome.ucsc.edu/ENCODE/). To test the DDR, we assessed the formation of γH2AX before and after exposure to IR. We investigated the early (0.5 h), mid (3 h) and late (24 h) stages of DDR, which, according to earlier reports 20 , represent 60–100%, 20–60% and less than 10% of the initial DSBs, respectively. Our confocal immunofluorescence analysis of γH2AX revealed that the show endogenous γH2AX signal. This is frequently observed in cancer cell lines and can be attributed to randomly produced DSBs at stalled and collapsed replication forks 21 22 . On exposure to IR, γH2AX followed the predicted repair kinetics, with nuclear γH2AX fluorescence intensity increasing, and then decreasing over time ( Supplementary Fig. 1A ). Similar kinetics was observed by western blot analysis ( Supplementary Fig. 1B ). Together, these methods revealed a four- to eightfold increase in γH2AX signal after IR. Overall, cells were able to activate a DDR and underwent cell cycle arrest, accumulating in S-phase ( Supplementary Fig. 1C ). No apoptosis was detected ( Supplementary Fig. 1D ), and 24 h post IR cells were viable, re-entered the cell cycle ( Supplementary Fig. 1C ) and proliferated, although at a lower rate compared with the mock-irradiated controls ( Supplementary Fig. 1E ). To investigate γH2AX kinetics at high resolution, we recorded super-resolution image sets before and during DDR, and acquired γH2AX ChIP-Seq genome-wide data at matching time points ( Fig. 1a ). In all of our immuno-based approaches, we probed γH2AX-decorated chromatin with the same antibody, whose specificity was verified by slot blot analysis employing the γH2AX-immunizing peptide ( Supplementary Fig. 1F ). The reproducibility of the sequencing data was assessed and confirmed by comparing biological replicates ( Supplementary Fig. 1G ).
Show full methods section
Cellular system and experimental strategy validation
For our study, we employed HeLa cells, an established human cell line whose (epi)genome is extensively annotated in the context of the ENCODE project (genome.ucsc.edu/ENCODE/). To test the DDR, we assessed the formation of γH2AX before and after exposure to IR. We investigated the early (0.5 h), mid (3 h) and late (24 h) stages of DDR, which, according to earlier reports 20 , represent 60–100%, 20–60% and less than 10% of the initial DSBs, respectively. Our confocal immunofluorescence analysis of γH2AX revealed that the show endogenous γH2AX signal. This is frequently observed in cancer cell lines and can be attributed to randomly produced DSBs at stalled and collapsed replication forks 21 22 . On exposure to IR, γH2AX followed the predicted repair kinetics, with nuclear γH2AX fluorescence intensity increasing, and then decreasing over time ( Supplementary Fig. 1A ). Similar kinetics was observed by western blot analysis ( Supplementary Fig. 1B ). Together, these methods revealed a four- to eightfold increase in γH2AX signal after IR. Overall, cells were able to activate a DDR and underwent cell cycle arrest, accumulating in S-phase ( Supplementary Fig. 1C ). No apoptosis was detected ( Supplementary Fig. 1D ), and 24 h post IR cells were viable, re-entered the cell cycle ( Supplementary Fig. 1C ) and proliferated, although at a lower rate compared with the mock-irradiated controls ( Supplementary Fig. 1E ). To investigate γH2AX kinetics at high resolution, we recorded super-resolution image sets before and during DDR, and acquired γH2AX ChIP-Seq genome-wide data at matching time points ( Fig. 1a ). In all of our immuno-based approaches, we probed γH2AX-decorated chromatin with the same antibody, whose specificity was verified by slot blot analysis employing the γH2AX-immunizing peptide ( Supplementary Fig. 1F ). The reproducibility of the sequencing data was assessed and confirmed by comparing biological replicates ( Supplementary Fig. 1G ).
Methods
Cell culture and irradiation Cervical carcinoma
HeLa cells (ATCC No. CCL-2) cells were used throughout the study. A single exposure to 10 Gy X-ray was applied (250 kV, 16 mA, 2.5 Gy min −1 – GE Isovolt Titan) to induce DNA damage and trigger DDR. On exposure to IR, cells were incubated in a humidified environment, with 5% CO 2 at 37 °C as indicated. Sham-irradiated control cells were included. C2C12 (ATCC No CRL-1772) cells were used for CRISPR-Cas9 experiments. HeLa and C2C12 cells were cultured in DMEM (4.5 g l −1 glucose, Biochrom AG) supplemented with 10% and 20% fetal calf serum (Biochrom AG), respectively. All media were supplemented with 2 mM L -glutamine (Sigma), 100 U per ml penicillin and 100 μg ml −1 streptomycin (Sigma). All cell lines were tested for mycoplasma and found free of contamination (MycoAlert, Lonza). Growth curve and cell cycle distribution Cells were seeded 24 h before exposure to IR. After IR, cells were incubated for indicated times, before trypsinization and count with a coulter counter, in triplicates. The remaining cells were then fixed in 2% formaldehyde, permeabilized for 8 min with 0.5% Triton X-100 in PBS, stained with DAPI (1 μg ml −1 ) and analysed at the flow cytometer Partec PAS III system (Partec) for cell cycle distribution. Data were analysed with FlowJo software (Tree Star, Inc.).
Apoptosis assay
To detect apoptosis, TUNEL assay was performed according to the manufacturer's instructions (Roche, #11684795910) and a minimum of 1,000 cells was scored by microscopy in two independent experiments. Spectral karyotyping Cells were treated with colcemid (0.1 μg ml −1 ; Invitrogen, Darmstadt, Germany) 2 h before collecting to accumulate metaphase cells. Chromosome preparations were made according to standard procedures and hybridized with the 24XCyte Multicolor FISH Probe Kit (MetaSystems, Altlussheim, Germany). Metaphase spreads were examined with an Axio Imager Z1 microscope (Zeiss, Oberkochen, Germany) equipped with appropriate filter sets. At least 100 images of metaphases were taken, further processed using ISIS software (MetaSystems) and analysed to produce the karyotype.
CTCF knockdown
A number of 10 5 cells were transfected with 15 nM of a esiRNA pool (Sigma-Aldrich) using HiPerfect (Qiagen). The CTCF esiRNA is corresponding to the region 692–1195 of the human CTCF transcript ( NM_006565.3 ). For mock treatments, cells were transfected using an esiRNA pool (Sigma-Aldrich) targeting the GFP gene. Cells were incubated 24–96 h post transfection and knockdown efficiency was monitored every 24 h.
Immunoblotting
Whole-cell extracts were prepared by freeze and thaw lysis (three cycles) in 600 mM NaCl, 20 mM Tris-HCl pH 7.8, 20% glycerol. After SDS–PAGE, proteins were transferred onto PVDF membrane in semi-dry conditions. The membrane was then blocked in 5% non-fat dry milk buffer and incubated with mouse anti-γH2AX (Clone JBW301, Upstate, 1:5,000). Immunoblots were stained with corresponding HRP-conjugated secondary antibodies (GE Healthcare, 1:20,000) and detected with the enhanced chemiluminescence detection system (Amersham Biosciences). Quantification was performed using ImageJ. For the validation of antibody specificity and cross-reactivity, a dilution series of synthetic peptides (CKATQASQEY; Peptide Specialty Laboratories GmbH), with the underlined serine in either phosphorylated or non-phosphorylated form, was immobilized on a nitrocellulose membrane at the indicated concentrations and probed with anti-γH2AX and anti-H2AX as described above. CTCF knockdown western blots were developed using a rabbit anti-CTCF (#D31H2, Cell Signaling, 1:700) and a mouse anti-actin (AC-40, Sigma-Aldrich, 1:1,000) and overnight incubation at 4 °C, followed by a direct immunofluorescence detection using anti-rabbit-IgG-Cy5 (#711-175-152, Jackson, 1:1,000) and an anti-mouse-IgG-Alexa488 (A11029, Invitrogen, 1:1,000). Images were recorded using a AI600 Imager (Amersham) and quantified using ImageJ.
Immunofluorescence
Cells were fixed in 3.7% formaldehyde and permeabilized in 0.5% Triton X-100 in PBS at room temperature (RT). The following primary antibodies were used: mouse anti-γH2AX (Clone JBW301, 1:500, Upstate), rabbit anti-H3K9me3 (#07–422, Upstate, 1:500), rabbit anti-H3K9me3 (#39161, Active Motif, 1:500), rabbit anti-H3K36me3 (ab9050, Abcam, 1:2,000); rabbit anti-phospho-Ku70 (pS5) (#ab61783, Abcam, 1:400); mouse anti-phospho-ATM (pS1981) (#MAB3806, Millipore, 1:100); rabbit anti-phospho-DNA-PKcs (pS2056) (#ab18192, Abcam, 1:100) and rabbit anti-CTCF (#2899, Cell Signaling, 1:900). For phospho-Ku70 detection cells were prefixed in 1% formaldehyde and then extracted with 0.7% Triton X-100 two times by 5 min 47 and subsequently fixed in 3.7% formaldehyde. Antibody incubation was performed at 4 °C over night in 1% BSA in PBS. For CLSM and 3D-SIM, signals were detected with goat anti-mouse-IgG-AlexaFluor 488, goat anti-rabbit-IgG-AlexaFluor 594 (1:800, Invitrogen), donkey anti-mouse-IgG-AlexaFluor 488 (A-21202, Thermo Fisher Scientific, 1:400), donkey anti-rabbit-IgG-AlexaFluor 594 (A-21207, Thermo Fisher Scientific, 1:400). For STED, γH2AX was detected with goat anti-mouse-IgG STAR 635P (#2-0002-007-5, Abberior, 1:100) or goat anti-mouse-IgG STAR 580 (#2-0002-005-1, Abberior, 1:100). DNA was counterstained with 36 nM DAPI (for 3D-SIM), 1 μM propidium iodide (confocal microscopy) or 2.5 μM SiR-DNA (Spirochrome), before cells were mounted with Vectashield antifade medium (Vectorlabs). CRISPR-Cas9 targeting to heterochromatic major satellite DNA Subconfluent C2C12 cells were transfected with Cas9 (pCMV-hCas9, Addgene ID: 41815) and major satellite gRNAs (U6-MaSgRNA) by means of Lipofectamine 3000 (Thermo Fisher Scientific) according to the manufacturer's instructions. Cells were then fixed in 3.7% formaldehyde for 10 min and immunofluorescence followed (as described above).
DNA DSB detection by TUNEL assay
Cells were grown and irradiated as described above. At the indicated time points, cells were fixed in 3.7% paraformaldehyde for 10 min. The fixation was quenched with 125 mM glycine in PBS for 10 min. Fixed cells where permeabilized in 0.5% Triton X-100 for 20 min, and equilibrated for 10 min in blunting buffer (100 mM Tris-HCl, 50 mM NaCl, 10 mM MgCl 2 , 0.025% Triton X-100 and 5 mM DTT, pH 7.5). End repair was performed using 4 μl T4 polymerase (NEB: M0203S 3,000 units ml −1 ) and 4 μl T4 polynucleotide kinase (NEB: M0201S 10,000 units ml −1 ) in 82 μl blunting buffer, supplemented with 10 μl 1 mM dNTPs for 45 min. Slides were then equilibrated in TdT buffer for 10 min and the TUNEL reaction was performed according to the ‘In Situ Cell Death Detection Kit' (Roche) with Fluorescein modified dUTPs, for 4 h at 37 °C according to the manufacturer's instructions. Following the TUNEL reaction, cells were blocked in 1% BSA in PBS for 20 min. γH2AX staining was performed as described above. Incorporated fluorescein-dUTPs were detected by a rabbit anti-FITC (CUSABIO, 1:500) and a anti-rabbit-IgG Alexa488 secondary antibody (Jackson ImmunoResearch, 1:800). All steps were conducted at RT, unless otherwise specified.
Comet assay
DNA repair kinetics in CTCF knockdown cells were measured using the neutral comet assay. In brief, CTCF was depleted as described above and 72 h post esiRNA transfection, the cells were exposed to 10 Gy X-ray. At the indicated time points, cells were trypsinized and 2 × 10 5 cells ml −1 were embedded in 0.8% low-melting point agarose (Sigma type VII). Lysis was performed for 4 h at 4 °C in lysis buffer (10 mM Tris, 150 mM NaCl, 1% N-lauryl-sarcosinate, 1% Triton X-100, 0.5% DMSO, pH 8.0) and electrophoresis was done in 1 × TBE at 4 °C (1 V cm −1 ) for 25 min. Slides were then dehydrated in 70% ethanol and rehydrated in staining buffer (TBE supplemented with SybrGreen, 1:10,000) to stain the DNA 48 . Two biological replicates (in duplicates) were performed and 60 comets per slide were scored using Komet 4 (Kinetic Imaging Ltd.).
Microscopy
Confocal microscopy images were acquired using a Spinning Disk microscope (Perkin Elmer Vox1000) equipped with a × 60 NA 1.4 oil immersion lens (CFI Apochromat TIRF), with a pixel size of 120 nm or with a Leica TCS SP5 confocal microscope using a Plan Apo × 63 NA 1.4 oil immersion objective. Cells were recorded as z-stacks with a z-spacing of 0.2 μm. Super-resolution microscopy images were acquired using a 3D structured illumination microscope (DeltaVision OMX V3, GE Healthcare) and a 2C STED 775 QUAD Scan microscope (Abberior Instruments). 3D-SIM was performed with a × 100 NA 1.4 objective lens with a pixel size of 39 nm and a z-spacing of 125 nm (ref. 18 ). STED was performed with a × 100 NA 1.4 Olympus UPlanSApo objective lens with a pixel size of 20 nm and excitation lasers of 488, 594 or 640 nm, and a 775 nm depletion laser. High-content imaging was performed using the Operetta system (Perkin Elmer). Samples were imaged using a × 20 NA 0.45 air objective with three planes of 1 μm spacing, using the following filters: DAPI: excitation wavelength (ex): 360–400 nm, emission wavelength (em): 420–480 nm; Alexa488: ex: 460–490 nm, em: 500–550 nm; Alexa594: ex: 560–580 nm, em: 590–640 nm.
Image analysis
For confocal microscopy, the images were analysed in ImageJ using the nuclear staining as a mask to measure the total intensity of the γH2AX signal per nucleus. Foci were scored in 3D using Volocity (Perkin Elmer) by the following workflow: find objects (nucleus), threshold automatic, size minimum 500 μm 3 ; find foci: threshold 4,000 constant for pseudo-wide-field and 5,000 for deconvolved images, respectively. Minimum size: 0.05 μm 3 , followed by ‘separate touching objects' with a guide size of 0.5 μm 3 . Different thresholds were applied, because pseudo-wide-field and deconvolved images are in different bit depth. All counts were double-checked by manual counting of randomly chosen samples by at least three experimenters. For CRISPR-Cas9 experiments, confocal images of C2C12 cells were segmented into background, nuclei and chromocentres by pixel-wise classification via supervised machine learning (default Random Forest classifier and pixel features from the Trainable Weka Segmentation plugin in Fiji). The classifier was trained on manually labelled pixels of the DAPI channel in one image and then applied to all images. For each image, mean intensities in the H3K9me3 and γH2AX channels were determined for each chromocentre object (>100 px 2 ) within the largest object in the nuclear mask. To analyse DNA decondensation at repair sites in CRISPR-Cas9 experiments STED images of C2C12 cells were segmented into background, nuclei and chromocentres by pixel-wise classification as described above for confocal images. The classifier was trained on manually labelled pixels of the SiR-DNA channel in one image and then applied to all images (each image's pixel intensity range was mapped to the 8-bit range to account for differences in staining intensities). For each image, the circularity of chromocentre objects (>100 px 2 ) within the nucleus was determined. Three rounds of binary erosion with a 3 × 3 px-box followed by three rounds of binary dilation were applied to the segmentation results to smooth the borders of segmented objects. 3D-SIM images were exported from the DeltaVision software (softWoRx 6.0 Beta 19, Applied Precision) and converted to 16-bit images per channel. Foci counting was done using Volocity 6.3 (Perkin Elmer) or with the 3D foci picker plugin in ImageJ (imagej.nih.gov/ij/). Nearly identical results were obtained and the numbers from Volocity were used. In detail, the individual z-sections were imported and merged to a volume with the above-mentioned pixel sizes and z-spacing. First, the nucleus was identified by setting a manual threshold and a lower volume limit of 200 μm 3 followed by a ‘Fill in Holes' step and two iterations of ‘Dilate' and ‘Close' to fill in all the DAPI weak volumes. The intensities and voxel coordinates of the whole nucleus were registered. Next, the γH2AX and H3K36me3 or H3K9me3 foci were identified with a lower threshold of 1,000 and a minimum object size of 0.001 μm 3 . To separate close spaced objects, a final ‘Separate Touching Objects' step with a nominal volume of 0.05 μm 3 was used. The foci identified were restricted to the previously defined nuclear volume to remove possible unspecific signals from outside of the nucleus. 3D-SIM pseudo-wide-field imaging: after sample acquisition, the pseudo-wide-field images were calculated using softWoRx 6.0 Beta 19 according to the following workflow: the raw data from each 3D-SIM image z-stack was subdivided to isolate the first angle of acquisition. To this purpose, the maximum number of z-sections in each individual stack is divided by three. Then the projected five grid shifted section is averaged per z-position and colour channel. After that, the voxel dimensions are adjusted from 0.625 to 0.125 μm in the z-dimension by adjusting the file headers. The alignment of the new stack was done with the parameters used for 3D-SIM reconstruction. The following parameters of the softWoRx software were used: normalize intensity, use photosensor, correct bleaching, replace z-lines and smooth z-lines. To reverse the optical distortion in the images, the aligned 3D stack was deconvolved with the instrument-specific optical transfer function (OTF) with the following settings: ‘enhanced ratio (aggressive)' and ‘noise filtering medium'. For CTCF distance analysis, the previously described protocol was extended as follows: CTCF domains detection was restricted to the nuclear volume, with an automated threshold and a minimum size of 0.001 μm 3 . Then, the segmented γH2AX nano-foci were extended in all dimensions by three voxels (117 × 117 × 375 nm) and the resulting γH2AX nano-foci volume was subtracted to obtain the γH2AX foci shells. Finally, the Euclidian distances between each γH2AX nano-focus and the closest CTCF domain were measured. All identified foci with the corresponding 3D coordinates and intensities for all recorded channels were exported and post-processed in R 49 . ImageJ and UCSF chimera 50 were used for image visualization and 3D rendering, respectively. Simulations of CTCF and γH2AX distributions were run under R, using rgl and sphereplot packages. Hundred simulations of a sphere matching the average nuclear size of cells were run per time point. Every simulation contained objects whose numbers matched CTCF and γH2AX foci we recorded in 3D-SIM images. For STED images, object dimensions (for example, diameters) were measured by manual object segmentation of randomly selected foci in ImageJ, using the analyse particle tool. For high-content images, analysis was performed using Harmony software (Perkin Elmer) with the following workflow: maximum projection of the planes, flatfield correction, find nuclei in DAPI channel, method M, splitting coefficient 0.1, general threshold 0.4 and guide size of 15 μm in diameter. Calculate intensity and morphology parameters for the nuclei. Discard nuclei touching the border, smaller than 100 μm 2 and larger than 350 μm 2 . Filter nuclei for roundness >0.83 and with a 4 px Haralick contrast >0.8 and a DAPI signal CV of less than 30%. Measure the mean and integrated intensity for DAPI, γH2AX and CTCF in the selected nuclei areas. ChIP Cells were fixed with 1% formaldehyde for 10 min at RT and cross-link was quenched with 125 mM glycine (5 min at RT). Nuclei were isolated after mild lysis in hypotonic buffer (10 mM HEPES pH 8, 1.5 mM MgCl 2 , 60 mM KCl) and 20 strokes in a tight dounce homogenizer. Chromatin was sheared in sonication buffer (0.5% SDS, 10 mM EDTA, 50 mM Tris-HCl pH 8.1). Fragmentation of chromatin was carried out by ultrasound treatment (Bioruptor UCD200) so that fragments of 200–300 bp length were obtained. Chromatin from 1 × 10 6 –2 × 10 6 cells was immunoprecipitated with anti-γH2AX (Clone JBW301, Upstate, 3 μg) antibody. Chromatin was then incubated ON at 4 °C with protein G-coated magnetic beads (ChIP-IT Express, Active Motif). The collected chromatin (ChIP sample) was then reverse-crosslinked in the presence of 200 mM NaCl at 65 °C for at least 5 h, followed by RNase A (50 μg ml −1 ) treatment for 30 min at 37 °C and proteinase K (100 μg ml −1 ) treatment for 3 h at 50 °C. DNA elution was carried out in 1% SDS, 100 mM NaHCO 3 , in a rotary shaker at RT for 15 min. Pure DNA was isolated using the Qiagen PCR purification kit and 15–30 ng of size selected DNA fragments (Qubit fluorometric quantification) were used to produce ChIP-seq libraries (Illumina ChIP-Seq DNA sample Prep Kit). Input sample was essentially prepared following the same protocol, but the immunoprecipitation step was skipped.
Next-generation sequencing and data analyses
ChIP-Seq libraries were processed through a high-throughput sequencing pipeline (Illumina Genome Analyzer II). Reads were mapped to the human genome (University of California, Santa Cruz (UCSC) hg19 assembly, based on the National Center for Biotechnology Information (NCBI) build 37.1) by means of SOAP2 software 51 , allowing up to two mismatches for each 36 bp read. All data sets were deposited in the Gene Expression Omnibus database (accession number: GSE60526 ). All γH2AX ChIP-Seq tracks were smoothed with a moving average of five intervals before further analysis. Genomic features and correlation analysis: all genomic features data were retrieved from publicly available databases (UCSC) ( Supplementary Table 3 ). Most of the data were generated in HepG2 cells, but not all. Data that were originally generated in the hg18 assembly were transposed to hg19 using LiftOver ( http://genome.ucsc.edu/cgi-bin/hgLiftOver ). Reads per kilobase per million reads (RPKM) 52 were calculated for non-overlapping 10 kb genomic intervals for all sequence tracks. The features were further normalized to the corresponding genome-wide average and correlation with γH2AX tracks was performed (Spearman's ρ correlation coefficient with P
📊 Figures
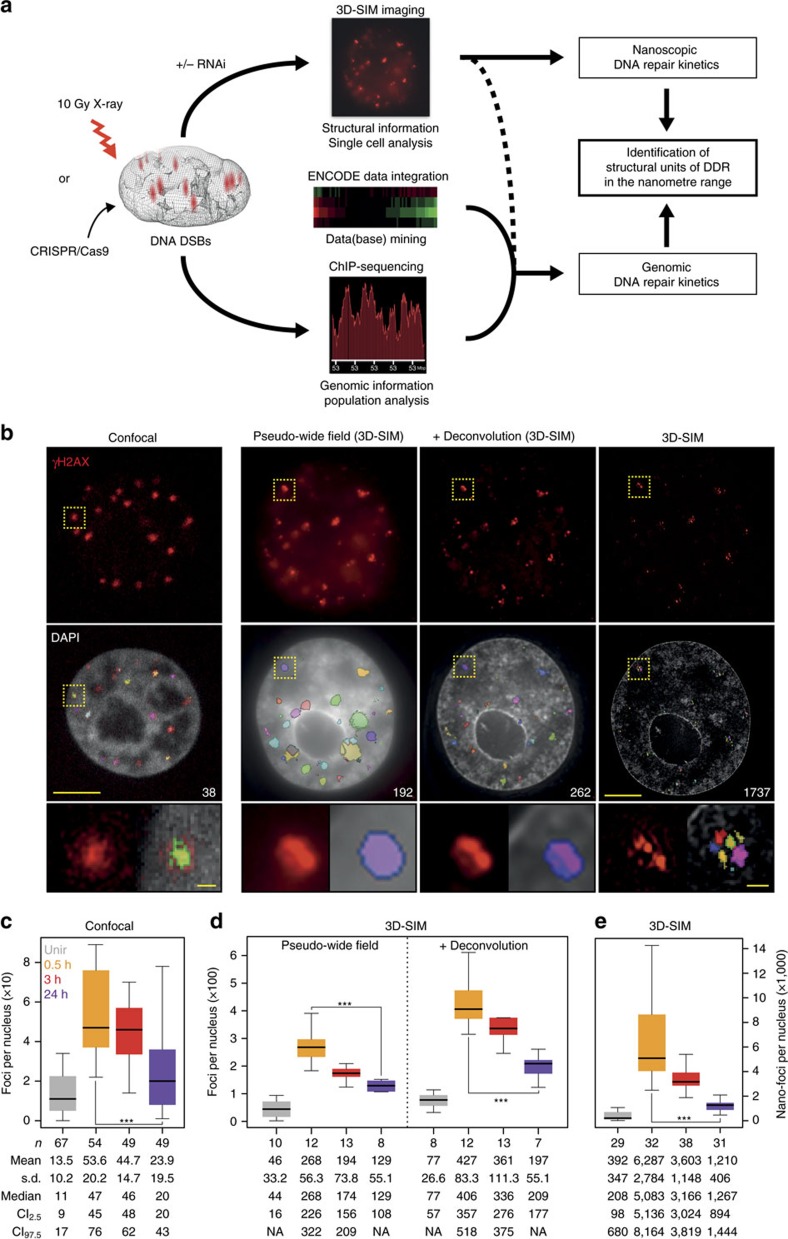
Figure 1
Characterization of u03b3H2AX foci at different resolution levels.
( a ) Schematics of the experimental approach. ( b ) Mid-nuclear sections of confocal microscopy ( z : 200u2009nm) and 3D-SIM ( z : 125u2009nm) representative images of cells, 24u2009h post IR. Only f...
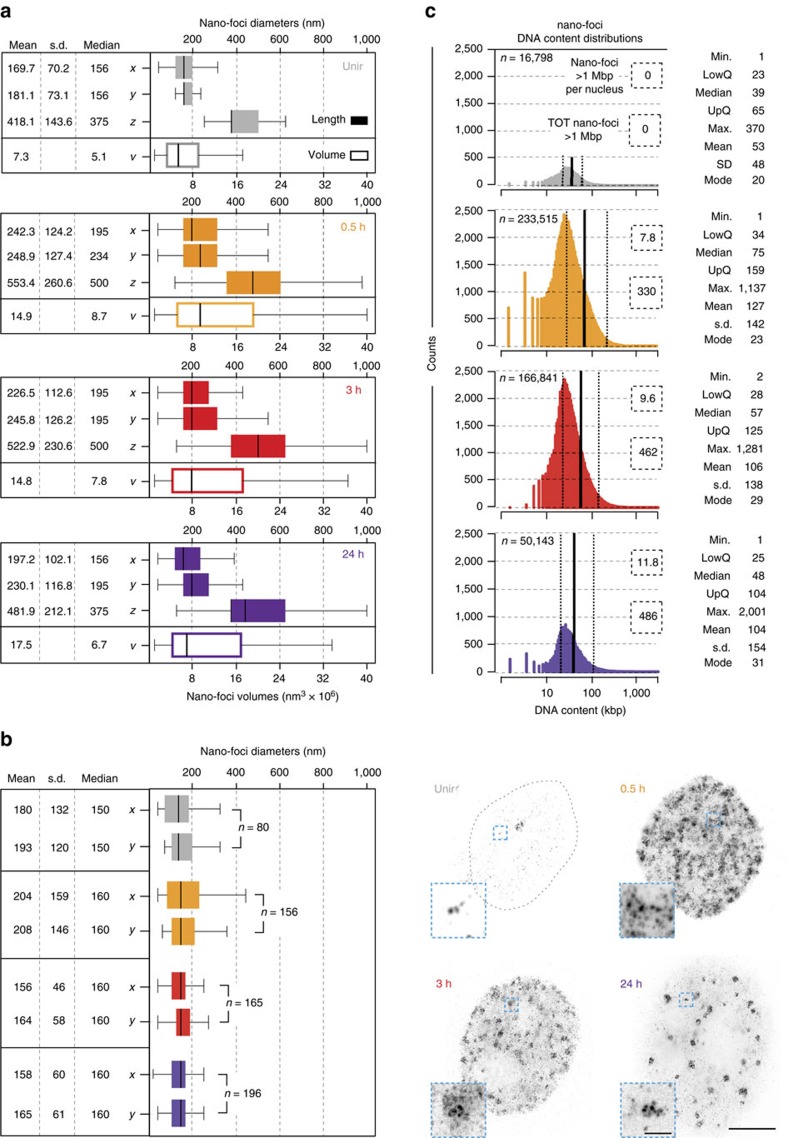
Figure 2
Metrics of u03b3H2AX nano-foci dimensions and DNA content.
( a ) Quantification of nano-foci diameters in the three dimensions (filled boxes, top) during DDR. From these three dimensions, the volumes were calculated (empty boxes, bottom). The difference betwe...
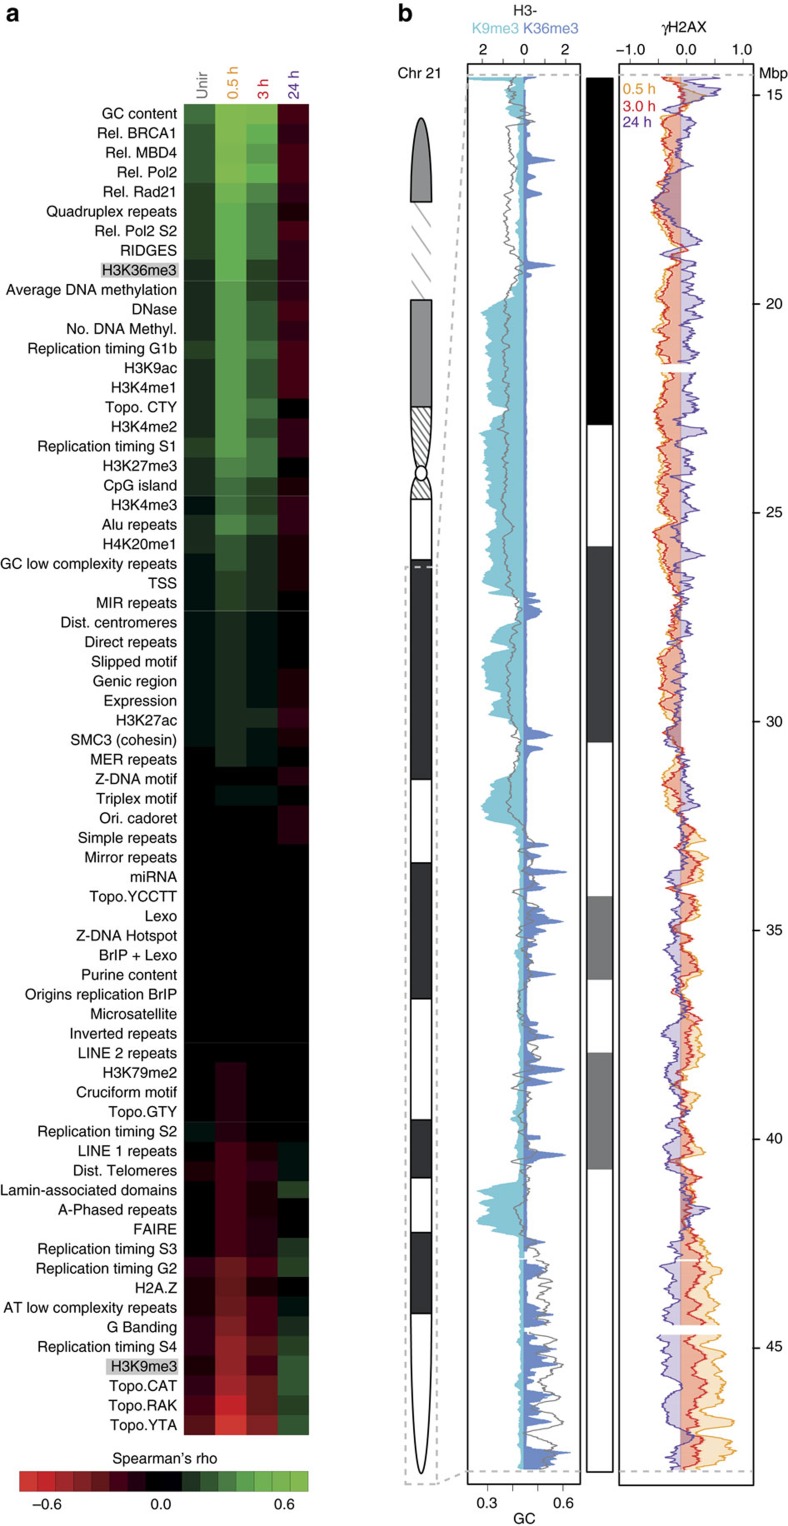
Figure 3
Temporal correlation of u03b3H2AX ChIP-Seq signal and genomic features.
( a ) Genome-wide correlation between ChIP-Seq u03b3H2AX profiles and genomic features, before and during DDR. Spearman's u03c1 correlation coefficient is calculated between 10u2009kb-binned u03b3H2AX...
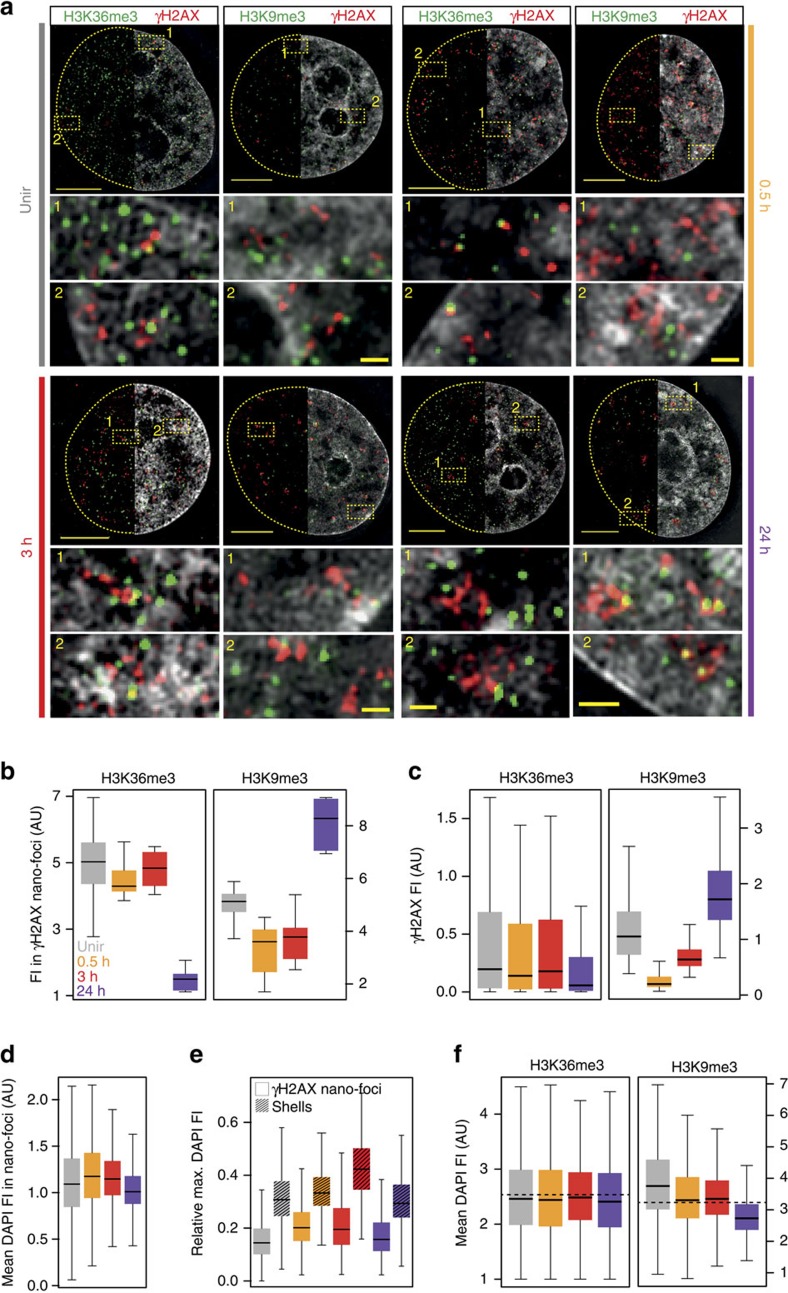
Figure 4
3D-SIM chromatin composition analysis of u03b3H2AX nano-foci before and during DDR.
( a ) Exemplary 3D-SIM images of u03b3H2AX (red) and H3K9me3/H3K36me3 (green) co-immunostaining before and after IR. Top panels: mid-nuclear sections showing u03b3H2AX and histone marks with (right ha...
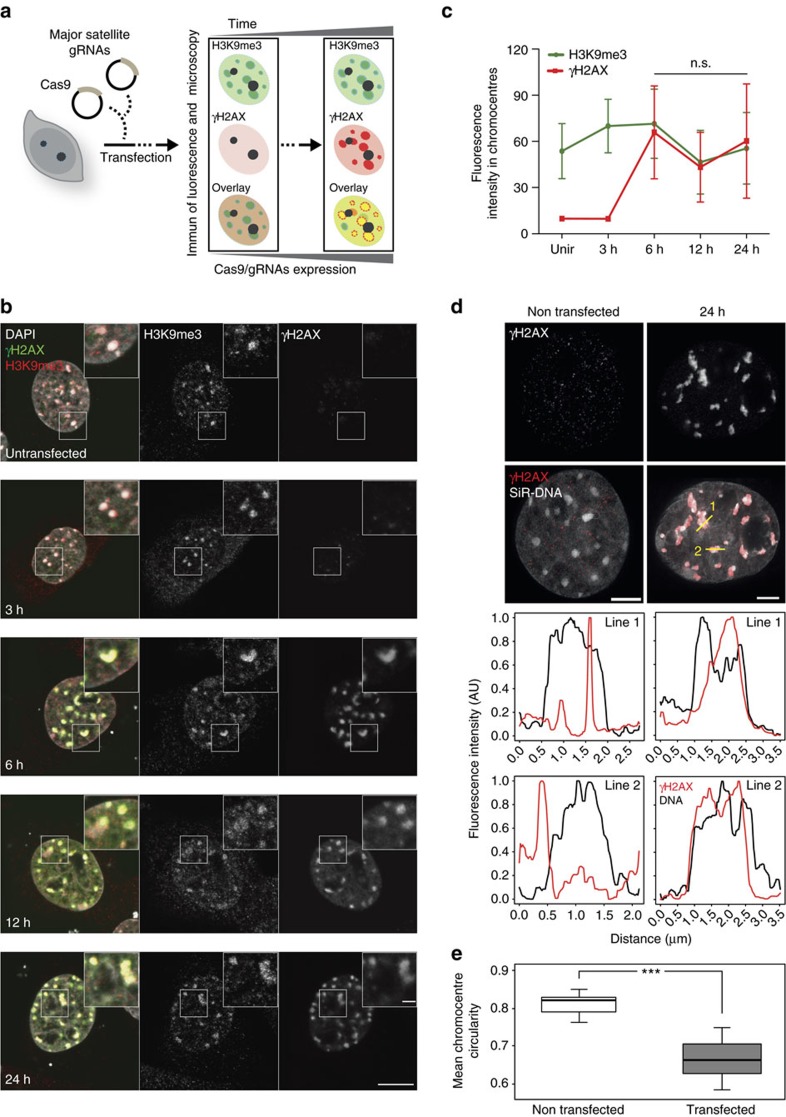
Figure 5
Analysis of u03b3H2AX and H3K9me3 levels at heterochromatin-targeted CRISPR-Cas9-mediated DSBs.
( a ) Schematics of the CRISPR-Cas9-mediated DSBs induction at murine major satellites DNA. C2C12 cells were transfected with Cas9 and major satellites gRNAs plasmids and fixed after the indicated tim...
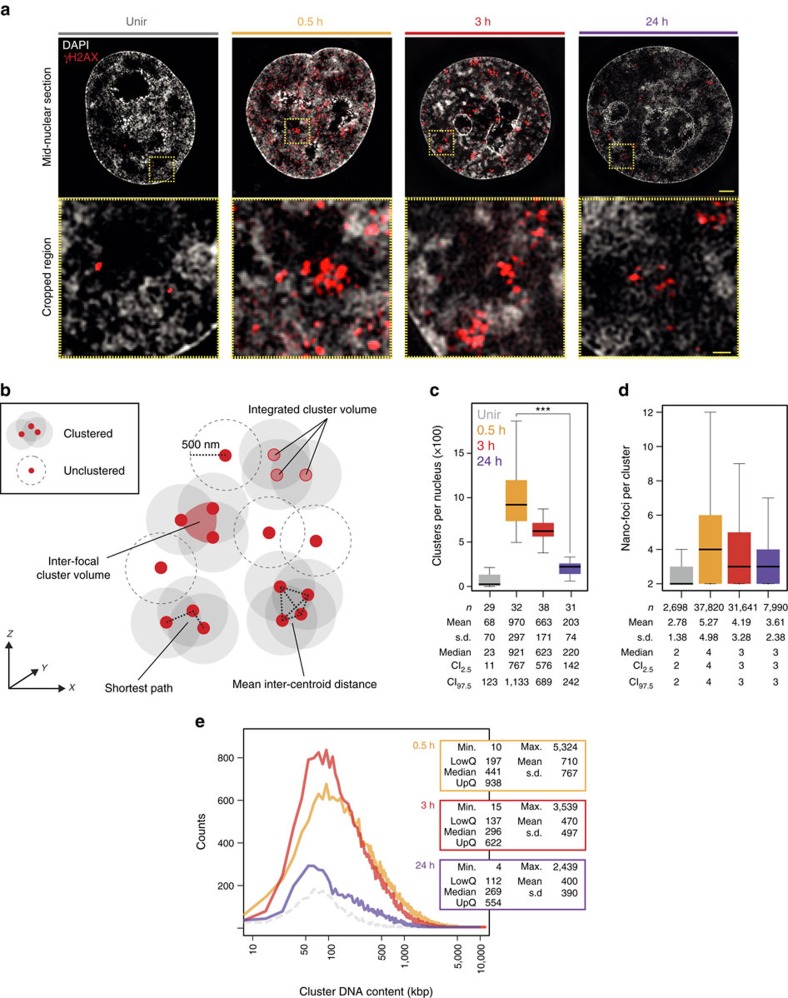
Figure 6
Analysis of u03b3H2AX nano-foci spatial clustering.
( a ) Exemplary 3D-SIM images of u03b3H2AX immunofluorescence before and during DDR. Shown are the mid-nuclear section with DAPI and u03b3H2AX signals, and magnified view from the yellow frame. Scale ...
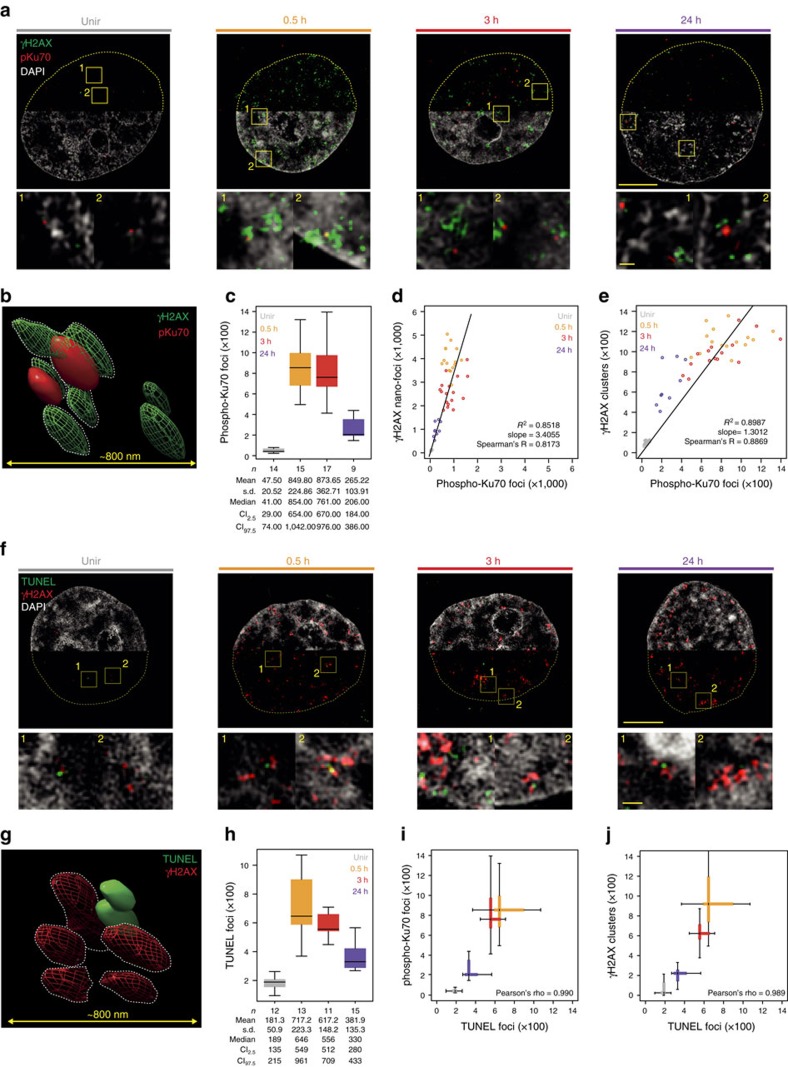
Figure 7
Single phospho-Ku70- or TUNEL-labelled DNA DSBs are embedded in u03b3H2AX clusters.
( a ) Exemplary 3D-SIM images of u03b3H2AX and phospho-ku70 immunofluorescence before and during DDR. Shown are the mid-nuclear section (top) and enlarged views from the yellow frames (bottom). ( b ) ...
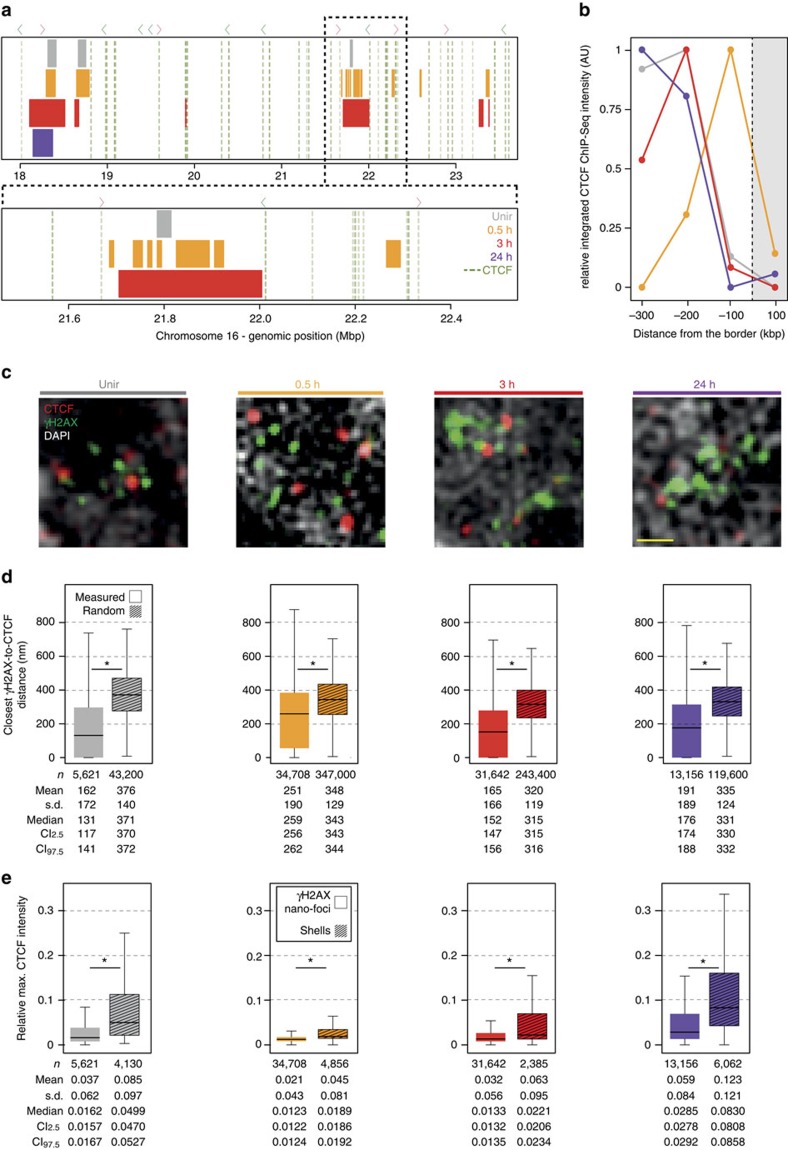
Figure 8
Genomic and microscopic analysis of CTCF spatial distribution in u03b3H2AX-decorated chromatin.
( a ) Genomic localization of u03b3H2AX ChIP-Seq domains (coloured bars) and CTCF genomic footprint (dashed green lines) in a representative region of chromosome 16. Dashed black line: magnification. ...
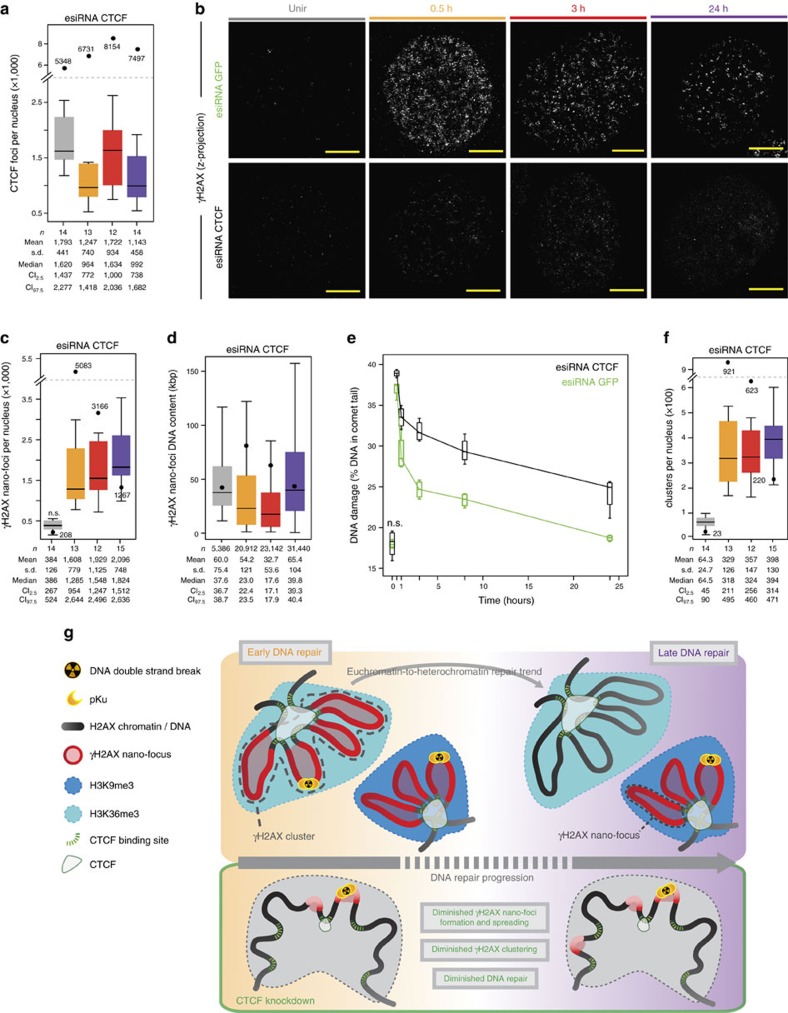
Figure 9
CTCF depletion inhibits u03b3H2AX nano-foci and cluster formation and diminishes the DNA repair capability.
( a ) Number of CTCF foci in esiRNA-depleted cells before and during DDR. Black dots: median number of CTCF foci in wild-type cells. ( b ) Impairment of u03b3H2AX nano-foci and 3D-clusters formation d...
Figure images are served from the NIH/NLM PubMed Central Open Access Subset or Europe PMC; copyright remains with the publishers and authors.
💬 Discussion
0 commentsNo comments yet. Be the first to start a discussion!
Leave a Comment