Abstract
Materials whose luminescence can be switched by optical stimulation drive technologies ranging from superresolution imaging1-4, nanophotonics5, and optical data storage6,7, to targeted pharmacology, optogenetics, and chemical reactivity8. These photoswitchable probes, including organic fluorophores and proteins, can be prone to photodegradation and often operate in the ultraviolet or visible spectral regions. Colloidal inorganic nanoparticles6,9 can offer improved stability, but the ability to switch emission bidirectionally, particularly with near-infrared (NIR) light, has not, to our knowledge, been reported in such systems. Here, we present two-way, NIR photoswitching of avalanching nanoparticles (ANPs), showing full optical control of upconverted emission using phototriggers in the NIR-I and NIR-II spectral regions useful for subsurface imaging. Employing single-step photodarkening10-13 and photobrightening12,14-16, we demonstrate indefinite photoswitching of individual nanoparticles (more than 1,000 cycles over 7 h) in ambient or aqueous conditions without measurable photodegradation. Critical steps of the photoswitching mechanism are elucidated by modelling and by measuring the photon avalanche properties of single ANPs in both bright and dark states. Unlimited, reversible photoswitching of ANPs enables indefinitely rewritable two-dimensional and three-dimensional multilevel optical patterning of ANPs, as well as optical nanoscopy with sub-Å localization superresolution that allows us to distinguish individual ANPs within tightly packed clusters.
🔬 Techniques
✨ Fluorophores
🧪 Sample Preparation
🏭 Microscope Brands
🧪 Reagent Suppliers
📷 Detectors
🔎 Objectives
🎨 Filters
💻 Software Details
🏛️ Research Organizations (ROR)
Affiliated research institutions:
📋 Methods
Method of photoswitchable probe characterization
We characterized the switching properties using dye-labeled proteins that were adsorbed to coverglass and illuminated with light at 488 nm, 561 nm, 647 nm, or 752 nm, to excite blue, yellow, red, or NIR dyes, respectively. Under these conditions, many fluorophores reversibly transition between on and off states with a characteristic duty cycle and number of emitted photons per switching event. Although it is often convenient to use an additional “activation laser” to increase the on-switching rate and hence speed up the imaging process, the on/off duty cycle determined in the absence of the activation laser represents the lowest achievable duty cycle for a dye and thus sets the resolution limit based on the Nyquist criterion. The number of detected photons per switching event is typically the same independent of whether an additional activation light is used. For each dye, we determined four switching properties: (i) number of photons detected per switching event; (ii) on/off duty cycle; (iii) survival fraction; and (iv) number of switching cycles. We recorded the number of photons detected in each switching event for many molecules, from which we constructed a photon number histogram and determined the mean value. The on/off duty cycle was measured as the fraction of time spent in the on state averaged over many molecules. Because the molecules were originally in the on state and a certain illumination time is required for them to reach a quasi-equilibrium between the on and off states, we used a sliding window of 100 sec to monitor changes in the on/off duty cycle as a function of exposure time. The duty cycle value during the time window 400–600 sec was used to represent the characteristic, equilibrium duty cycle because the dyes typically achieved quasi-equilibrium between on and off states by this point. Since some dyes switched for a limited number of cycles before photobleaching, a substantial fraction of molecules may be photobleached by the time the on/off equilibrium is reached. We therefore also characterized the survival fraction of unbleached molecules as a function of illumination time. This quantity can be used together with the time-dependent duty cycle value to determine what degree of photobleaching has occurred prior to achieving a sufficiently low density to resolve single molecules. Finally, we also determined for each molecule the number of switching cycles during the data acquisition time, which represents a lower bound value given that some molecules did not photobleach before the end of the observation period. We correlated the above properties with the quality of STORM images for each dye by recording images of different cellular structures, including microtubules which have a linear (or cylindrical) morphology, and clathrin-coated pits (CCPs) which have a spherical morphology. Because the switching performance and photostability of many dyes are enhanced by the presence of a primary thiol and/or a low oxygen environment, we performed experiments in the presence of an enzymatic oxygen scavenging system and a primary thiol, either β-mercaptoethanol (βME) or mercaptoethylamine (MEA), unless otherwise indicated. Figure 2d–l illustrates our method of dye characterization, using Alexa 647, Atto 655, and Cy5.5 as representative examples. We show examples of single-molecule fluorescence time traces ( Fig. 2d–f , Supplementary Fig. 1 ), histograms of photon number distributions ( Fig. 2g,i,k ), and duty cycle plots along with the corresponding survival fractions ( Fig. 2h,j,l ). The dyes exhibited three distinct switching behaviors: high photon yield per switching event and low duty cycle (Alexa 647); low photon yield and low duty cycle (Atto 655); and high photon yield and high duty cycle (Cy5.5).
Show full methods section
Method of photoswitchable probe characterization
We characterized the switching properties using dye-labeled proteins that were adsorbed to coverglass and illuminated with light at 488 nm, 561 nm, 647 nm, or 752 nm, to excite blue, yellow, red, or NIR dyes, respectively. Under these conditions, many fluorophores reversibly transition between on and off states with a characteristic duty cycle and number of emitted photons per switching event. Although it is often convenient to use an additional “activation laser” to increase the on-switching rate and hence speed up the imaging process, the on/off duty cycle determined in the absence of the activation laser represents the lowest achievable duty cycle for a dye and thus sets the resolution limit based on the Nyquist criterion. The number of detected photons per switching event is typically the same independent of whether an additional activation light is used. For each dye, we determined four switching properties: (i) number of photons detected per switching event; (ii) on/off duty cycle; (iii) survival fraction; and (iv) number of switching cycles. We recorded the number of photons detected in each switching event for many molecules, from which we constructed a photon number histogram and determined the mean value. The on/off duty cycle was measured as the fraction of time spent in the on state averaged over many molecules. Because the molecules were originally in the on state and a certain illumination time is required for them to reach a quasi-equilibrium between the on and off states, we used a sliding window of 100 sec to monitor changes in the on/off duty cycle as a function of exposure time. The duty cycle value during the time window 400–600 sec was used to represent the characteristic, equilibrium duty cycle because the dyes typically achieved quasi-equilibrium between on and off states by this point. Since some dyes switched for a limited number of cycles before photobleaching, a substantial fraction of molecules may be photobleached by the time the on/off equilibrium is reached. We therefore also characterized the survival fraction of unbleached molecules as a function of illumination time. This quantity can be used together with the time-dependent duty cycle value to determine what degree of photobleaching has occurred prior to achieving a sufficiently low density to resolve single molecules. Finally, we also determined for each molecule the number of switching cycles during the data acquisition time, which represents a lower bound value given that some molecules did not photobleach before the end of the observation period. We correlated the above properties with the quality of STORM images for each dye by recording images of different cellular structures, including microtubules which have a linear (or cylindrical) morphology, and clathrin-coated pits (CCPs) which have a spherical morphology. Because the switching performance and photostability of many dyes are enhanced by the presence of a primary thiol and/or a low oxygen environment, we performed experiments in the presence of an enzymatic oxygen scavenging system and a primary thiol, either β-mercaptoethanol (βME) or mercaptoethylamine (MEA), unless otherwise indicated. Figure 2d–l illustrates our method of dye characterization, using Alexa 647, Atto 655, and Cy5.5 as representative examples. We show examples of single-molecule fluorescence time traces ( Fig. 2d–f , Supplementary Fig. 1 ), histograms of photon number distributions ( Fig. 2g,i,k ), and duty cycle plots along with the corresponding survival fractions ( Fig. 2h,j,l ). The dyes exhibited three distinct switching behaviors: high photon yield per switching event and low duty cycle (Alexa 647); low photon yield and low duty cycle (Atto 655); and high photon yield and high duty cycle (Cy5.5).
METHODS
Methods and any associated references are available in the online version of the paper at http://www.nature.com/naturemethods/ .
METHODS Dyes and antibodies
Dyes were obtained from Amersham (Cy2, Cy3, Cy3B, Cy3.5, Cy5, Cy5.5, Cy7), Invitrogen (Alexa 488, Alexa 568, Alexa 647, Alexa 750, Alexa 790), ATTO-TEC (Atto 520, Atto 565, Atto 647, Atto 655, Atto 680, Atto 740), Sigma (Atto 488, Atto 647N), Anaspec (5(6)-TAMRA), Pierce (FITC, fluorescein, DyLight 750), Dyomics (Dyomics 654), and LI-COR (IRDye 800CW). All purchased dyes contained an N-hydroxysuccinimidyl ester (NHS) group for conjugation to protein, with the exception of FITC, which contains an isothiocyanate moiety for protein coupling. Primary antibodies were purchased from: Abcam (mouse anti-clathrin, ab2731; rat anti-tubulin, ab6160; mouse anti-acetylated tubulin, ab24610; goat anti-myc, ab9132), and Santa Cruz Biotechnology (rabbit anti-TOM20, sc-11415). Unconjugated secondary antibodies were purchased from Jackson ImmunoResearch Laboratories, including donkey anti-mouse (715-005-151), donkey anti-rat (712-005-153), donkey anti-rabbit (711-005- 152), and bovine anti-goat (805-005-180).
Fluorescence microscope
All single-molecule and imaging measurements were performed on an Olympus IX-71 inverted microscope configured for either total internal reflection fluorescence (TIRF) or oblique incidence excitation. In the oblique incidence geometry, the incidence angle was slightly below the critical angle such that the excitation light illuminated 1–2 µm deep into the sample in the field of view. The samples were continuously illuminated using different excitation sources depending on the fluorophore used. Blue- and red-absorbing dyes were excited using the 488 nm and 647 nm lines of a mixed-gas argon-krypton laser (Innova 70C; Coherent), respectively; yellow-absorbing dyes were excited with a 561 nm diode-pumped solidstate laser (Sapphire 561; Coherent); NIR-absorbing dyes were excited using the 752 nm line of a krypton laser (Innova 302C; Coherent). A 405 nm solid state laser (Cube 405–100C; Coherent) was used for activation of dyes as described below. Beam selection and modulation of the laser intensities were controlled in a number of ways, depending on the laser wavelength. For 488 nm and 647 nm lines, an acousto-optic tunable filter (AA Optoelectronic) was used. The 561 nm and 752 nm lines were controlled using mechanical shutters (Uniblitz). For the 405 nm line, the light was controlled by direct digital modulation of the laser power supply. In all cases, neutral density filter wheels were used for coarse adjustments of laser power along with a combination of a half-wave plate and polarizer for fine power adjustments. The following longpass dichroic mirrors were used to reflect the excitation sources listed above: T495LP (Chroma) for 488 nm, Di01-R561 (Semrock) for 561 nm, Z660DCXRU (Chroma) for 647 nm, and Q770DCXR (Chroma) for 752 nm. Fluorescence was collected using an Olympus UPlanSApo 100×, 1.4 NA oil immersion objective lens and passed through either one of the following bandpass emission filters: 535/50 (ET535/50m; Chroma) for blue-absorbing dyes; 617/73 (FF01-617/73-25; Semrock) for yellow-absorbing dyes; 700/75 (ET700/75m; Chroma) for red- absorbing dyes; or 800/60 (HQ800/60m; Chroma), for NIR-absorbing dyes. All movies were recorded onto a 256×256 pixel region of an electron-multiplying charge coupled device (EMCCD) camera (iXon 897; Andor). During data acquisition, a home-built focus lock was used to maintain a constant focal plane as described previously 49 . Briefly, a 975 nm IR laser diode (PL980P330J; Thorlabs) was directed towards the sample using a dichroic mirror (900DCSP; Chroma). The beam reflected off of the sample was detected by a quadrant photodiode (QPD). Changes in the axial position of the sample resulted in a shift of the reflected beam position on the QPD. A feedback system using custom LabVIEW software then adjusted the sample z-position using a piezo stage (NZ100CE; Prior Scientific) until the original beam position was restored. Imaging buffers Detailed single-molecule characterization and STORM imaging for each dye ( Figs. 2 – 5 , Table 1 – 3 , Supplementary Figs. 1–35 ) was performed in an imaging buffer that contained TN buffer (50 mM Tris, pH 8.0, 10 mM NaCl), an oxygen scavenging system (0.5 mg/mL glucose oxidase (G2133; Sigma-Aldrich), 40 µg/mL catalase (106810; Roche Applied Science or C100–50MG; Sigma-Aldrich), and 10% (w/v) glucose), and either 143 mM 2-hydroxy-1-ethanethiol (βME; Fluka) or 10 mM 2-aminoethanethiol (MEA; Fluka), unless otherwise indicated. MEA was stored as a solid at 4°C and prepared fresh as a 1 M stock solution in water with pH adjusted to ~8 with 1 M aqueous KOH. This stock solution was kept at 4°C and used within 1–2 weeks of preparation. βME was stored as a neat liquid (14.3 M) at 4°C. For experiments, the thiol solutions were diluted immediately before imaging to the final concentrations as described above. Buffer dependence experiments ( Supplementary Figs. 29–30 , Table 3 ) were performed using one of the following four different buffers: PBS only (“No GLOX or thiol” condition); TN buffer with 10 mM MEA (“thiol only” condition); TN buffer with oxygen scavenger with the above described composition (“GLOX only” condition); and TN buffer with 10 mM MEA and oxygen scavenger with the above described composition (“GLOX and thiol” condition). To assess whether any free thiol was present in the “GLOX only” solution, we measured the absorption increase at ~410 nm of the “GLOX only” buffer upon addition of 50 µM Ellman’s reagent (5,5′-Dithiobis(2-nitrobenzoic acid), D8130; Sigma-Aldrich), a standard assay for free thiol quantification 50 . No absorption increase was detectable. In contrast, absorption increase was observed for a series of standard cysteine solutions with concentrations ranging between 1–20 µM. This measurement placed an upper limit of the thiol concentration of our “GLOX only” buffer to
📊 Figures
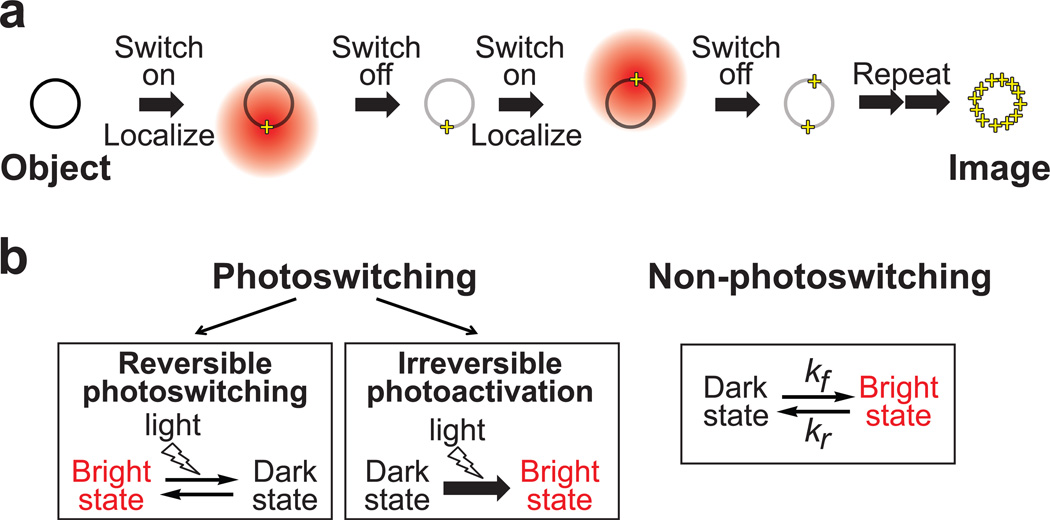
Figure 1
Principle of single-molecule-localization-based super-resolution imaging and modes of switching used for this imaging method
( a ) A structure (here a ring-like object) smaller than the diffraction-limited resolution is densely labeled with switchable fluorophores. When the fluorophores are imaged simultaneously, the spatia...
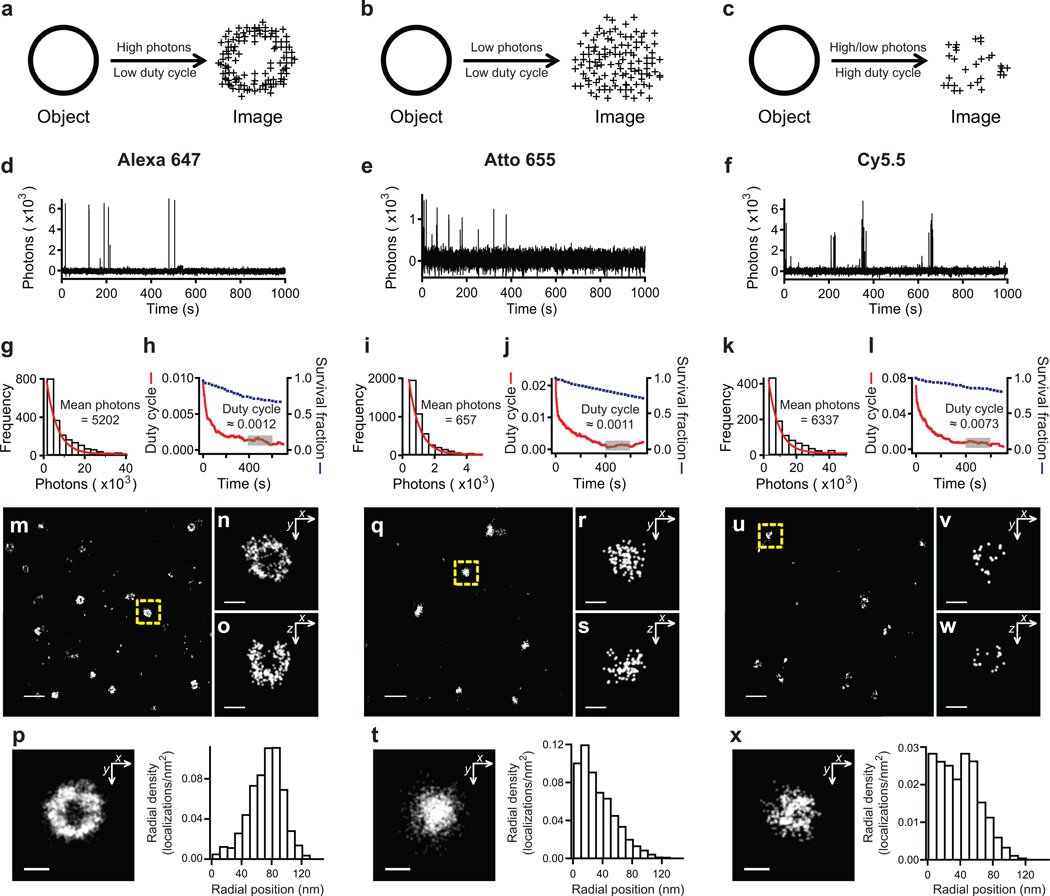
Figure 2
Quantitative probe characterization for STORM imaging
( a u2013 c ) The effect of number of detected photons per on-switching event and the on/off duty cycle (fraction of time in the on state) on STORM image quality for an example structure (a ring-like ...
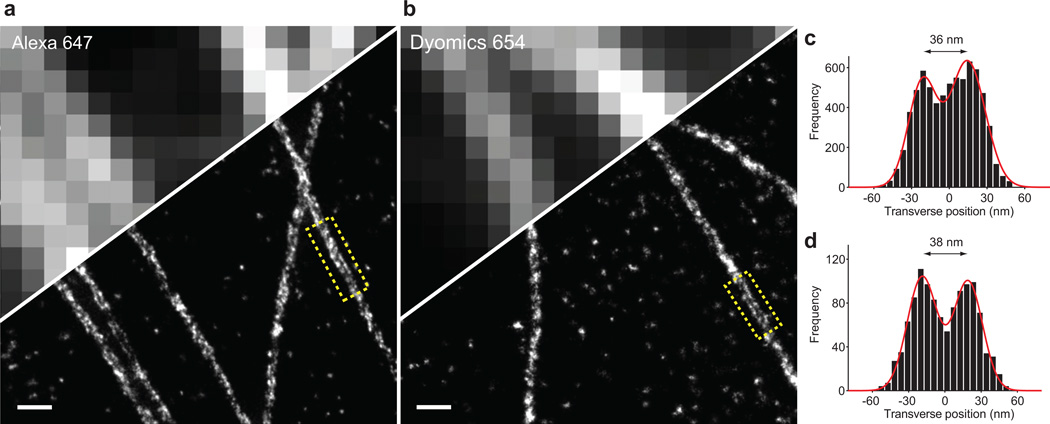
Figure 3
Alexa 647 and Dyomics 654 resolve the hollow structure of immunostained microtubules
( au2013b ) STORM images of microtubules immunostained with Alexa 647 ( a ) and Dyomics 654 ( b ) and the partially overlaid conventional fluorescence images in the upper left corner of each image. ( ...
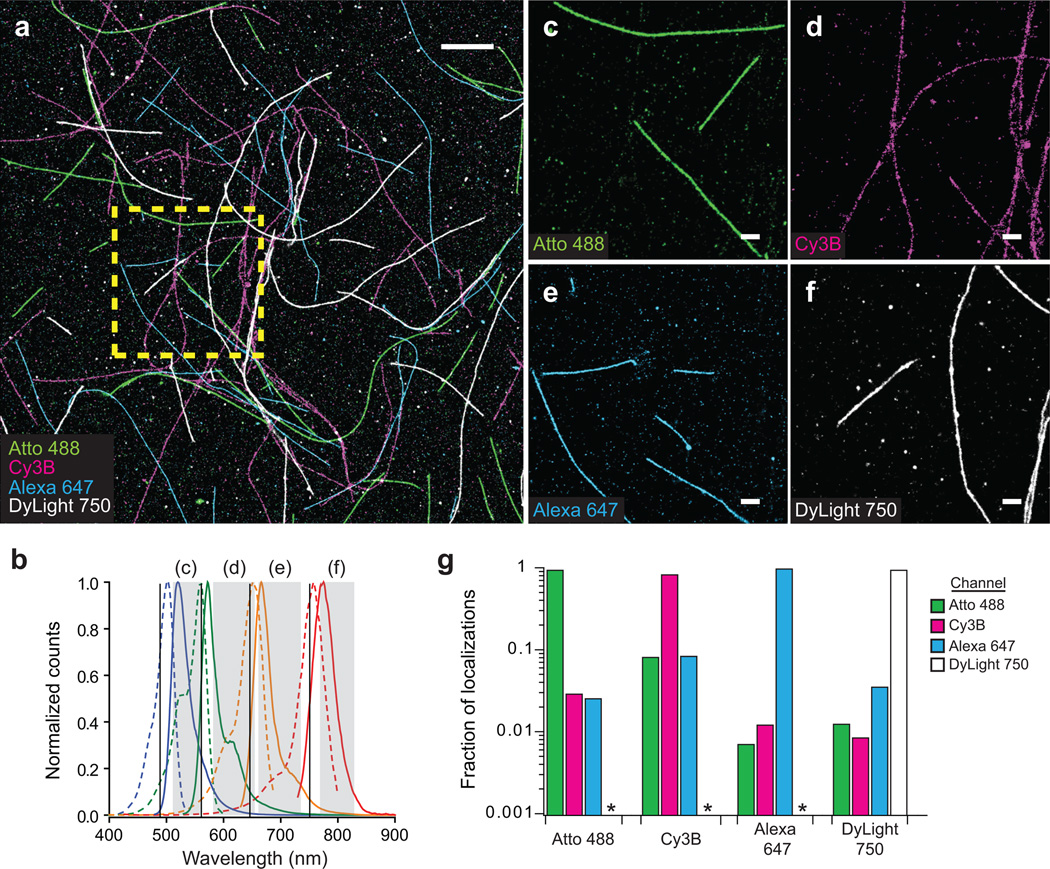
Figure 4
Four-color STORM imaging of in vitro assembled microtubule filaments and crosstalk analysis
( a ) Four-color STORM image of in vitro assembled microtubules labeled with each of the four dyes, Atto 488 (green), Cy3B (magenta), Alexa 647 (cyan), and DyLight 750 (white). ( b ) Spectral separati...
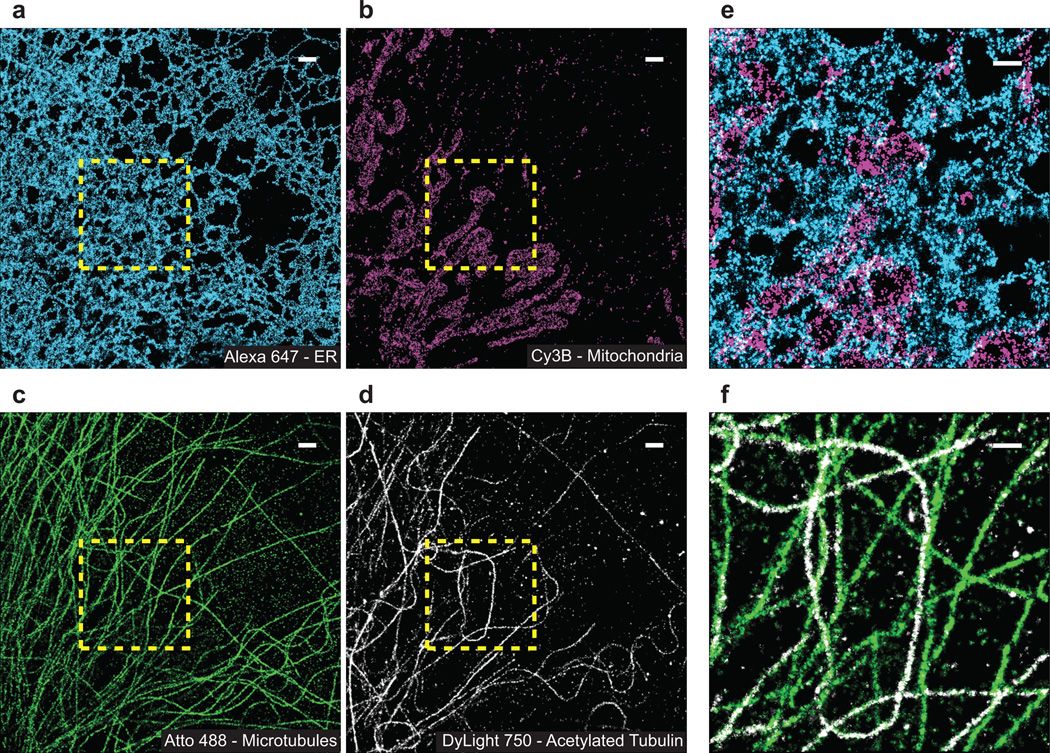
Figure 5
Four-color STORM imaging of cellular structures
( au2013d ) Individual channels of a four-color image of Atto 488-labeled microtubules (green), Cy3B-labeled mitochondria (magenta), Alexa 647-labeled ER (cyan), and DyLight 750-labeled acetylated tub...
Figure images are served from the NIH/NLM PubMed Central Open Access Subset or Europe PMC; copyright remains with the publishers and authors.
💬 Discussion
0 commentsNo comments yet. Be the first to start a discussion!
Leave a Comment