Abstract
Abstract The signaling diversity of GABAergic interneurons to post-synaptic neurons is crucial to generate the functional heterogeneity that characterizes brain circuits. Whether this diversity applies to other brain cells, such as the glial cells astrocytes, remains unexplored. Using optogenetics and two-photon functional imaging in the adult mouse neocortex, we here reveal that parvalbumin- and somatostatin-expressing interneurons, two key interneuron classes in the brain, differentially signal to astrocytes inducing weak and robust GABA B receptor-mediated Ca 2+ elevations, respectively. Furthermore, the astrocyte response depresses upon parvalbumin interneuron repetitive stimulations and potentiates upon somatostatin interneuron repetitive stimulations, revealing a distinguished astrocyte plasticity. Remarkably, the potentiated response crucially depends on the neuropeptide somatostatin, released by somatostatin interneurons, which activates somatostatin receptors at astrocytic processes. Our study unveils, in the living brain, a hitherto unidentified signaling specificity between interneuron subtypes and astrocytes opening a new perspective into the role of astrocytes as non-neuronal components of inhibitory circuits.
🔬 Techniques
🔭 Microscopes
💻 Software
✨ Fluorophores
🧪 Sample Preparation
🔬 Cell Lines
🏭 Microscope Brands
🧪 Reagent Suppliers
🔴 Lasers
📷 Detectors
💻 Software Details
💾 Data Repositories
🏷️ Research Resource Identifiers (RRIDs)
Verified research resources used in this paper:
🏛️ Research Organizations (ROR)
Affiliated research institutions:
📋 Methods
Experimental set-up To selectively stimulate
PV or SST interneurons and evaluate potential Ca 2+ responses of astrocytes, we used an adeno-associated virus (AAV)-based strategy (Fig. 1a ). Through this approach, we induced in PV interneurons of adult PV-Cre mice or SST interneurons of adult SST-Cre mice, the selective expression of the light-gated cation channel channelrhodopsin-2 (ChR2) 17 (Supplementary Fig. 1a–d ) and in astrocytes the sparse expression of GCaMP6f (Supplementary Fig. 2a, b ), a genetically encoded Ca 2+ indicator (GECI) 18 – 20 (ChR2-PV-GCaMP6f or ChR2-SST-GCaMP6f mice, see Methods). Fig. 1 Calcium signal dynamics reveal differential astrocyte responses to PV and SST interneuron activation. a Schematic of the in vivo experimental approach (left) and of the optogenetic stimulation of ChR2-PV or ChR2-SST interneurons (right). b Top, images of a representative GCaMP6f-astrocyte in layer 2/3 SSCx from an adult ChR2-PV-GCaMP6f mouse with the ROIs defined by GECIquant software for the Ca 2+ response to the first 30 light pulse stimulation (blue lines) of PV interneurons at the soma (yellow), proximal processes (red), and microdomains (blue), scale bar, 20 μm (see Supplementary Movie 3 ). Bottom, Ca 2+ signal dynamics at different astrocytic compartments before and after successive 10 and 30 light pulse PV interneuron activations. Scale bars, 50 s, 20% d F / F 0 . c , d Raster plots of Ca 2+ peaks ( c ) and mean time course of Ca 2+ transients ( d ) from all in vivo monitored GCaMP6f-astrocytes, at rest and following PV interneuron stimulations. Scale bar, 5 s, 20% d F / F 0 . e – g Same as in b – d , but for ChR2-SST-GCaMP6f mice and SST interneuron stimulation
Show full methods section
Experimental set-up To selectively stimulate
PV or SST interneurons and evaluate potential Ca 2+ responses of astrocytes, we used an adeno-associated virus (AAV)-based strategy (Fig. 1a ). Through this approach, we induced in PV interneurons of adult PV-Cre mice or SST interneurons of adult SST-Cre mice, the selective expression of the light-gated cation channel channelrhodopsin-2 (ChR2) 17 (Supplementary Fig. 1a–d ) and in astrocytes the sparse expression of GCaMP6f (Supplementary Fig. 2a, b ), a genetically encoded Ca 2+ indicator (GECI) 18 – 20 (ChR2-PV-GCaMP6f or ChR2-SST-GCaMP6f mice, see Methods). Fig. 1 Calcium signal dynamics reveal differential astrocyte responses to PV and SST interneuron activation. a Schematic of the in vivo experimental approach (left) and of the optogenetic stimulation of ChR2-PV or ChR2-SST interneurons (right). b Top, images of a representative GCaMP6f-astrocyte in layer 2/3 SSCx from an adult ChR2-PV-GCaMP6f mouse with the ROIs defined by GECIquant software for the Ca 2+ response to the first 30 light pulse stimulation (blue lines) of PV interneurons at the soma (yellow), proximal processes (red), and microdomains (blue), scale bar, 20 μm (see Supplementary Movie 3 ). Bottom, Ca 2+ signal dynamics at different astrocytic compartments before and after successive 10 and 30 light pulse PV interneuron activations. Scale bars, 50 s, 20% d F / F 0 . c , d Raster plots of Ca 2+ peaks ( c ) and mean time course of Ca 2+ transients ( d ) from all in vivo monitored GCaMP6f-astrocytes, at rest and following PV interneuron stimulations. Scale bar, 5 s, 20% d F / F 0 . e – g Same as in b – d , but for ChR2-SST-GCaMP6f mice and SST interneuron stimulation
Methods Mouse strains and adeno-associated virus injections
We used C57BL/6 wild type (WT) mice and the following transgenic mice: Tg(GadGFP)45704Swn (GIN), ( CB6-Tg(Gad1-EGFP)G42Zjh/J ) (G42), Pvalb (PV-Cre) and Sst < tm2.1(cre)Zjh>(SST-Cre), and tdTomato reporter line B6;129S6- Gt(ROSA)26Sor tm14(CAG-tdTomato)Hze /J. All procedures were conducted in accordance with the Italian and European Community Council Directive on Animal Care and approved by the Italian Ministry of Health. Injections of viral vectors AAV2/1.EF1.dflox.hChR2(H134R)-mCherry.WPRE.hGH (Penn Vector Core, Addgene 20297) or AAV1.EF1a.DIO.hChR2(H134R)-eYFP.WPRE.hGH, Addgene 20298), carrying the doublefloxed ChR2 sequence, and AAV5.GfaABC1DcytoGCaMP6f.SV40, carrying the astrocytic promoter GfaABC1D, which induces a sparse expression of the Ca 2+ indicator GCaMP6f in astrocytes, were performed into the SSCx of postnatal day 35–50 (P35-P50) PV-Cre or SST-Cre mice anesthetized with Zoletil (30 mg/kg) and Xylazine (20 mg/kg). Depth of anesthesia was assured by monitoring respiration rate, eyelid reflex, vibrissae movements, and reactions to pinching the tail and toe. Injections of the two viral vectors were performed after drilling one or two holes (0.5 mm dia) into the skull over the SSCx at a distance of 1.5 mm (1.5 μl to each hole, 0–1.5 mm posterior to Bregma, 1.5 mm lateral to sagittal sinus, and 150 μm depth) using a pulled glass pipette in conjunction with a custom-made pressure injection system. After injections, the skin was sutured and mice were revitalized under a heat lamp and returned to their cage. Optogenetic and imaging in vivo experiments were performed in P50-P65 mice, 2 weeks after injections. For slice experiments, PV-Cre and SST-Cre pups (P0–P2) anesthetized by hypothermia and secured into a modeled platform were injected. Optogenetic and imaging experiments were carried out on SSCx slices from P15-P25 mice. Slice preparation, dye loading and patch-clamp recordings Coronal SSCx slices of 350 μm were obtained from mice at postnatal days P15-25. Animals were anesthetized as reported above, the brain removed and transferred into an ice-cold solution (ACSF, in mM: 125 NaCl, 2.5 KCl, 2 CaCl 2 , 1 MgCl 2 , 25 glucose, pH 7.4 with 95% O 2 , and 5% CO 2 ). Slices were cut in the solution reported in Dugue et al. 60 and then kept for 1 min in the solution (in mM): 225 d -mannitol, 2.5 KCl, 1.25 NaH 2 PO 4 , 26 NaHCO 3 , 25 glucose, 0.8 CaCl 2 , 8 MgCl 2 , 2 kynurenic acid with 95% O 2 , and 5% CO 2 . Finally, slices were kept in ACSF at 30 °C for 20 min and then maintained between 19 and 22 °C for the entire experiment. In a set of experiments, SSCx slices were incubated with the Ca 2+ sensitive dye Fluo-4 AM (10 μM; Life Technologies) and the selective astrocyte dye Sulforhodamine 101 25 (SR101, 0.2 μM, Sigma Aldrich, Italy), as previously described 44 . For the in vivo experiments, the bulk loading of cortical astrocytes was performed with the dye OGB-1 AM (final concentration 1 mM, Thermo Fisher Scientific, USA) and SR101 (final concentration 0.5 mM). For whole-cell patch-clamp recordings, slices were perfused in a submerged chamber at a rate of 3–4 ml/min with (in mM): 120 NaCl, 2.5 KCl, 1 NaH 2 PO 4 , 26 NaHCO 3 , 1 MgCl 2 , 2 CaCl 2 , 10 glucose, pH 7.4 (with 95% O 2 and 5% CO 2 ). Neurons were visualized under a confocal microscope (TCS-SP5-RS, Leica Microsystems, Germany) or a Multiphoton Imaging System (Scientifica Ltd, UK) equipped with a CCD camera for differential interference contrast (DIC) image acquisition. Single-cell recordings were performed in voltage- or current-clamp configuration using a multiclamp 700B amplifier (Molecular Devices, USA). Signals were filtered at 1 kHz and sampled at 10 kHz with a Digidata 1440 s interface and pClamp 10 software (Molecular Devices). The pipette resistance was 3–4 MΩ. Access resistance was monitored throughout the recordings and was between 8.4 and 24.2 MΩ. Neurons that had a >15% change in access resistance were discarded. Whole-cell intracellular pipette solution was (in mM): 145 K-gluconate, 5 MgCl 2 , 0.5 EGTA, 2 Na 2 ATP, 0.2 Na 2 GTP, 10 HEPES, to pH 7.2 with KOH, osmolarity, 280 ÷ 290 mOsm. Data were not corrected for the liquid junction potential. Recordings were analyzed with Clampfit 10.3. Drug applications Drugs applied to the slice perfusion solution were: SCH50911 (20–50 μM), CYN 154806 (20 μM), and somatostatin (SST, 1–2 μM) from Tocris (UK), Tetrodotoxin (1 μM), CGP52432 (20 μM), HC030031 (80 μM), NBQX (10 μM), APV (50 μM), MPEP (50 μM), PPADS (100 μM) from Abcam (UK). Ca 2+ imaging To image Ca 2+ dynamics in GCaMP6f-astrocytes, we used 2-photon laser scanning microscope in both in vivo (Ultima IV, Bruker) and brain slice (Multiphoton Imaging System, Scientifica Ltd., UK) preparations equipped with a pulsed red laser (Chameleon Ultra 2, Coherent, USA) tuned at 920 nm. Power at sample was controlled in the range 5–10 mW. The excitation wavelengths used were 920 nm for GCaMP6f, 740 nm for Fluo-4 and 830 nm for OGB-1. SR101 is visible at both 740 and 920 nm. Images were acquired with a water-immersion lens (Olympus, LUMPlan FI/IR 20×, 1.05 NA), with a field of view between 700 × 700 μm and 120 × 120 μm at 1–3.5 Hz acquisition frame rate. Each Ca 2+ signal recording was performed in cortical layers 2–3 for about 2 min and 30 s with 5 min interval between the first and the second stimulation of interneurons by 10 or 30 light pulses, whereas a longer interval of about 10 min was applied before initiating the first 30 pulse stimulation. In control experiments, the same imaging protocol was applied without optogenetic stimulation. A confocal laser scanning microscope (TCS-SP5-RS, Leica Microsystems, Germany) equipped with two lasers tuned at 488 nm and 543 nm was used only in a subset of experiments to continuously monitor Ca 2+ signals from GCaMP6f-astrocytes during optogenetic light activation of PV or SST interneurons in SSCx slices (Supplementary Fig. 4 ), an unfeasible condition in our 2-photon experiments. In in vivo imaging experiments, P55-P65 ChR2-PV-GCaMP6f or ChR2-SST-GCaMP6f mice were anesthetized with urethane (20% urethane, ethylcarbamate; SIGMA Aldrich). Animal pinch withdrawal and eyelid reflex were tested to assay the depth of anesthesia. Dexamethasone sodium phosphate (2 mg/kg body weight) was injected intramuscularly to reduce cortical stress response during surgery and prevent cerebral edema. Atropine (0.05 mg/kg body weight) was injected subcutaneously to avoid saliva accumulation. Both eyes were covered with an eye ointment to prevent corneal desiccation during the experiment. We monitored the respiration rate, heart rate, and core body temperature throughout the experiment. The mouse was head-fixed and a craniotomy of 2–3 mm in diameter was drilled over the SSCx. Mice were mounted under the microscope with a metal head-post glued to the skull. Imaging was performed through a water-immersion lens (Olympus, LUMPlan FL/N 20×, 1.05 NA) at a resolution of 512 × 512 pixels with zoom 4, leading to a field of 50.7 × 50.7 μm in superficial layers (50–150 μm below the cortical surface) and acquired at 1–2 Hz. Imaging session lasted up to 2 h.
Optogenetic stimulation
Full-field photo-stimulation of ChR2-expressing interneurons consisted of 150 ms light pulses ( λ = 473 nm) delivered by a blue module laser diode (MLD, COBOLT, Solna, SE), which was collimated and coupled under the objective with an optic fiber (ThorLabs, NJ, USA) held at 26° angle above the brain tissue. The optic fiber was 300 μm in diameter with a 0.22 NA. The resulting illuminated ellipse was 550 μm long and 150 μm wide.
Two-photon-targeted juxtasomal recordings in vivo
Experimental procedures followed what previously described 61 . In brief, for recordings in anesthetized mice, PV-Cre/tdTomato and SST-Cre/tdTomato double-transgenic mice were injected at P0 with AV2/1.EF1.dflox.hChR2(H134R)-mCherry.WPRE.hGH (Addgene 20297). Four to five weeks after virus injections mice were anesthetized with urethane (2 g/kg) and a small craniotomy (~1 mm × 1 mm) was opened onto the mouse skull. The patch pipette (resistance: 4–9 MΩ) was filled with ACSF solution mixed with Alexa Fluor-488 (20 μM, Invitrogen Thermo Fisher, USA) and lowered to cortical layer 2/3 (110–300 μm from the brain surface). tdTomato-positive neurons were targeted by imaging their fluorescence with the two-photon microscope ( λ = 920 nm or 730 nm). Full-field optogenetic stimulation of interneurons was performed as in Zucca et al. 61 Light intensity was 0.2–6 mW at the fiber tip. For recordings in non-anesthetized mice, 2 weeks before the experiment mice were anesthetized with 2% isoflurane/0.8% oxygen and a custom metal plate was mounted with dental cement on the skull. Habituation sessions were performed on each day (starting 2–3 days after plate implantation) with a gradually increasing duration (from 15 to 60 min, for 7–10 days). The day of the recording, mice were anesthetized with isofluorane and a small craniotomy was opened on the somatosensory cortex as described above. After the surgery, mice recovered for at least 30 min before the beginning of the experimental session. Electrical signals were amplified by a Multiclamp 700B, low-pass filtered at 10 kHz, digitized at 50 kHz with a Digidata 1440 and acquired with pClamp 10 (Axon instruments, USA). Electrophysiological traces were analyzed using Clampfit 10 software. Pre-embedding electron microscopy Three C57BL/6 (P21) mice were anesthetized with chloral hydrate (12% i.p., 300 mg/kg) and perfused through the ascending aorta with physiological saline solution followed by a mixture of 4% paraformaldehyde (PFA) and 0.2% glutaraldheyde in PBS. Brains were post-fixed in the same fixative used for perfusion for 3 days and parietal cortex was cut serially in the coronal plane (40 μm sections) with a vibratome and immediately processed for immunoperoxidase according to previous pre-embedding electron microscopy protocols 62 . For antibody specificity on the SSTR4, two 9-month-old mice (WT and SSTR4 KO 35 ) were perfused through the ascending aorta with a flush of physiological saline solution followed by 4% PFA in PBS. Brains were post-fixed in the same fixative for 1 h, cryopreserved and then frozen until cutting by a vibratome. For antibody specificity on the GABA B2 two 7-week-old WT BALB/c JR1 mice and two GABA B2 KO BALB/c JR1 mice 34 were perfused through the ascending aorta with physiological saline solution followed by 4% PFA in PBS. Brains were post-fixed in the same fixative used for perfusion for 7 days until cutting by a vibratome. For PV and SST visualization sections were incubated in a solution containing rabbit polyclonal anti-PV (1:500; raised against rat muscle PV; PV28, RRID:AB_10013386, Swant, Switzerland) or rat monoclonal anti-SST primary antibodies (1:80; raised against synthetic 1–14 cyclic SST, MAB 354; RRID:AB_2255365 EMD Millipore, Germany; 2 h at room temperature and overnight at 4 °C) 63 . The following day, sections were incubated in a solution containing the appropriate biotinylated secondary antibodies (1:200; Jackson ImmunoResearch, USA; 1 h at room temperature). Antibody bindings sites were visualized by avidin–biotin peroxidase complex, 3,3 diaminobenzidinetetrahydrochloride and H 2 O 2 62 . Method specificity was verified by substituting primary antibodies with phosphate buffer (PB) or non immune serum. Subsequently, embedding procedure of immunoperoxidase processed sections was performed as described 62 . Small blocks of embedded tissue containing layers 2/3 of the SSCx were selected, glued to blank epoxy and sectioned with an ultramicrotome (MTX; Research and Manufacturing Company Inc., USA). The most superficial ultrathin sections (60 nm) were collected and mounted on 200 mesh copper grids, stained with Sato’s lead and examined with a Philips EM 208 and CM10 electron microscope (Eindhoven, The Netherlands) coupled to a MegaView-II high resolution CCD camera (Soft Imaging System, Germany). Identification of labeled and unlabeled profiles was based on established morphological criteria 64 . Microscopic fields were selected and captured at original magnifications of 30,000 or ×50,000. According to the different post-synaptic targets of PV and SST interneurons, PV interneuron immunopositive terminals were sampled at axo-somatic, proximal axo-dendritic, and axo-axonic synapses, and SST interneuron immunopositive terminals at axo-dendritic shaft and axo-spinous synapses PAPs were then identified and quantification at symmetric synapses of PV and SST interneurons performed. Post-embedding electron microscopy Three C57BL/6 (P21) were anesthetized with chloral hydrate (12% i.p.; 300 mg/kg) and perfused through the ascending aorta with a flush of physiological saline solution followed by 4% PFA in PBS. Brains were post-fixed in the same fixative for 7 days and parietal cortex was cut serially in the coronal plane in 50 μm thick sections with a vibratome. Sections were processed for an osmium-free embedding method 62 , 65 , 66 . Chips including layers 2/3 of SSCx, were selected, glued to blank resin blocks and sectioned with an ultramicrotome. Thin sections (60–80 nm) were cut and mounted on 300 mesh nickel grids and processed for immunogold post-embedding labeling 62 , 65 , 66 . For GABA B2 and SSTR4 visualization, grids were incubated overnight (26 °C) in a solution containing anti-GABA B2 mouse monoclonal antibody (1:50; raised against amino acids 183–482 mapping within an extracellular domain of GABA B2 of human origin, specific for detection of GABA B2 of mouse, rat and human; H10; sc-393270, Santa Cruz Biotechnology Inc., USA) and anti-SSTR4 rabbit polyclonal antibody (1:50; raised against amino acids 171–220 of SSTR4 of human origin, specific for detection of SSTR4 of mouse, rat and human; H50; sc-25678, RRID:AB_2196360, Santa Cruz Biotechnology), and then incubated for 2 h (26 °C) in a solution containing anti-mouse and anti-rabbit secondary antibodies conjugated to 18 and 12 nm gold particles (1:20; 115–215–068, 111–205–144, Jackson ImmunoResearch, USA). Grids were finally stained with uranyl acetate and Sato’s lead. The optimal concentration of antibodies to GABA B2 and SSTR4 was sought by testing several dilutions; the concentration yielding the lowest level of background labeling and still immunopositive elements was used to perform the final studies. Gold particles were not detected when primary antiserum was omitted. When normal serum was substituted for immune serum, sparse and scattered gold particles were observed, but they did not show any specific relationship to subcellular compartments. Ultrathin sections (15 ultrathin sections/animal) were examined at ×50,000–85,000 and fields that included at least 1 immunolabeled astrocytic profile and/or perisynaptic astrocytic process associated with a symmetric synapse exhibiting a clear pre-synaptic (AZ) and post-synaptic specialization were selected 64 , 67 . For determining the relative density of GABA B2 and SSTR4 double-labeled astrocytic profiles, pyramidal cell nuclei were also identified: gold particles within labeled structures counted and areas calculated using ImageJ (NIH, Bethesda, MD, USA). Background was calculated by estimating labeling density over pyramidal cell nuclei (0.54 ± 0.05, n = 12 for GABA B2 and 0.57 ± 0.02, n = 12 for SSTR4) 62 , 68 . Particle densities were counted in perisynaptic (PAPs; 42.43 ± 7.27 for GABA B2 and 44.02 ± 10.66, n = 40 for SSTR4) and non perisynaptic astrocytic processes (nPAPs; 44.26 ± 6.07 for GABA B2 and 49.88 ± 7.87 for SSTR4) and compared with background labeling. Gold particles were considered associated with plasma membrane if they were within 15 nm of the extracellular side of the membrane, and cytoplasmic if they were 25 nm from the extracellular processes. Edge-to-edge separation distance between GABA B2 and SSTR4 membrane-associated gold particle pairs were measured and the distribution of the separation distance between immunogold labeled GABA B2 and SSTR4 pairs was determined 69 , 70 . In astrocytic processes, pairs of immunogold labeled GABA B2 and SSTR4 with an edge-to edge distance within 50 nm, were also localized with respect to the closest AZ margin of symmetric synapses. Lateral position of a pair was defined as the distance along the plasma membrane from the AZ edge to the middle point between the two particles, and measured using ImageJ. For experiments in KO mice and relative controls, microscopical fields containing spines, axon terminals and astrocytic processes with at least one gold particle for GABA B2 analysis, proximal and distal dendrites, axon terminals, and astrocytic processes for SSTR4 analysis were randomly selected. For both pre- and post-embedding studies, all material from WT and KO mice was processed in parallel. Acquisition of ultramicroscopical fields and density analysis of WT and KO mice were performed in a blind manner.
Immohistochemistry and cell counting
For the evaluation of the number of GCaMP6f-expressing astrocytes and neurons we prepared 100 μm thick brain slices from young and adult animals injected with AAV-ChR2 and AAV2/5.GfaABC.cyto.GCaMP6. Slices were fixed in cold 4% PFA for 2 h, washed with PBS and processed for double immunofluorescence staining. First, we incubated floating sections for 1 h in the Blocking Serum (BS: 1% BSA, 2% goat serum and 1% horse serum in PBS) and 0.2% TritonX-100. We then performed a second incubation with primary antibodies mixed and diluted in BS and 0,02% TritonX-100 (16 h at 4 °C). Primary antibodies used were: anti-NeuN antibody (RRID:AB_2298772, 1:400 mouse, Millipore MAB377) plus anti-GFP (RRID:AB_221477, 1:200 rabbit, Invitrogen Thermo-Scientific, A21311), and anti-glial fibrillary acidic protein (GFAP, RRID:AB_10013382, 1:300 rabbit, Dako, Denmark, Z0334) plus anti-GFP (RRID:AB_221568, 1:200 mouse, Invitrogen Thermo-Scientific, A11120). The anti-GFP antibodies were used to enhance the GCaMP6f fluorescence. After washing with PBS, slices were incubated for 2 h at room temperature with secondary antibodies conjugated with Alexa Fluor-488 (for staining GFP) and with Alexa Fluor-633 (for staining NeuN or GFAP; Invitrogen Thermo-Scientific, 1:500). Slices were then washed and mounted on glass coverslips. Negative controls were performed in the absence of the primary antibodies. For the evaluation of the number of PV- and SST-interneurons expressing ChR2, PV-cre/tdTomato and SST-cre/tdTomato double-transgenic mice were injected at P0 with AAV1.EF1a.DIO.hChR2(H134R)-eYFP.WPRE.hGH (see above for details). Four weeks after virus injection, mice were anesthetized with urethane (2 g/kg) and perfused transcardially with 0.9% saline solution, followed by 4% PFA in 0.1 M PB, pH 7.4. Brains were post-fixed for 6 h, cryoprotected in a 30% sucrose solution in 0.1 M PB pH 7.4 and frozen. Free-floating coronal serial sections (40 µm) from injected PV-cre/tdTomato and SST-cre/tdTomato mice were collected and stained against parvalbumin or somatostatin, respectively. The following primary antibodies were used: anti-parvalbumin (RRID: AB_477329, 1:1000 mouse, Sigma P3088) and anti-somatostatin (RRID: AB_2255365, 1:200 rat, Millipore MAB 354). Secondary antibodies consisted of: goat anti-mouse 647 (RRID: AB_141725, 1:800, Molecular Probes A21236) and goat anti-rat 647 (RRID:AB_141778, 1:800, Molecular Probes A21247). Sections were mounted on SuperFrost slides (Molecular Probes), air dried, and coverslipped in polyvinyl alcohol with diazabicyclo-octane (DABCO). Confocal image z -stacks were captured through the thickness of the slice at 1 µm steps and used for double-labeled cell count using an open source ImageJ plugin.
Data analysis Detection of astrocyte
ROI containing Ca 2+ elevations was performed with ImageJ in a semi-automated manner using the GECIquant plugin 20 . The software was used to identify ROIs corresponding first to the soma (>30 μm 2 ; confirmed by visual inspection), then to the proximal processes (>20 μm 2 and not corresponding to the soma) and finally to the microdomains (between 1 and 20 μm 2 corresponding to neither the soma nor the proximal processes). All pixels within each ROI were averaged to give a single time course F(t). Analysis of Ca 2+ signals was performed with ImageJ (NIH) and a custom software developed in MATLAB 7.6.0 R2008 A (Mathworks, Natick, MA, USA). To compare relative changes in fluorescence between different cells, we expressed the Ca 2+ signal for each ROI as d F / F 0 = ( F ( t ) − F 0 )/( F 0 ). We then defined as baseline trace for each ROI the points of the Ca 2+ trace with absolute values smaller than twice the standard deviation of the overall signal. Significant Ca 2+ events were then selected with a supervised algorithm as follows. Firstly, a new standard deviation was calculated on the baseline trace , and all local maxima with absolute values exceeding twice this new standard deviation were identified. Secondly, of these events, we considered significant only those associated with local calcium dynamics with amplitude larger than threefold the new standard deviation. The amplitude of each Ca 2+ event was measured from the 20th percentile of the fluorescent trace interposed between its maximum and the previous significant one (see Supplementary Fig. 17 ). Essentially, this procedure combines a threshold measured from the global baseline with a stricter threshold computed from a local baseline. We adopted this method to reduce artefacts from the recording noise superimposed on the slow astrocytic dynamics and from slow changes in baseline due to physiological or imaging drifts. All the Ca 2+ traces were visually inspected to exclude the ROIs dominated by noise. For all experiments, we calculated the number of active ROIs and for each ROI corresponding to the soma, proximal processes and microdomains the frequency, and the amplitude of the Ca 2+ signal. All the Ca 2+ peaks were aligned to their onset to compute the average Ca 2+ peak (Supplementary Fig. 17 ). The onset of each Ca 2+ event was defined as the last time point when its fluorescence trace was below one standard deviation of the baseline. Finally, the time onset of all detected Ca 2+ events was reported in raster plots and peristimuls time histograms (PSTH). These procedures were applied for the analysis of both in vivo and brain slice data. To provide an estimate of the change in the overall microdomain activity per astrocyte following PV or SST interneuron stimulation, the number of individual microdomains (active ROIs) and the average frequency of Ca 2+ microdomain events per cell were measured under the different experimental conditions. Then, these values were averaged across all astrocytes to obtain the bar graphs reported in the figures. A response ratio (RR; Fig. 8a ) that describes the change in the response of astrocytic processes to successive stimuli was calculated as follows. Firstly, for each astrocyte the response to a given interneuron stimulation was measured by the number of active ROIs, frequency and amplitude of Ca 2+ peaks at proximal and fine processes. These values were normalized to their corresponding baseline values, pooled and averaged. Secondly, the astrocyte RR was defined as the ratio of the second to the first response to 10 (or 30) pulse activation of PV or SST interneurons. Mean IPSCs peak amplitudes in Supplementary Fig. 13 were fitted to the double exponential equation A ( t ) = A 1*exp(− x / t 1) + A 2*exp(− x / t 2), where A 1 and A 2 are the amplitude of the fast and the slow decay component and t 1 and t 2 are the corresponding decay time constants.
Statistical analysis
Data were tested for normality before statistical analysis. For the number of ROIs and the frequency of astrocytic Ca 2+ events, we used paired Student’s t -test (on normal data distribution) or paired sample Wilcoxon signed-rank test (on non-normal data distribution). For the RR, one sample Wilcoxon signed-rank test was used. For cumulative distribution comparisons, we applied the Kolmogorov–Smirnov test. For EM data, normality test and statistical analysis were performed using GraphPrism v.4.0 (GraphPad Software, San Diego, CA, USA). Given the non-normal distribution of data, Mann–Whitney test and Kruskal Wallis with Dunn’s multiple comparison test were used. Pairwise statistical comparisons of each value of the astrocyte response to a given stimulation was carried out with respect to basal values. The astrocytes response to the two successive 10 (or 30) pulse stimulation was also similarly evaluated. All results are presented as mean ± SEM. Results were considered statistically significant at p ≤ 0.05. * p ≤ 0.05, ** p ≤ 0.01, *** p ≤ 0.001. The exact p- values for each set of data are reported in the Supplementary Table 4 .
Data availability
Data presented in this work are available from the corresponding author upon reasonable request.
Electronic supplementary material Supplementary Information Peer Review File Description of Additional Supplementary Files Supplementary Movie 1 Supplementary Movie 2 Supplementary Movie 3
📊 Figures
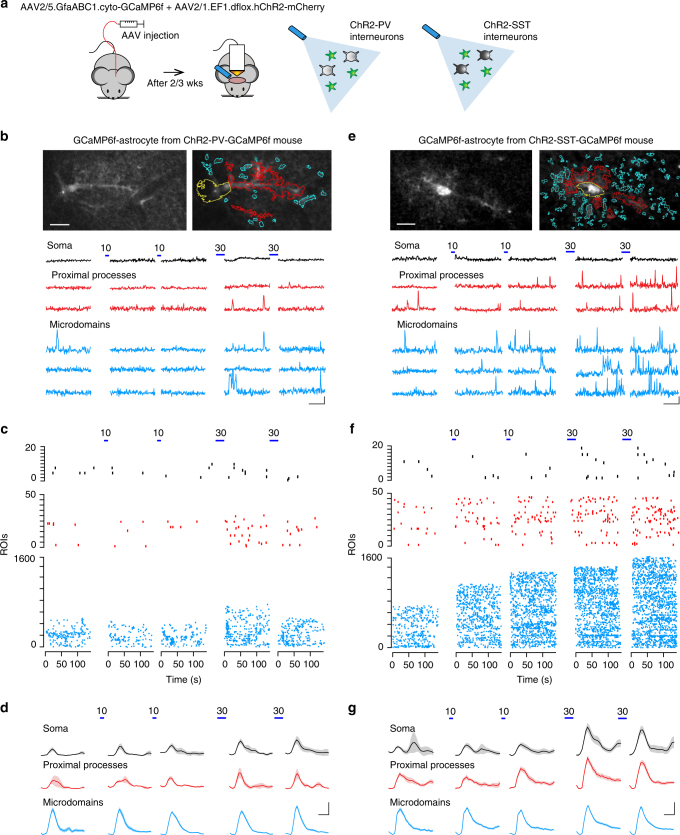
Fig. 1
Calcium signal dynamics reveal differential astrocyte responses to PV and SST interneuron activation. a Schematic of the in vivo experimental approach (left) and of the optogenetic stimulation of ChR2...
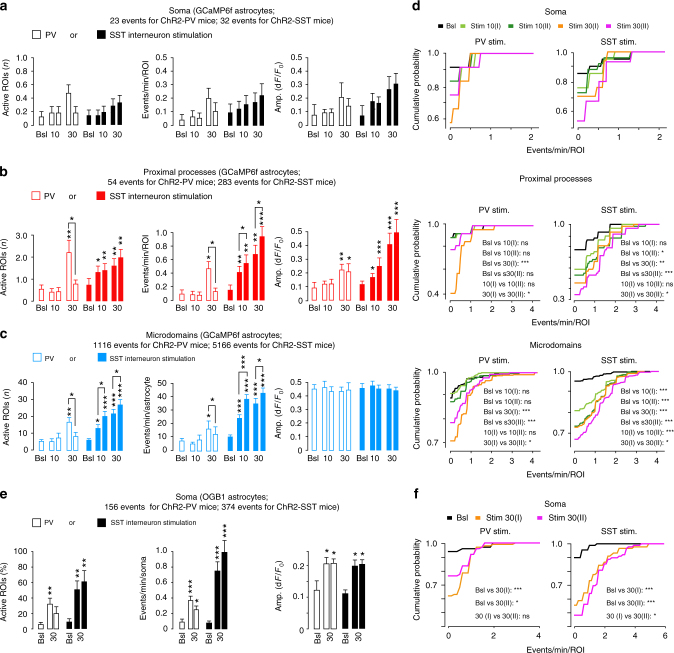
Fig. 2
Properties of the astrocyte response to PV and SST interneurons in vivo. a u2013 c Average data of Ca 2+ signal dynamics at different compartments of GCaMP6f-astrocytes from ChR2-PV- or ChR2-SST-GCaMP...
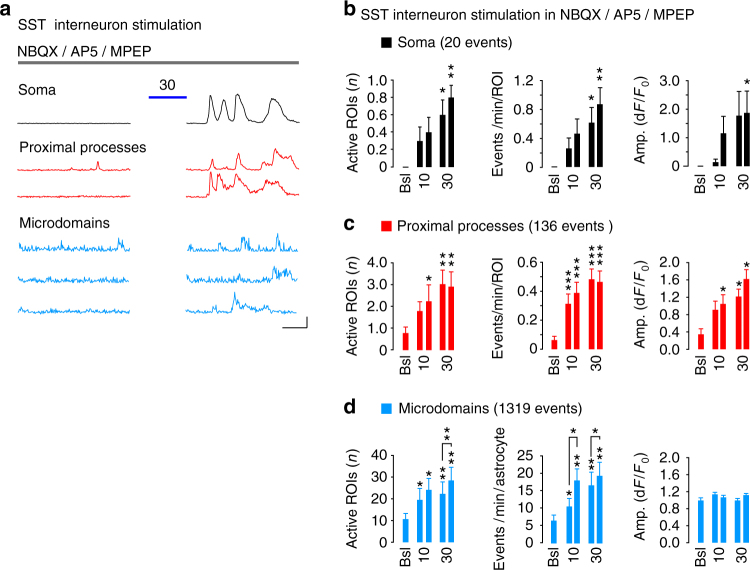
Fig. 3
Astrocyte response to SST interneurons does not depend on glutamatergic transmission. a Representative traces and b u2013 d quantitative evaluation of GCaMP6f-astrocyte responses to SST interneuron ac...
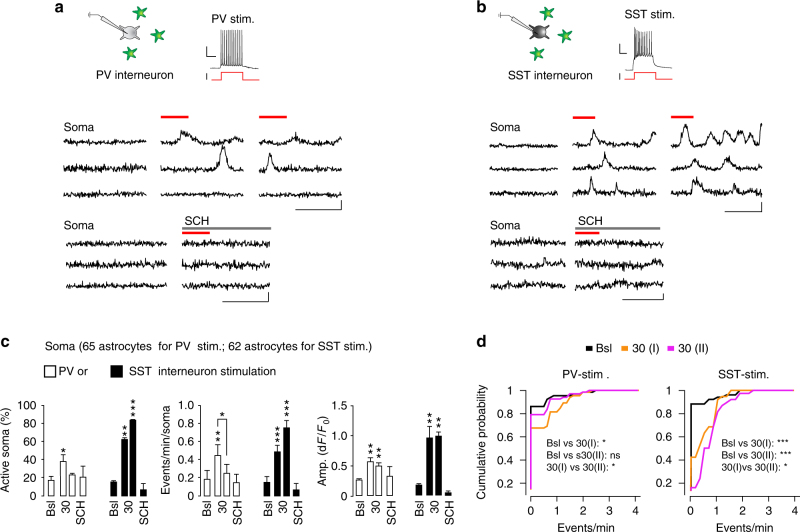
Fig. 4
GABAergic signaling from individual PV or SST interneurons in SSCx slices is sufficient to recruit neighboring astrocytes. a , b Top, schematics of patch-clamp experiments and representative AP firing...
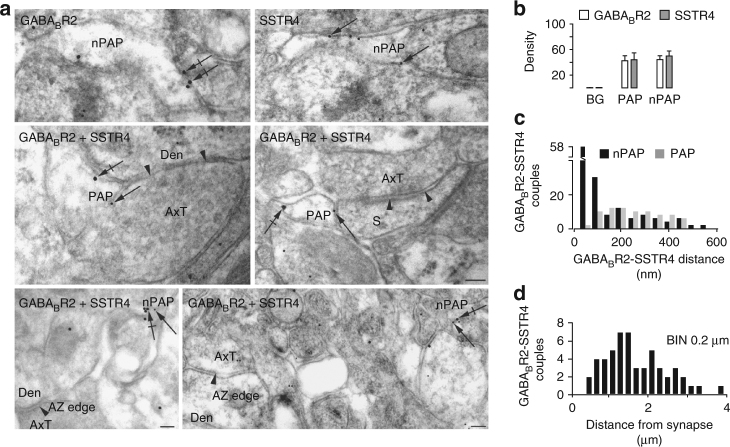
Fig. 5
GABA B Rs and SST4Rs colocalize at non perisynaptic astrocytic processes (nPAPs). a Upper row, GABA B2 and SSTR4 immunogold EM single-labeled nPAPs (arrows point to 18 and 12u2009nm membrane-associate...
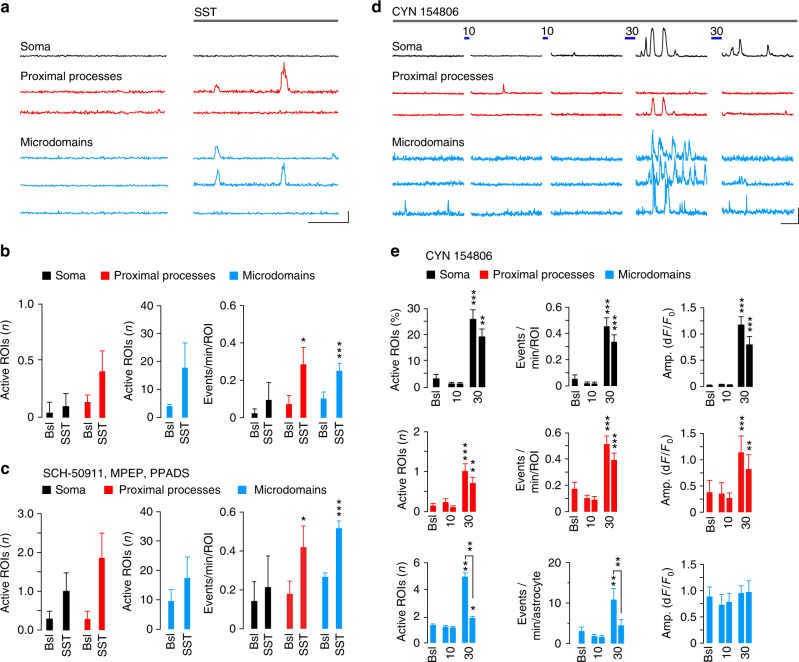
Fig. 6
SST interneuron signaling specificity to astrocytes depends on the neuropeptide somastostatin. a Representative traces and b , c quantitative evaluation of GCaMP6f-astrocyte responses to the neuropept...
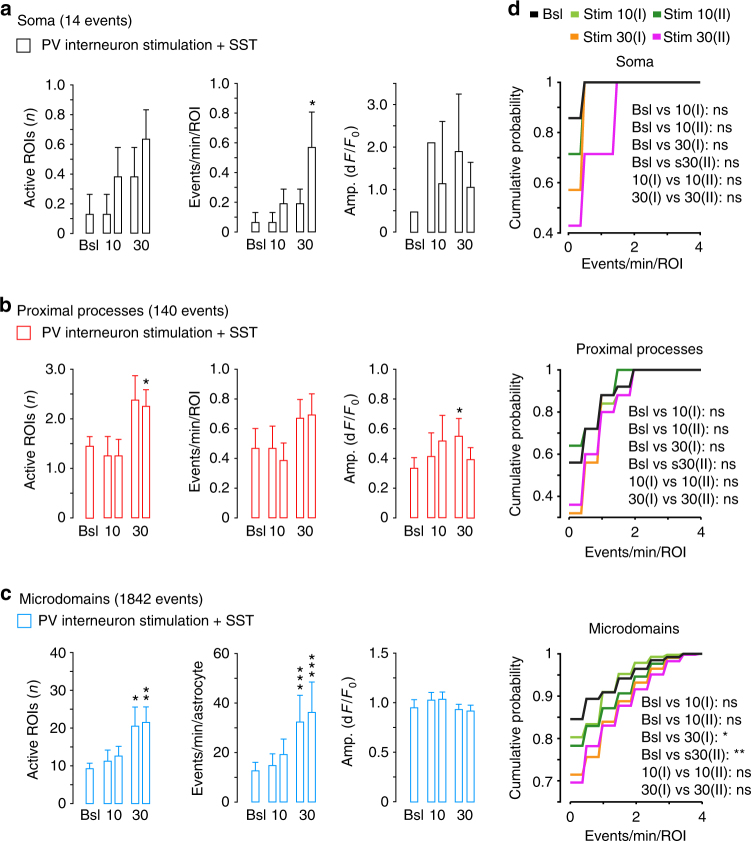
Fig. 7
The neuropeptide somatostatin prevents the depression of the astrocyte response to PV interneurons. a u2013 c Average data of GCaMP6f-astrocyte Ca 2+ response to PV interneuron activation (10 or 30 li...
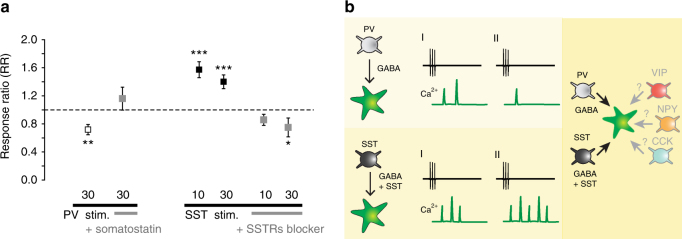
Fig. 8
Specificity of neuropeptide-releasing interneuron signaling to astrocytes. a Astrocyte response ratio (RR, see Methods) of the second versus the first 10 or 30 light pulse stimulation of PV or SST int...
Figure images are served from the NIH/NLM PubMed Central Open Access Subset or Europe PMC; copyright remains with the publishers and authors.
💬 Discussion
0 commentsNo comments yet. Be the first to start a discussion!
Leave a Comment