Abstract
HIV-1-containing internal compartments are readily detected in images of thin sections from infected cells using conventional transmission electron microscopy, but the origin, connectivity, and 3D distribution of these compartments has remained controversial. Here, we report the 3D distribution of viruses in HIV-1-infected primary human macrophages using cryo-electron tomography and ion-abrasion scanning electron microscopy (IA-SEM), a recently developed approach for nanoscale 3D imaging of whole cells. Using IA-SEM, we show the presence of an extensive network of HIV-1-containing tubular compartments in infected macrophages, with diameters of approximately 150-200 nm, and lengths of up to approximately 5 microm that extend to the cell surface from vesicular compartments that contain assembling HIV-1 virions. These types of surface-connected tubular compartments are not observed in T cells infected with the 29/31 KE Gag-matrix mutant where the virus is targeted to multi-vesicular bodies and released into the extracellular medium. IA-SEM imaging also allows visualization of large sheet-like structures that extend outward from the surfaces of macrophages, which may bend and fold back to allow continual creation of viral compartments and virion-lined channels. This potential mechanism for efficient virus trafficking between the cell surface and interior may represent a subversion of pre-existing vesicular machinery for antigen capture, processing, sequestration, and presentation.
🔬 Techniques
🔭 Microscopes
💻 Software
🧪 Sample Preparation
🔬 Cell Lines
🏭 Microscope Brands
💻 Software Details
🏛️ Research Organizations (ROR)
Affiliated research institutions:
📋 Methods
Ion Abrasion Scanning Electron Microscopy
Resin blocks from standard flat embedding moulds (EMS, Hatfield, PA) were trimmed to a pyramidal shape using a razor blade with block faces typically of about 2 mm 2 in area. The surface was smoothened by sectioning using a conventional 45° diamond knife from Diatome (distributed by EMS, Hatfield, PA). The entire pyramidal block was removed and mounted with the wider base onto an SEM stub using silver paint (SPI Supplies, West Chester, PA) such that the ultramicrotome-prepared, flat surface of the resin block pointed upwards, perpendicular to the electron column. For room temperature experiments, images were recorded using a Nova 200 NanoLab dual beam instrument (FEI, Hillsboro, OR) equipped with a gallium ion source for focused ion beam milling and a field emission gun scanning electron microscope with an in-lens secondary electron detector for imaging. Prior to milling and SEM imaging, the entire sample surface was coated with a platinum/palladium layer (∼1 µm thickness) using the gas injector system (GIS) in the main specimen chamber. The specimen stage was tilted to 52° and exposed to the focused ion beam (such that the plane of the stage was parallel to the ion beam). A cross sectional cut was introduced in two stages. First, a coarse cut was made at high beam currents (typically 7–20 nA) and at an accelerating voltage of 30 kV to create a trench that enabled viewing of the cross-section. Usually, 50–150-µm-wide trenches were cut into the specimen. In the second step, the ion beam was scanned using a current of 3–7 nA to polish and smoothen the surface. Secondary electron SEM images were typically recorded at accelerating voltages of 3 kV, 10,000× magnification, and a beam current of 68–270 pA in the immersion lens mode. For slice-and-view images series, a step size of ∼15 nm was chosen for the removal of material from the specimen surface using the focused ion beam. All images are presented with inverted contrast in the figures and videos for ease of comparison to images obtained from transmission electron microscopy.
Show full methods section
Ion Abrasion Scanning Electron Microscopy
Resin blocks from standard flat embedding moulds (EMS, Hatfield, PA) were trimmed to a pyramidal shape using a razor blade with block faces typically of about 2 mm 2 in area. The surface was smoothened by sectioning using a conventional 45° diamond knife from Diatome (distributed by EMS, Hatfield, PA). The entire pyramidal block was removed and mounted with the wider base onto an SEM stub using silver paint (SPI Supplies, West Chester, PA) such that the ultramicrotome-prepared, flat surface of the resin block pointed upwards, perpendicular to the electron column. For room temperature experiments, images were recorded using a Nova 200 NanoLab dual beam instrument (FEI, Hillsboro, OR) equipped with a gallium ion source for focused ion beam milling and a field emission gun scanning electron microscope with an in-lens secondary electron detector for imaging. Prior to milling and SEM imaging, the entire sample surface was coated with a platinum/palladium layer (∼1 µm thickness) using the gas injector system (GIS) in the main specimen chamber. The specimen stage was tilted to 52° and exposed to the focused ion beam (such that the plane of the stage was parallel to the ion beam). A cross sectional cut was introduced in two stages. First, a coarse cut was made at high beam currents (typically 7–20 nA) and at an accelerating voltage of 30 kV to create a trench that enabled viewing of the cross-section. Usually, 50–150-µm-wide trenches were cut into the specimen. In the second step, the ion beam was scanned using a current of 3–7 nA to polish and smoothen the surface. Secondary electron SEM images were typically recorded at accelerating voltages of 3 kV, 10,000× magnification, and a beam current of 68–270 pA in the immersion lens mode. For slice-and-view images series, a step size of ∼15 nm was chosen for the removal of material from the specimen surface using the focused ion beam. All images are presented with inverted contrast in the figures and videos for ease of comparison to images obtained from transmission electron microscopy.
Preparation of HIV-1-Infected Macrophages and T Cells
Primary monocyte-derived macrophages were infected with either (i) vesicular stomatitis virus G glycoprotein (VSV-G)-pseudotyped, Env-defective HIV-1 virus stocks produced by co-transfection of 293T cells with pNL4-3/KFS/MA-TC [5] , [16] and the VSV-G expression vector pHCMV-G [17] or (ii) infectious HIV-1 BaL. We used Env-defective HIV-1 viruses for most of the studies to eliminate the possible formation of an apparently internal compartment resulting from fusion of two previously separate cells. The electron tomographic analyses with fixed, embedded cells were carried out with infectious HIV-1 BaL. Three days post-infection, the infected macrophages were harvested and processed for electron tomographic and IA-SEM experiments. Jurkat T cells were cultured in RPMI-1640 medium supplemented with 10% FBS and infected for 4–5 hrs with NL4-3/29/31KE virions pseudotyped with VSV-G. Infected cells were harvested 24–48 hrs post-infection and processed for electron microscopy.
Preparation of HIV-Expressing Macrophages for IA-SEM
HIV-1-expressing macrophages were prepared for imaging by adding freshly prepared 2X fixative buffer (5% glutaraldehyde in 0.2 M sodium cacodylate) to the cell culture medium in a 1∶1 ratio immediately after pre-warming it to the cell culture temperature, followed by incubation at this temperature for 30 min. The 2X fixative buffer was then replaced by fresh 1X fixative buffer (2.5% glutaraldehyde, 0.1 M sodium cacodylate), followed by incubation at room temperature for 15 min. The cells were centrifuged at 12,000×g and the pellet trimmed into small blocks (∼2 mm square) with an acetone-cleaned razor blade. The samples were transferred into glass scintillation vials containing 0.1 M sodium cacodylate buffer, rinsed 3 times with the buffer for 10 minutes each, and post-fixed with 1% osmium tetroxide in 0.1 M sodium cacodylate buffer (OsO 4 ) for 1 hr, followed by 2 more washes in 0.1 M cacodylate buffer for 10 minutes each. The samples were washed in a cold sodium acetate buffer (0.1 M) once and stained en bloc with 0.5% uranyl acetate in 0.1 M acetate buffer for 1 hr, followed by 3 more washes in acetate buffer. The samples were dehydrated through graded ethyl alcohol followed by propylene oxide. Samples were then infiltrated overnight at room temperature with a 1∶1 mixture of Epoxy resin: propylene oxide, embedded in Embed 812 (Electron Microscopy Sciences, Inc.) and cured for 48 hrs in a 55°C oven.
Cryo-Electron Tomography of HIV-1 Infected Macrophages Monocyte-derived macrophages
(MDM) from healthy donors were grown in RPMI-1640 media supplemented with 10% fetal calf serum. The cells were plated on gold Quantifoil grids (Quantifoil Micro Tools GmbH, Germany) and infected with VSV-G pseudotyped HIV-NL4-3/MA-TC virus for 4 hrs (10 6 cells+10 5 RT cpm virus). The cells were washed gently and incubated in media at 37°C for a further 4 days, with a change in culture medium after 2 days. They were then fixed overnight in 2.5% glutaraldehyde and rinsed with PBS. After deposition of 15 nm-sized gold fiducials on the grid, the cells were rapidly frozen by plunging the grid into liquid ethane maintained at ∼−180°C using a Vitrobot device (FEI Company, Oregon). The grids were imaged at liquid nitrogen temperatures on a Titan Krios electron microscope (FEI Company, Oregon) equipped with a Gatan 2002 energy filter and operated at 200 kV. Low dose tomographic tilt series were collected over a tilt range spanning ±65° in 1.5° intervals with a total dose of ∼75 e − /Å 2 , with an applied defocus of −15 µm, and an effective pixel size of 1.9 nm at the specimen plane. Tomograms were reconstructed using the software package IMOD [18] , [19] .
Electron Tomography of Thin Sections
MDM that had been infected for 7 days with the primary isolate strain HIV-1 BaL were provided by Tracy Hartman and Robert Buckheit (Imquest Biosciences, Frederick, MD), and prepared for sectioning with the same procedure used for IA-SEM above. Samples were cut into 90–100 nm-thick sections using a Leica Ultracut T Microtome (Leica Microsystems, Vienna, Austria), placed on carbon-coated copper EM grids, stained with lead citrate, coated with 10 nm gold beads (Nanoprobes, Yaphank, NY), and imaged in a Tecnai 12 transmission electron microscope at 120 kV, 52,000× magnification (image pixel size = 0.44 nm), and applied defocus of −1 µm. Tilt series were recorded using the Xplore3D software (FEI, Netherlands), and the Saxton tilt scheme with an initial tilt increment of 2°. Data were collected either as single axis tilt series and reconstructed using weighted back-projection (for fixed, embedded sections), or as dual axis tilt series which were aligned, reconstructed, and merged into dual-axis tomograms (data in Video S1 ). Reconstructions were carried out in the environment of the software package IMOD [18] , [19] . 3D Visualization of IA-SEM Image Stacks Image stacks were aligned using the Inspect3D software package (FEI, Netherlands). Individual virons were automatically identified with a spherical Hough transform. Segmentation of the cell was accomplished with a combination of region growing and level-set methods found in the Insight Toolkit ( http://www.itk.org ). These results were then verified and refined with manual classification, specifically for the details in the virion channels, with Slicer3D ( http://www.slicer.org ). The resulting models were then rendered with 3ds MAX software using Brazil, a rendering plug-in.
Supporting Information Video S1 Slices through a dual-axis tomogram obtained from 150 nm thick cell sections cur from a fixed, stained, plastic-embedded block containing HIV-1 infected macrophages. Primary human monocyte-derived macrophages (MDM) were infected for 7 days with the primary isolate HIV-1 BaL. The region of the cell that can be explored is limited by the thickness of the section. (9.95 MB WMV) Click here for additional data file. Video S2 Image stack obtained by ion abrasion scanning electron microscopy (IA-SEM) illustrating the interior of an HIV-1-infected MDM. The sharp straight faces in this video and in Videos S3 , S4 , S5 and S6 correspond to the edge of the imaging trench. Virions are visible as small particles of ∼120 nm diameter. (9.94 MB WMV) Click here for additional data file. Video S3 Image stack obtained by IA-SEM highlighting a virion-containing vacuole (lower left corner). In this instance, the vacuole is connected to the cell surface by a virion channel that passes over it. (10.02 MB WMV) Click here for additional data file. Video S4 Image stack obtained by IA-SEM highlighting a virion-containing vacuole. The vacuole appears to be completely internal and not connected with the cell surface. Budding, immature, and mature virions are present. (9.83 MB WMV) Click here for additional data file. Video S5 Image stack obtained by IA-SEM highlighting a site of concentrated viral budding from an electron-dense membrane region proximal to a filopodium at the cell surface. (4.57 MB WMV) Click here for additional data file. Video S6 Image stack obtained by IA-SEM highlighting three “virion channels” that proceed from the vacuole: one in the z-direction (first part of the stack) and two roughly in the x-y plane (visible at near the end of the stack). Budding, immature, and mature virions are present. (9.97 MB WMV) Click here for additional data file. Video S7 Animation of segmented image of long virion channel shown in Figure 4E . (3.09 MB WMV) Click here for additional data file. Video S8 Example of image stacks obtained by IA-SEM illustrating the interiors of Jurkat T cells infected with the 29/31 Gag matrix mutant. The cross-sectional views include the width of the entire cell, and show numerous spherical vacuoles, likely to represent endosomal compartments. There is no evidence of long virion channels in these cells. (4.05 MB AVI) Click here for additional data file. Video S9 Example of image stacks obtained by IA-SEM illustrating the interiors of Jurkat T cells infected with the 29/31 Gag matrix mutant. The cross-sectional views include the width of the entire cell, and show numerous spherical vacuoles, likely to represent endosomal compartments. There is no evidence of long virion channels in these cells. (4.43 MB AVI) Click here for additional data file. Video S10 View of three-dimensional segmentation of wavelike projections emanating from the plasma membrane of an HIV-1-infected MDM imaged by IA-SEM (corresponding to data presented in Figure 6A ). A slice from the image stack is shown to indicate that the large wavelike surface projections could be mistakenly identified as filopodia with a “cylindrical” cross-section by conventional 2D transmission electron microscopy. (7.21 MB WMV) Click here for additional data file.
📊 Figures
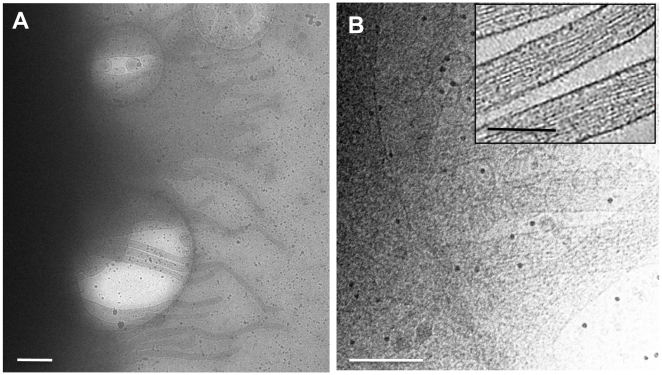
Figure 1
Cryo-electron tomography of HIV-1 infected monocyte-derived macrophages (MDM).
(A) Projection image of the edge of an infected cell at low magnifications indicating that no useful image contrast is obtained in most regions of the cell except at the very outer edges. (B) Projecti...
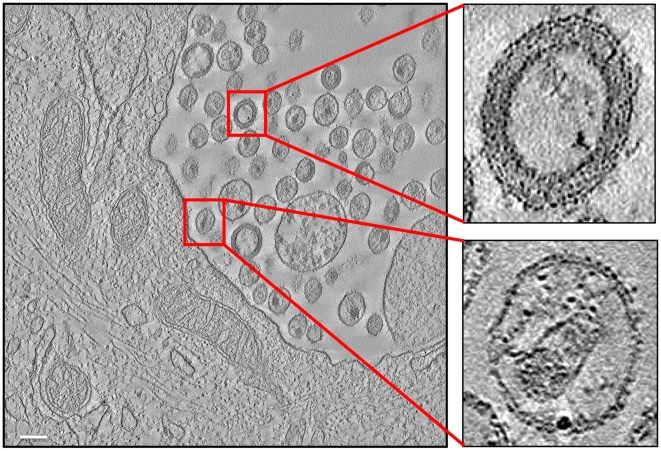
Figure 2
Electron tomography of a 150 nm thick section from HIV-1 BaL infected macrophages.
A tomographic slice (nominal thickness 1 nm) through a region of the cell containing a collection of viruses in an internal compartment. The expanded insets show zoomed-in images of individual immatur...
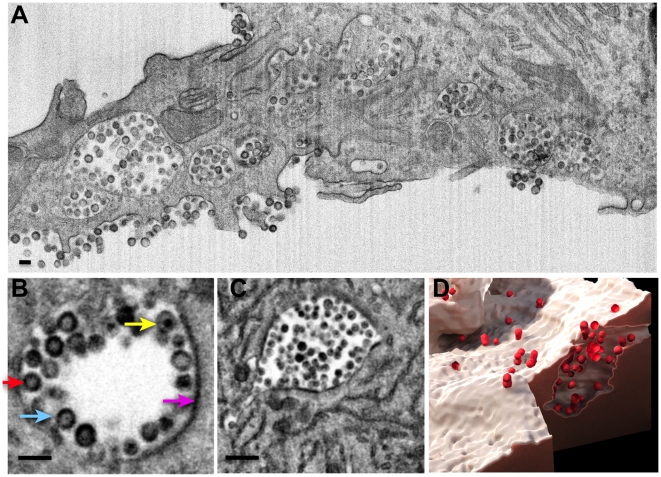
Figure 3
Virion reservoirs and channels in primary HIV-1-infected MDM revealed by IA-SEM imaging.
(A) Single cross-sectional image shows internal compartments, highlighted further in (B) indicating budding (light blue arrow), immature (red arrow), and mature (yellow arrow) virions, and membrane bo...
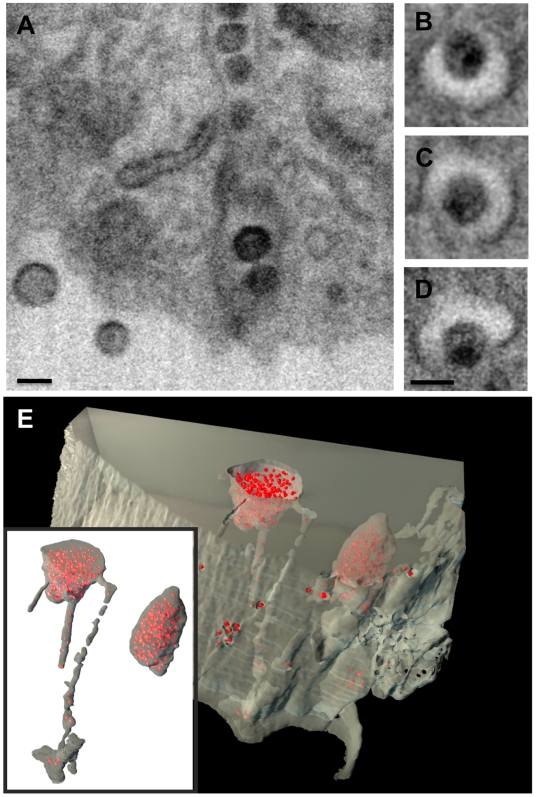
Figure 4
Virion channels of roughly uniform diameter allow communication between deep internal reservoirs and the plasma membrane of primary HIV-1-infected MDM.
Individual IA-SEM images of virion channels identified by dual beam imaging are shown in (A) transverse and (Bu2013D) axial sections. Scale bars are 100 nm long. (E) and inset: Illustration of the dep...
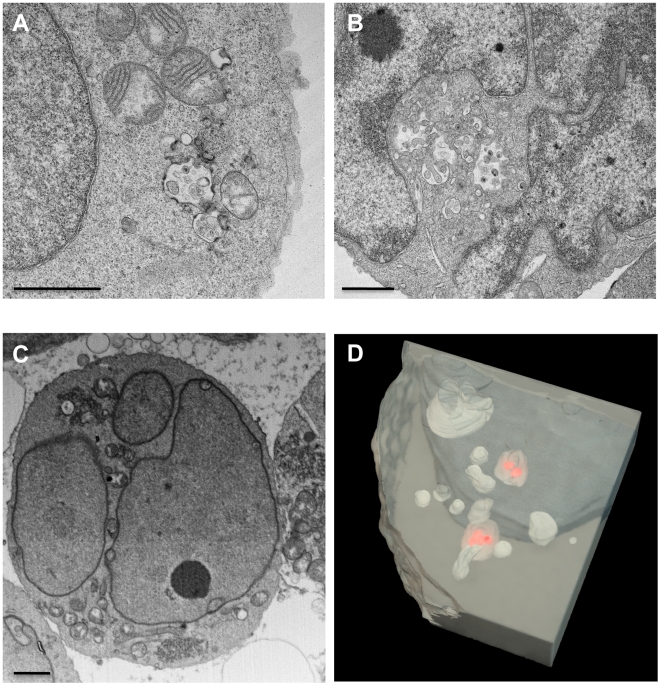
Figure 5
Transmission electron microscopic and IA-SEM imaging of Jurkat T cells infected with the VSV-G pseudotyped 29/31 HIV-1 Gag matrix mutant.
(A, B) Selected projection TEM images from a 100 nm thick section obtained from fixed, osmium-stained, plastic-embedded cells. Small vacuolar compartments, some containing viruses can be visualized in...
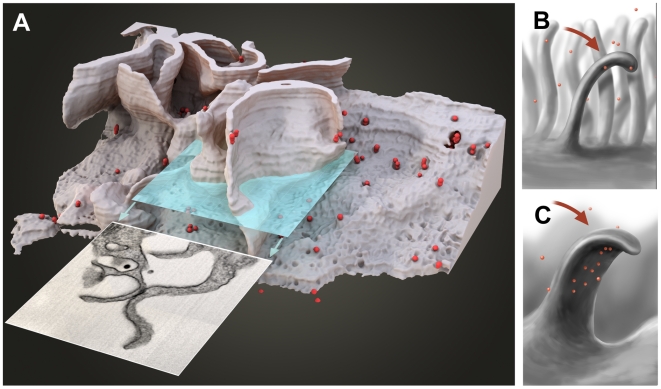
Figure 6
3D representation of the surface and interior of an HIV-infected macrophage (animation is presented in Video S10 ).
(A) Sections that would appear to contain u201cfilopodiau201d when imaged by transmission electron microscopy of individual sections can actually correspond to large wavelike membrane processes as in ...
Figure images are served from the NIH/NLM PubMed Central Open Access Subset or Europe PMC; copyright remains with the publishers and authors.
💬 Discussion
0 commentsNo comments yet. Be the first to start a discussion!
Leave a Comment