Abstract
AbstractA key feature that differentiates prokaryotic cells from eukaryotes is the absence of an intracellular membrane surrounding the chromosomal DNA. Here, we isolate a member of the ubiquitous, yet-to-be-cultivated phylum ‘Candidatus Atribacteria’ (also known as OP9) that has an intracytoplasmic membrane apparently surrounding the nucleoid. The isolate, RT761, is a subsurface-derived anaerobic bacterium that appears to have three lipid membrane-like layers, as shown by cryo-electron tomography. Our observations are consistent with a classical gram-negative structure with an additional intracytoplasmic membrane. However, further studies are needed to provide conclusive evidence for this unique intracellular structure. The RT761 genome encodes proteins with features that might be related to the complex cellular structure, including: N-terminal extensions in proteins involved in important processes (such as cell-division protein FtsZ); one of the highest percentages of transmembrane proteins among gram-negative bacteria; and predicted Sec-secreted proteins with unique signal peptides. Physiologically, RT761 primarily produces hydrogen for electron disposal during sugar degradation, and co-cultivation with a hydrogen-scavenging methanogen improves growth. We propose RT761 as a new species, Atribacter laminatus gen. nov. sp. nov. and a new phylum, Atribacterota phy. nov.
🔬 Techniques
🔭 Microscopes
💻 Software
✨ Fluorophores
🧪 Sample Preparation
🏭 Microscope Brands
🧪 Reagent Suppliers
💻 Software Details
🏛️ Research Organizations (ROR)
Affiliated research institutions:
📋 Methods
Sample collection
The sediment and formation water samples were collected from a settling pond that was placed downstream of a commercial gas, and water producing well to remove suspended sand particles from the formation water in Mobara, Chiba prefecture, Japan. The samples came from the gas-bearing aquifers in the screened depth range of 490–900 m that consist of repeating sequences of turbidite (alternating beds of sandstone and mudstone) in the Otadai and Kiwada formations. These sediments were deposited in deep marine environments during the Plio-Pleistocene periods 32 , 33 . The water temperature was 24.4 °C, the pH was 7.7, and the redox potential was −213 mV. The Cl − concentration was 17,000 mg l −1 , and the sulfate concentration was 30% similarity and >70% coverage. Secondary structure of amino acid sequences of N-terminal extension associated with FtsZ was predicted using JPred4 40 . Transmembrane proteins and signal peptides were predicted using TMHMM v2.0 41 (default options) and SignalP (v4.1 19 and v5.0 20 using the gram-negative option and default options for the remaining settings) correspondingly, and the percentages of these proteins out of the total number of ORFs were compared to those in all gram-negative type strain draft genomes available on the Joint Genome Institute Integrated Microbial Genomes and Microbiomes database 41 , 42 , and those in draft genomes of uncultured phyla that were confirmed to encode lipid A synthesis genes (lpxB, lpxC, or lpxD) in at least one draft genome. The 16S rRNA gene sequences were aligned against the SILVA v132 alignment using SILVA SINA Aligner v1.2.11 43 with default settings. The phylogenetic tree was constructed using RAxML-NG 44 using the generalized time reversible (GTR) model, 4 gamma categories, and 100 bootstrap iterations. Prediction/selection of conserved genes and tree construction was performed through PhyloPhlAn 45 using default settings. RNA was extracted from late exponential growth of both pure culture and co-culture with a methanogen M. thermoautotrophicus str. Delta H using the ISOSPIN Plant RNA kit (NIPPON GENE, Japan) according to the manufacturer’s instructions and was sequenced using an Illumina sequencer NovaSeq 600 system (illumina, USA) at Filgen, Inc. (Nagoya, Japan). Total RNA was depleted of ribosomal RNA via Ribo-Zero rRNA removal kit (illumina). The sequenced RNA was trimmed via Trimmomatic v0.33 46 and mapped to the assembled genome through BBmap v37.10 ( https://sourceforge.net/projects/bbmap/ ) to calculate the gene expression levels, which were represented by Reads Per Kilobase of transcript per Million mapped reads.
Show full methods section
Sample collection
The sediment and formation water samples were collected from a settling pond that was placed downstream of a commercial gas, and water producing well to remove suspended sand particles from the formation water in Mobara, Chiba prefecture, Japan. The samples came from the gas-bearing aquifers in the screened depth range of 490–900 m that consist of repeating sequences of turbidite (alternating beds of sandstone and mudstone) in the Otadai and Kiwada formations. These sediments were deposited in deep marine environments during the Plio-Pleistocene periods 32 , 33 . The water temperature was 24.4 °C, the pH was 7.7, and the redox potential was −213 mV. The Cl − concentration was 17,000 mg l −1 , and the sulfate concentration was 30% similarity and >70% coverage. Secondary structure of amino acid sequences of N-terminal extension associated with FtsZ was predicted using JPred4 40 . Transmembrane proteins and signal peptides were predicted using TMHMM v2.0 41 (default options) and SignalP (v4.1 19 and v5.0 20 using the gram-negative option and default options for the remaining settings) correspondingly, and the percentages of these proteins out of the total number of ORFs were compared to those in all gram-negative type strain draft genomes available on the Joint Genome Institute Integrated Microbial Genomes and Microbiomes database 41 , 42 , and those in draft genomes of uncultured phyla that were confirmed to encode lipid A synthesis genes (lpxB, lpxC, or lpxD) in at least one draft genome. The 16S rRNA gene sequences were aligned against the SILVA v132 alignment using SILVA SINA Aligner v1.2.11 43 with default settings. The phylogenetic tree was constructed using RAxML-NG 44 using the generalized time reversible (GTR) model, 4 gamma categories, and 100 bootstrap iterations. Prediction/selection of conserved genes and tree construction was performed through PhyloPhlAn 45 using default settings. RNA was extracted from late exponential growth of both pure culture and co-culture with a methanogen M. thermoautotrophicus str. Delta H using the ISOSPIN Plant RNA kit (NIPPON GENE, Japan) according to the manufacturer’s instructions and was sequenced using an Illumina sequencer NovaSeq 600 system (illumina, USA) at Filgen, Inc. (Nagoya, Japan). Total RNA was depleted of ribosomal RNA via Ribo-Zero rRNA removal kit (illumina). The sequenced RNA was trimmed via Trimmomatic v0.33 46 and mapped to the assembled genome through BBmap v37.10 ( https://sourceforge.net/projects/bbmap/ ) to calculate the gene expression levels, which were represented by Reads Per Kilobase of transcript per Million mapped reads.
Microscopic analyses
Cell morphology and structure was observed via phase-contrast and fluorescence microscopy (BX51; Olympus, Japan), confocal laser scanning microscopy (LSM800; ZEISS, Germany), scanning electron microscopy (SEM) (S-4500; Hitachi, Japan), transmission electron microscopy (TEM) (H-7600; Hitachi, Japan) and cryo-electron microscopy (CRYO ARM 300; JEOL, Japan). The cells in exponential phase of growth in pure culture condition were used for all microscopic observation. Cells were washed with phosphate-buffered saline (PBS) before staining. A Gram-staining kit (BD) was used for Gram staining. Membranes of RT761 cells were strained with FM4-64 (ThermoFisher Scientific, USA) at a final concentration of 40 µg ml −1 . DNA was strained with Hoechst 33342 (ThermoFisher Scientific) at final concentrations of 2 µg ml −1 . RNA was strained with SYTO RNAselect (ThermoFisher Scientific) at a final concentration of 10 µM. The stained sample was incubated for 1 h at 30 °C and observed under confocal laser scanning microscope. For fluorescence in situ hybridization, the cells were fixed in 1% paraformaldehyde at 4 °C for overnight and stored in 99% ethanol-PBS (1:1) at −20 °C. The fixed cells were incubated in a moisture chamber with a hybridization buffer (0.9 M NaCl, 0.01% sodium dodecyl sulfate, 20 mM Tris-HCl, pH 7.2 containing fluorescently labeled probes (0.5 pmol µl −1 ). After incubation at 46 °C for 2.5 h, the buffer was replaced with washing solution (0.9 M NaCl, 0.01% sodium dodecyl sulfate, 20 mM Tris-HCl, pH 7.2). The sample was incubated at 48 °C for 30 min and observed under a fluorescence phase-contrast microscope. An oligonucleotide probe targeting the 16S rRNA gene was Cy-3-labeled EUB338 probe (5′- GCTGCCTCCCGTAGGAGT-3′). For SEM observation, the cells were fixed with 2% glutaraldehyde in 0.1 M sodium phosphate buffer (pH7.2) at 4 °C for 2 h, postfixed with 1% osmium tetroxide at room temperature for 1 h, dehydrated through a graded ethanol series followed by 3-methylbutyl acetate for 20 min, dried with a critical point dryer (JCPD-5; JEOL), and finally coated with gold. For cryo-electron microscopy and tomography, 2 μl of the cell culture were placed on glow-discharged holey carbon grid (Quantifoil R 1/4 Cu grid, Quantifoil MicroTools GmbH, Germany), and the grid was automatically blotted at 22 °C and 80% humidity and plunged into liquid ethane using a Leica EM GP (Leica Microsystems, Austria). The frozen grid was mounted onto a liquid-nitrogen cryo-specimen holder and loaded into a CRYO ARM 300 equipped with a cold-field emission electron gun operating at 300 kV, a hole-free phase plate 47 and an omega-type in-column energy filter with an energy slit width of 30 eV. The images were recorded on K3 direct detection camera (GATAN, USA) at a nominal magnification of 10,000–15,000× (corresponding to an imaging resolution of 3.3–4.9 Å per pixel, with the total dose under 1.5 electrons per Å 2 using a low dose system). For observation of two leaflets of cellular layers, the images were recorded at a magnification of 60,000× (corresponding to an imaging resolution of 0.8 Å per pixel, with the total dose under 25 electrons per Å 2 using a low dose system). Tilt series images were collected automatically in a range of ±60° at 2° increments using the SerialEM v3.8.0 beta ( http://bio3d.colorado.edu/SerialEM ) 48 . The total electron dose on the specimen per tilt series was kept under approximately 90 electrons per Å 2 to minimize radiation damage. The tilt series were aligned using gold fiducials, and tomograms were reconstructed using the IMOD v4.9.12 49 . The 3D segmentation of eight times binned volumes including surface rendering and smoothing to generate the final tomographic model was performed with Amira v6.3.0 (ThermoFisher Scientific) according to the previously described method 50 . In brief, segmentation of each structure was traced manually using brush tools in Amira. The thickness of layers, distances between each layer and size of ribosomes were determined from 16 tomographic slice pictures of four different cells. The percentage of jagged structure in outline of outermost layer was measured from 15 cells of two-dimensional tomographic projection images. For TEM observation, the cells were fixed with 2.5% glutaraldehyde in 0.1 M sodium cacodylate buffer (pH7.4) at 4 °C for 3 h and then postfixed with 1% osmium tetroxide at 4 °C for 90 min. The fixed cells were suspended in 1% aqueous uranyl acetate at room temperature for 1 h. The suspended cells were embedded in 1.5% agarose and dehydrated through a graded ethanol series. The dehydrated blocks were embedded in Epon812 resin. Ultrathin sections were cut with an ultramicrotome (Leica EM UC7), mounted on copper grids, and stained with uranyl acetate and lead citrate.
Physiological characterization
All physiological experiments were performed in triplicate. The effects of temperature, pH, and concentrations of NaCl on cell growth, utilization of carbohydrates and sensitivity to antibiotics were determined by hydrogen production in gas phase of cultures. Hydrogen and methane in gas phase of cultures were measured with a gas chromatography equipped with a thermal conductivity detector (GC-8A; Shimadzu, Japan). Glucose, acetate, and ethanol in liquid phase of cultures were measured with a high-performance liquid chromatography (HPLC) (LC20; Shimadzu) with Shim-pack SPR-H column (Shimadzu) or HPLC (LC-2000Plus, Jasco) with Aminex HPX-87H column (BIO-RAD). Methyl esters of cellular fatty acids were identified and quantified via a gas chromatography-mass spectrometry (M7200A GC/3DQMS system; Hitachi).
Quantitative PCR SYBR green-based real-time
PCR was run on a CFX Connect real-time PCR detection system (Bio-Rad Laboratories Inc., USA) using the PowerUp SYBR green master mix (Applied Biosystems, USA) to quantify the population of RT761 cells. The forward and reverse primers, rt1F (5′-GCTAATACCCCATATGCTCCCTG-3′) and rt1R (5′-ACCTCGCCAACCAGCTGATGGGG-3′), were designed from the 16S rRNA gene sequences of strain RT761. The length of amplified products was 62 bp. Total DNA was extracted from pure- or co-cultures using an ISOSPIN Fecal DNA (NIPPON GENE). Standard curves for quantification were determined based on 10-fold serial dilutions of the target PCR products of strain RT761 at known concentrations. All reactions, including the non-template control, were performed in triplicate. The presence of a single PCR product without any nonspecific amplicons was confirmed via agarose gel and melting curve analyses. The PCR product was sequenced by Sanger sequencing to confirm the amplification of 16S rRNA gene from strain RT761. All qPCR runs showed no PCR amplifications from non-template control and culture samples without adding RT761 cells, and had efficiency levels of approximately 95%, with an R 2 of >0.99. Cell growth rate was estimated using 16S rRNA gene copy number as a proxy for cell population.
Statistics and reproducibility
For phase-contrast microscopic observation, a representative section of one field of view (Fig. 1a ) was selected from ten fields of view using cells from three independent cultures. For fluorescence microscopic observation, a representative section of one field of view (Fig. 2 ) was selected from eight fields of view from two independent experiments. For FISH observation, a representative section of one field of view (Supplementary Fig. 6a ) was selected from four fields of view from two independent experiments. For SEM observation, a representative section of one field of view (Fig. 1b ) was selected from 17 fields of view using cells from three independent cultures. For TEM observation, a representative section of one field of view (Fig. 1f ) was selected from 29 fields of view using cells from three independent cultures. For cryo-electron microscopy (at high electron dose), a representative section of one field of view (Supplementary Fig. 3 ) was selected from four fields of view from two independent cultures. For cryo-electron microscopy (at low electron dose), a representative section of one field of view (Supplementary Fig. 7 ) was selected from 30 fields of view using cells from two independent cultures. For CET, four different cells from two independent cultures were selected for tomographic analysis, and a representative section of one slice image with different binned volumes (Fig. 1c, d and Supplementary Figs. 4, 5, 7 ) from original 4092 tilt series in each dataset. Among these four cells, one cell was selected for segmentation and 3D reconstruction (Fig. 1e ). Reporting summary Further information on research design is available in the Nature Research Reporting Summary linked to this article.
Supplementary information Supplementary Information Peer Review File Description of Additional Supplementary Files Supplementary Data 1 Supplementary Data 2 Supplementary Data 3 Supplementary Movie 1 Supplementary Movie 2 Supplementary Movie 3 Supplementary Movie 4 Reporting Summary
📊 Figures
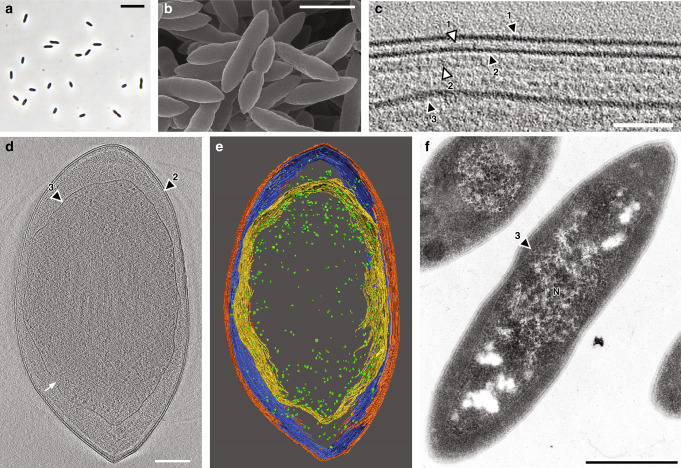
Fig. 1
Morphology and membrane structure in RT761 cells showing the presence of three lipid membrane-like layers (LMLs) with the innermost layer surrounding the nucleoid.
a Phase-contrast microscopy. b Scanning electron microscopy. c u2013 e Cryo-electron tomography (also see Supplementary Movies 1 and 2 ). c The original slice picture is shown in Supplementary Fig. 4 ...
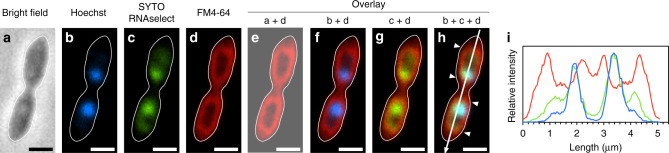
Fig. 2
Confocal-laser microscopy showing the localization of DNA and RNA within the intracytoplasmic membrane structure. DNA, RNA, and membrane lipids were stained by Hoechst (blue), SYTO RNAselect (green) and FM4-64 (red), respectively.
Outlines of the cell from a are included in all panels. a Phase contrast image. b u2013 d Confocal-laser images. e u2013 h Image overlays. i Line profiles of fluorescence intensity plotted longitudina...
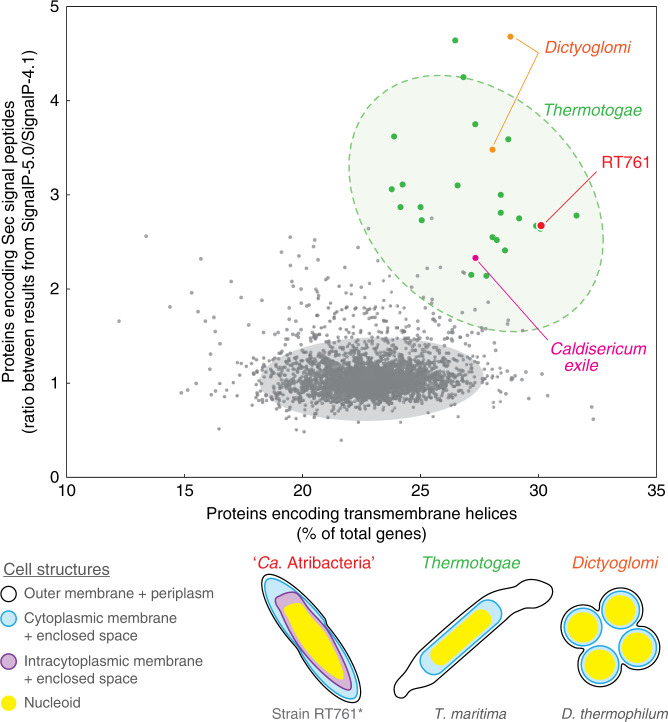
Fig. 3
Unique genomic compositions of membrane-related features observed for phyla with unique cell structures.
The horizontal axis shows the genomic proportion proteins encoding transmembrane helices. The vertical axis shows the ratio of proportions of proteins encoding Sec signal peptides estimated by SignalP...
Figure images are served from the NIH/NLM PubMed Central Open Access Subset or Europe PMC; copyright remains with the publishers and authors.
💬 Discussion
0 commentsNo comments yet. Be the first to start a discussion!
Leave a Comment