Abstract
Fluorescence microscopy is a powerful approach for studying subcellular dynamics at high spatiotemporal resolution; however, conventional fluorescence microscopy techniques are light-intensive and introduce unnecessary photodamage. Light-sheet fluorescence microscopy (LSFM) mitigates these problems by selectively illuminating the focal plane of the detection objective by using orthogonal excitation. Orthogonal excitation requires geometries that physically limit the detection objective numerical aperture (NA), thereby limiting both light-gathering efficiency (brightness) and native spatial resolution. We present a novel live-cell LSFM method, lateral interference tilted excitation (LITE), in which a tilted light sheet illuminates the detection objective focal plane without a sterically limiting illumination scheme. LITE is thus compatible with any detection objective, including oil immersion, without an upper NA limit. LITE combines the low photodamage of LSFM with high resolution, high brightness, and coverslip-based objectives. We demonstrate the utility of LITE for imaging animal, fungal, and plant model organisms over many hours at high spatiotemporal resolution.
🔬 Techniques
🧬 Organisms
💻 Software
✨ Fluorophores
🧪 Sample Preparation
🔬 Cell Lines
🏭 Microscope Brands
🧪 Reagent Suppliers
📷 Detectors
💻 Software Details
💾 Data Repositories
🏛️ Research Organizations (ROR)
Affiliated research institutions:
📋 Methods
LITE is a novel method for introducing a light sheet within the working distance of high-NA objective lenses for live-cell fluorescence microscopy ( Fig. 1 A ). In brief, these goals were accomplished by first directing a collimated, coherent beam of excitation light through a photomask and cylindrical lens. The cylindrical lens focused the excitation light to form a roughly “wedge-shaped” beam of light. The beam converged to its minimal thickness and formed the light sheet at the focal plane of the cylindrical lens, ∼3 cm away from the cylindrical lens. The photomask was used to pattern the focusing beam so that the light sheet was lengthened ( Golub et al., 2015 ). To access the working distance of high-NA lenses, the excitation light was tilted such that the bottom of the converging wedge was parallel to the detection objective focal plane. Thus, the light sheet was formed at the focal plane of the detection objective, in which the fluorescent sample was mounted. 3D imaging with LITE was made possible by supporting sample chambers on a vertical piezoelectric motorized stage and moving the sample through the sheet. LITE allows mounting samples on coverslips, provided the chambers also have an optically clear opening to allow access by the converging illumination light. We have engineered several suitable chambers and present imaging data from a diverse range of model organisms. We have included the parts list (commercial and custom parts) and assembly instructions for the LITE system in the supplemental materials (Tables S1 and S2 and Data S1 and S2). Illumination LITE imaging requires collimated, radially symmetric, coherent illumination light. We generated such a beam using a collimator illuminated by a laser combiner (Monolithic Laser Combiner 400; Agilent Technologies) with a fiber connector/angled physical contact fiber-coupled laser output of four wavelengths (405, 488, 561, and 650 nm). The four laser sources were solid state and prealigned to deliver a radially symmetric, coherent beam (Fig. S1). The maximal power outputs, after the fiber, of the four lasers in order of increasing wavelength were 18, 52, 55, and 37 mW, although only a fraction of each beam is used to generate the light sheet. The choice of illuminator should be based on specific application, fluorescent proteins in vivo in this case. An internal acousto-optical-tunable filter, analogue-controllable via DAQ Board interface, was used for modulating wavelength intensities. For brevity, we mainly describe our setup as monochromatic illumination at 488-nm excitation (for EGFP), although we outline two alternative methods for multicolor LITE imaging in Data S3. Beam conditioning LITE illumination involves conditioning from the laser source such that the diameter of the radially symmetric beam is magnified to a value that is equal to or greater than the full aperture of the slits of a customized photomask (see the next section). The beam should remain collimated after conditioning. Here, collimation and beam expansion were combined by a fiber connector/angled physical contact–coupled total internal reflection fluorescence microscopy collimator (Nikon Instruments) that achromatically collimated the lasers to a beam diameter of 22 mm (Fig. S1). Photomask/cylindrical lens system We used a cylindrical lens to focus a radially symmetric, collimated beam along one axis to approximate a nondiffracting “sheet” of light at the focus of the cylindrical lens. The sheet itself (in the focus of the cylindrical lens) can be approximately defined as a rectangular prism with three dimensions: the thinnest, diffraction-limited vertical width ( w ) that the converging laser reached at the cylindrical lens focal plane, the axial length ( L ) over which the laser remained at its diffraction-limited width before diverging, and the unfocused horizontal breadth ( b ) of the laser. The FWHM of the sheet (hereafter referred to as w ) is defined by Eq. 1 : w = n λ e x 2 ln 2 π N A e f f , (1) where n is the refractive index of the medium in which the laser was focused to a sheet (typically ∼1.33 for aqueously media, although this value varies based on the temperature and chemical composition of the media and the wavelength of the excitation light), λ ex is the wavelength of the excitation laser (in micrometers), and NA eff is the effective NA of the cylindrical lens. Note that NA eff can be smaller than the reported NA of the cylindrical lens, because NA eff depends on the percentage of the cylindrical lens NA that is used (i.e., the vertical height of the collimated excitation light incident on the cylindrical lens back aperture). Thus, w is inversely proportional to the diameter of the collimated beam incident to the cylindrical lens, assuming the beam diameter is less than the full cylindrical lens back aperture. The thinnest sheet possible is preferable in traditional LSFM, for two reasons: (1) to minimize out-of-focus excitation/emission in the fluorescent sample and (2) to prevent photodamage in out-of-focus planes. However, the choice of sheet thickness in LITE was complicated by the mathematical interdependence of w and L , in Eq. 2 : L = π w 2 2 λ e x . (2) As shown in Eq. 2 , it is evident that L increases with the square of w . Practically, this meant that the thinnest sheet possible (minimal w ) was not necessarily the best sheet for LITE, because the distance over which the sheet remains diffraction-limited ( L ) could have been too short to cover the FOV of the detection objective used for detecting the signal. If the sheet began to diverge over the FOV , then the illuminated slice of the fluorescent sample would vary significantly in both thickness and illumination intensity along the FOV . This would result in inconsistent excitation of fluorophores, making quantitative analysis of fluorescent images difficult. To maximize the L for a given w , we placed a quadruple-slit photomask (FrontRange Photomask) in the principle plane of the cylindrical lens, before the beam enters the lens (Fig. S1). The theoretical and practical design of these slits were first described and implemented by Golub et al. (2015) . In brief, this method increased L of a cylindrical lens-based light sheet beyond what Eq. 2 predicts by creating an interference pattern at the cylindrical lens focal plane between two harmonic cosine waves ( Golub et al., 2015 ) . Golub et al. (2015) presented the equation for the depth of field (DOF) of the elongated light sheet in Eq. 3 : L ' = λ e x f 2 R 1 2 , (3) where L′ is the elongated sheet length, f is the cylindrical lens focal length, and R 1 is the radius of the inner photomask slits ( Golub et al., 2015 ). To put Eq. 3 in terms of w , we equated R 1 to NA eff using Eq. 1 and substituted the equivalence into the Eq. 3 denominator to arrive at Eq. 4 : L ' = λ e x tan 2 [ sin − 1 ( λ e x 2 ln 2 π w ) ] . (4) In LITE as described here, the thickness and spacing of the photomask slits were scaled from the values for a 152-mm-focal-length cylindrical lens ( Golub et al., 2015 ) to the scale of our selected 40-mm-focal-length, aspheric, cylindrical lens (AYL5040-A; ThorLab). The optical trade-off of this interference strategy was the generation of side lobes and loss of illumination intensity. Side lobes should theoretically manifest as coplanar light sheets above and below the bright center peak of the main light sheet. However, >80% of the total laser energy should remain in the center sheet, because the side lobes destructively interfere ( Golub et al., 2015 ). Side-lobe minimization is important to reduce the probability of excitation and emission outside the detection objective focal plane.
Show full methods section
LITE is a novel method for introducing a light sheet within the working distance of high-NA objective lenses for live-cell fluorescence microscopy ( Fig. 1 A ). In brief, these goals were accomplished by first directing a collimated, coherent beam of excitation light through a photomask and cylindrical lens. The cylindrical lens focused the excitation light to form a roughly “wedge-shaped” beam of light. The beam converged to its minimal thickness and formed the light sheet at the focal plane of the cylindrical lens, ∼3 cm away from the cylindrical lens. The photomask was used to pattern the focusing beam so that the light sheet was lengthened ( Golub et al., 2015 ). To access the working distance of high-NA lenses, the excitation light was tilted such that the bottom of the converging wedge was parallel to the detection objective focal plane. Thus, the light sheet was formed at the focal plane of the detection objective, in which the fluorescent sample was mounted. 3D imaging with LITE was made possible by supporting sample chambers on a vertical piezoelectric motorized stage and moving the sample through the sheet. LITE allows mounting samples on coverslips, provided the chambers also have an optically clear opening to allow access by the converging illumination light. We have engineered several suitable chambers and present imaging data from a diverse range of model organisms. We have included the parts list (commercial and custom parts) and assembly instructions for the LITE system in the supplemental materials (Tables S1 and S2 and Data S1 and S2). Illumination LITE imaging requires collimated, radially symmetric, coherent illumination light. We generated such a beam using a collimator illuminated by a laser combiner (Monolithic Laser Combiner 400; Agilent Technologies) with a fiber connector/angled physical contact fiber-coupled laser output of four wavelengths (405, 488, 561, and 650 nm). The four laser sources were solid state and prealigned to deliver a radially symmetric, coherent beam (Fig. S1). The maximal power outputs, after the fiber, of the four lasers in order of increasing wavelength were 18, 52, 55, and 37 mW, although only a fraction of each beam is used to generate the light sheet. The choice of illuminator should be based on specific application, fluorescent proteins in vivo in this case. An internal acousto-optical-tunable filter, analogue-controllable via DAQ Board interface, was used for modulating wavelength intensities. For brevity, we mainly describe our setup as monochromatic illumination at 488-nm excitation (for EGFP), although we outline two alternative methods for multicolor LITE imaging in Data S3. Beam conditioning LITE illumination involves conditioning from the laser source such that the diameter of the radially symmetric beam is magnified to a value that is equal to or greater than the full aperture of the slits of a customized photomask (see the next section). The beam should remain collimated after conditioning. Here, collimation and beam expansion were combined by a fiber connector/angled physical contact–coupled total internal reflection fluorescence microscopy collimator (Nikon Instruments) that achromatically collimated the lasers to a beam diameter of 22 mm (Fig. S1). Photomask/cylindrical lens system We used a cylindrical lens to focus a radially symmetric, collimated beam along one axis to approximate a nondiffracting “sheet” of light at the focus of the cylindrical lens. The sheet itself (in the focus of the cylindrical lens) can be approximately defined as a rectangular prism with three dimensions: the thinnest, diffraction-limited vertical width ( w ) that the converging laser reached at the cylindrical lens focal plane, the axial length ( L ) over which the laser remained at its diffraction-limited width before diverging, and the unfocused horizontal breadth ( b ) of the laser. The FWHM of the sheet (hereafter referred to as w ) is defined by Eq. 1 : w = n λ e x 2 ln 2 π N A e f f , (1) where n is the refractive index of the medium in which the laser was focused to a sheet (typically ∼1.33 for aqueously media, although this value varies based on the temperature and chemical composition of the media and the wavelength of the excitation light), λ ex is the wavelength of the excitation laser (in micrometers), and NA eff is the effective NA of the cylindrical lens. Note that NA eff can be smaller than the reported NA of the cylindrical lens, because NA eff depends on the percentage of the cylindrical lens NA that is used (i.e., the vertical height of the collimated excitation light incident on the cylindrical lens back aperture). Thus, w is inversely proportional to the diameter of the collimated beam incident to the cylindrical lens, assuming the beam diameter is less than the full cylindrical lens back aperture. The thinnest sheet possible is preferable in traditional LSFM, for two reasons: (1) to minimize out-of-focus excitation/emission in the fluorescent sample and (2) to prevent photodamage in out-of-focus planes. However, the choice of sheet thickness in LITE was complicated by the mathematical interdependence of w and L , in Eq. 2 : L = π w 2 2 λ e x . (2) As shown in Eq. 2 , it is evident that L increases with the square of w . Practically, this meant that the thinnest sheet possible (minimal w ) was not necessarily the best sheet for LITE, because the distance over which the sheet remains diffraction-limited ( L ) could have been too short to cover the FOV of the detection objective used for detecting the signal. If the sheet began to diverge over the FOV , then the illuminated slice of the fluorescent sample would vary significantly in both thickness and illumination intensity along the FOV . This would result in inconsistent excitation of fluorophores, making quantitative analysis of fluorescent images difficult. To maximize the L for a given w , we placed a quadruple-slit photomask (FrontRange Photomask) in the principle plane of the cylindrical lens, before the beam enters the lens (Fig. S1). The theoretical and practical design of these slits were first described and implemented by Golub et al. (2015) . In brief, this method increased L of a cylindrical lens-based light sheet beyond what Eq. 2 predicts by creating an interference pattern at the cylindrical lens focal plane between two harmonic cosine waves ( Golub et al., 2015 ) . Golub et al. (2015) presented the equation for the depth of field (DOF) of the elongated light sheet in Eq. 3 : L ' = λ e x f 2 R 1 2 , (3) where L′ is the elongated sheet length, f is the cylindrical lens focal length, and R 1 is the radius of the inner photomask slits ( Golub et al., 2015 ). To put Eq. 3 in terms of w , we equated R 1 to NA eff using Eq. 1 and substituted the equivalence into the Eq. 3 denominator to arrive at Eq. 4 : L ' = λ e x tan 2 [ sin − 1 ( λ e x 2 ln 2 π w ) ] . (4) In LITE as described here, the thickness and spacing of the photomask slits were scaled from the values for a 152-mm-focal-length cylindrical lens ( Golub et al., 2015 ) to the scale of our selected 40-mm-focal-length, aspheric, cylindrical lens (AYL5040-A; ThorLab). The optical trade-off of this interference strategy was the generation of side lobes and loss of illumination intensity. Side lobes should theoretically manifest as coplanar light sheets above and below the bright center peak of the main light sheet. However, >80% of the total laser energy should remain in the center sheet, because the side lobes destructively interfere ( Golub et al., 2015 ). Side-lobe minimization is important to reduce the probability of excitation and emission outside the detection objective focal plane.
Optimization of sheet dimensions and parameters
Creating a nondiffracting light sheet of a width within an order of magnitude of the wavelength of light requires that the light be focused. Accordingly, previous light-sheet fluorescence microscopes have used standard (or custom) objective lenses to focus a beam to create a light sheet of a minimal width in the sample ( Huisken et al., 2004 ; Santi, 2011 ; Chen et al., 2014 ; Wu et al., 2016 ). This orthogonal, two-objective method sterically limits the choice of detection objectives to those with a long-enough working distance (>1 mm) to focus on the sheet, because the illumination and imaging objectives cannot touch. Here, we present a novel solution for using virtually any existing microscope objective, including those with high NA, for imaging fluorescence signal from a light sheet ( Fig. 1 A ). This represents a significant advance in LSFM, because biologists are no longer limited in their choice of objectives ( Fig. 1 B ). A detailed, a step-by-step method for selecting the ideal setup of a LITE microscope illuminator based on the desired objective is presented below. For effective imaging with LITE, it is necessary to illuminate an objective’s volume of view (VOV) while minimizing illumination outside the VOV. An objective’s VOV can be defined by the product of the 2D FOV and the 1D DOF . The DOF of an objective, otherwise known as axial resolution, is a set parameter that varies based on the NA and wavelength of the emitted fluorescence ( λ em ) that is collected by the objective ( Eq. 6 ). The relationship between the light-sheet FWHM thickness, w , and the detection objective DOF was derived from the necessity to form the light sheet at the coverglass surface so that it is within the working distance of high-NA objectives. Confined by this geometry, it is impossible to form a light sheet that is completely orthogonal to the focal plane of a high-NA objective within its standard working distance (typically
📊 Figures
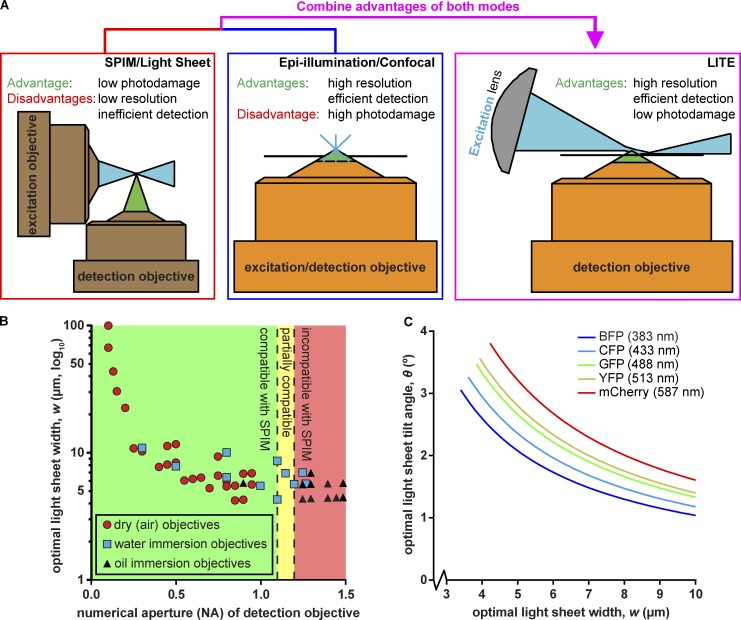
Figure 1.
Rationale and theory behind LITE. (A) We combined low photodamage of SPIM/LSFM (left) with high-NA objectives (orange) of epi-illumination/confocal microscopy (center) to create LITE (right). LITE til...
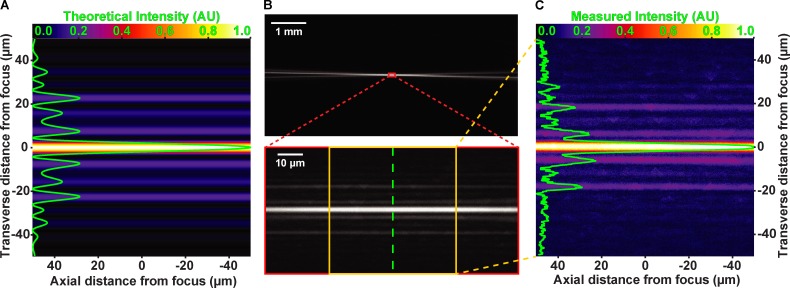
Figure 2.
Experimental verification of theoretical light sheet formation. All images in show light sheet from the side. (A) Theoretical interference pattern at cylindrical lens focus. Image has been false-color...
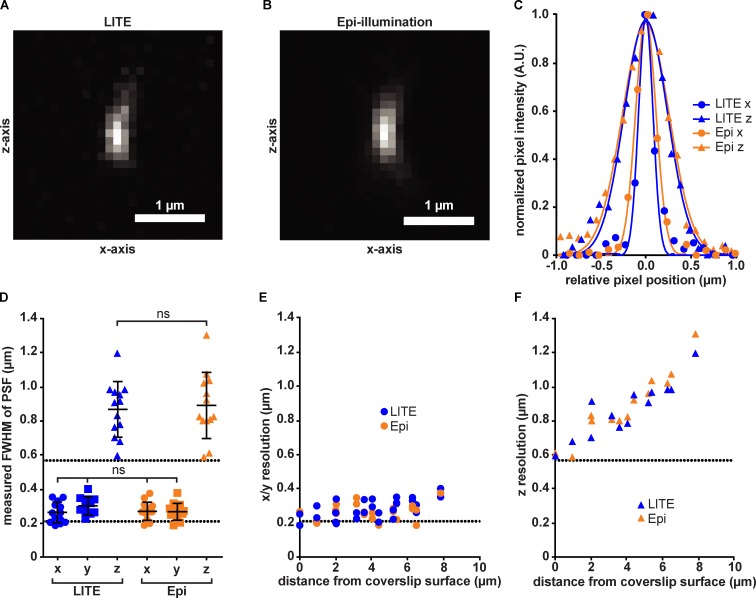
Figure 3.
Quantification of LITE spatial resolution. (A) Image of a fluorescent 100-nm bead, visualized by using LITE. Image is maximal-intensity projected along y axis to show lateral (x) and axial (z) resolut...
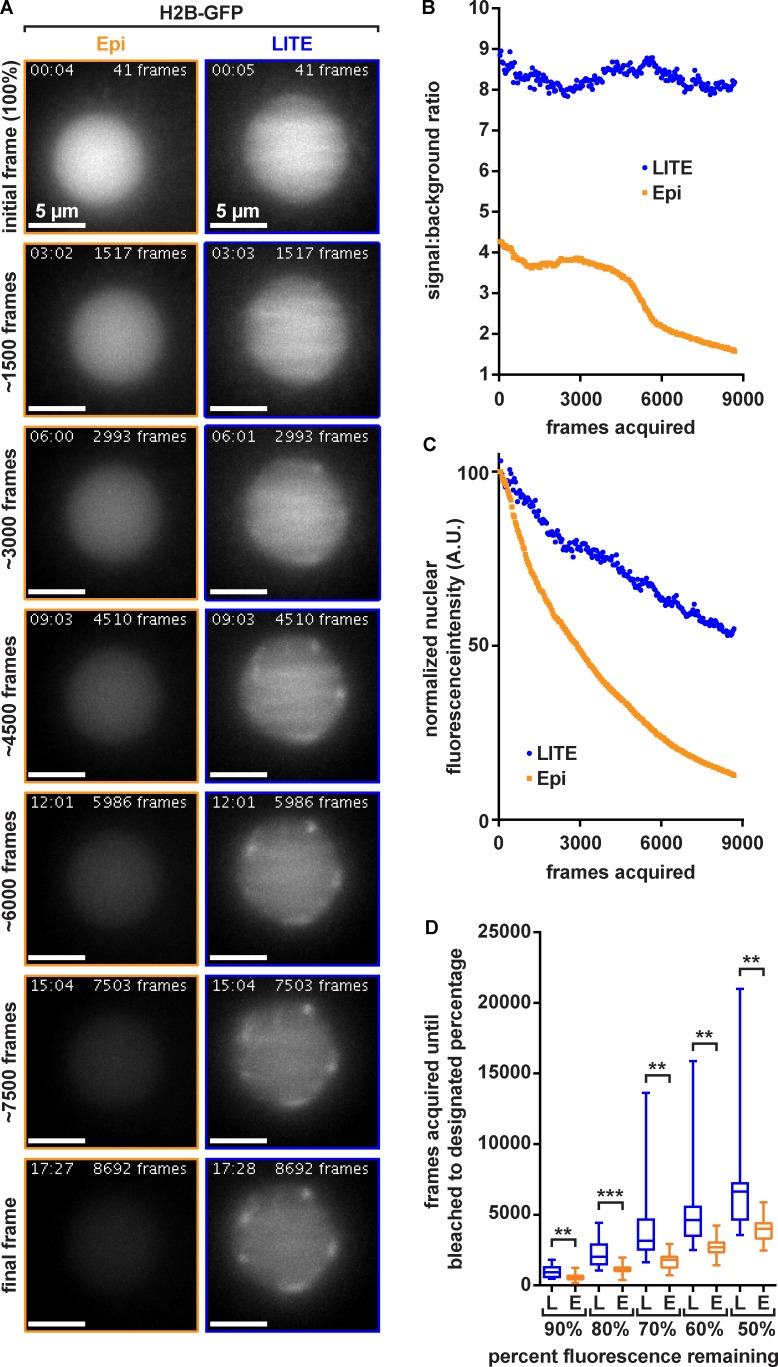
Figure 4.
Quantification of LITE photobleaching rates. (A) Representative image sets of C. elegans embryos expressing GFP-tagged histone H2B construct to visualize nuclei. Representative images show P1 nucleus....
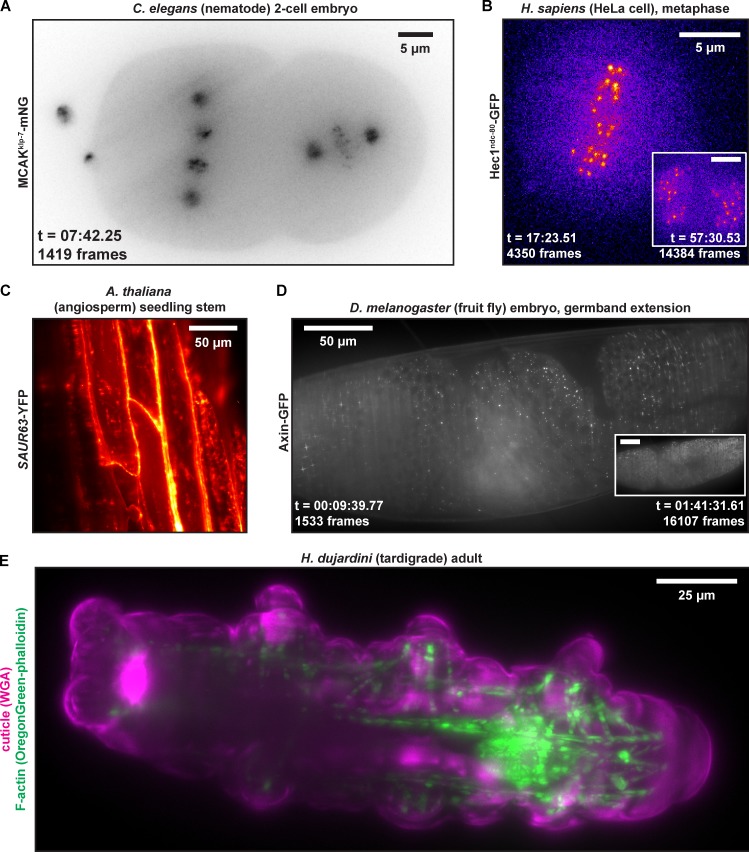
Figure 5.
Representative LITE fluorescent images taken of a variety of model organisms. The organisms include C. elegans (A), H. sapiens (B), A. thaliana (C), D. melanogaster (D), and H. dujardini (E). Fluoresc...
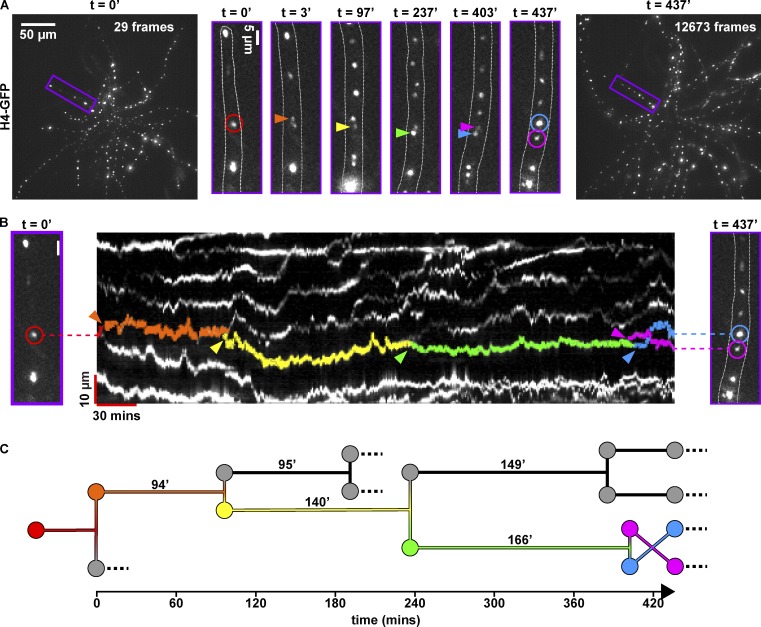
Figure 6.
Long-term nuclear pedigrees. (A) Pedigrees are shown in A. gossypii . Initial (left image), final (right image), and selected subsets (purple-outlined boxes, middle six images) of a 7-h time lapse of ...
Figure images are served from the NIH/NLM PubMed Central Open Access Subset or Europe PMC; copyright remains with the publishers and authors.
💬 Discussion
0 commentsNo comments yet. Be the first to start a discussion!
Leave a Comment