Abstract
BACKGROUND: Organoids are morphologically heterogeneous three-dimensional cell culture systems and serve as an ideal model for understanding the principles of collective cell behaviour in mammalian organs during development, homeostasis, regeneration, and pathogenesis. To investigate the underlying cell organisation principles of organoids, we imaged hundreds of pancreas and cholangiocarcinoma organoids in parallel using light sheet and bright-field microscopy for up to 7 days. RESULTS: We quantified organoid behaviour at single-cell (microscale), individual-organoid (mesoscale), and entire-culture (macroscale) levels. At single-cell resolution, we monitored formation, monolayer polarisation, and degeneration and identified diverse behaviours, including lumen expansion and decline (size oscillation), migration, rotation, and multi-organoid fusion. Detailed individual organoid quantifications lead to a mechanical 3D agent-based model. A derived scaling law and simulations support the hypotheses that size oscillations depend on organoid properties and cell division dynamics, which is confirmed by bright-field microscopy analysis of entire cultures. CONCLUSION: Our multiscale analysis provides a systematic picture of the diversity of cell organisation in organoids by identifying and quantifying the core regulatory principles of organoid morphogenesis.
🔬 Techniques
🔭 Microscopes
🧬 Organisms
💻 Software
✨ Fluorophores
🧪 Sample Preparation
🔬 Cell Lines
🏭 Microscope Brands
🧪 Reagent Suppliers
🔎 Objectives
💻 Software Details
💾 Data Repositories
🏛️ Research Organizations (ROR)
Affiliated research institutions:
📋 Methods
Agent-based mathematical model captures the experimental organoid dynamics and confirms theoretical considerations In order to confirm our hypotheses, we developed a mechanical 3D agent-based model for organoid size oscillations, based on the experimental data obtained by long-term single cell analysis of mPOs (Fig. 5 a; Additional file 11 : Fig. S10). Fig. 5 Computational simulation of a multi-agent object. a Illustration of the general model. b Snapshot of a simulated sphere cut in half. c Piecewise exponential-linear fit (black dashed lines) to the growth rates for the long-term single-cell analysis of mPOs. The colours resemble organoids shown in Fig. 3 . The dots indicate the cell count of the organoids. The coloured dashed lines indicate the transition from exponential to linear growth. d Volumes of the simulated organoids. The coloured dashed lines indicate the transition from an exponential to a linear growth rate. The coloured solid lines show the volumes of the spheres We hypothesise that the organoids can be represented as elastic spheres with a growing surface due to cell division (Fig. 5 b). The agents represent single cells applying mechanical forces onto neighbouring cells. Concerning the mechanical properties of the cells, we used a general framework describing epithelial cell-cell interaction, which was previously used to resolve the underlying dynamics of lung cancer cell migration and local cell fate clustering in inner cell mass organoids [ 25 , 30 ]. We hypothesise that the observed polarisation of the cells (Fig. 1 ) is maintaining the spherical shape of the organoids. Thus, a bending potential is added to the model. Based on the findings of Ruiz-Herrero et al. [ 24 ], we assume that the cells continuously secrete a substance into the lumen, which leads to an osmotic influx. This influx leads to an increase in the internal pressure which, however, can be balanced by an increase in volume. When the average distance of neighbouring cells exceeds a certain limit, the organoid shell ruptures, leading to a substantial outflow of liquid and deflation of the organoid. Following the law of parsimony, we consider the mechanical properties, cell size, and each cell’s contribution to the osmotic influx to be homogeneous for all organoids. In agreement with the data, cell division dynamics in the simulations differ between the organoids, but are also assumed homogeneous within the same organoid. Based on these assumptions, we derived that the organoid can balance the inner pressure when the cell count increases at least quadratically (Additional file 24 : Supplementary theoretical considerations). Furthermore, for small organoids, the ratio between surface and volume is smaller than for large organoids. Therefore, small organoids should reach a critical pressure for leakage faster than large organoids. Thus, we expect the size oscillations to critically depend on (a) the cell division dynamics and (b) the organoid size. The latter (b) is confirmed by the data obtained through bright-field analysis (Fig. 6 e). Fig. 6 Analysis of multiple monocystic mPOs reveals heterogeneity as well as core regulatory principles. a Overview bright-field images of mPOs displaying a monocystic phenotype. Microscope: Zeiss Axio Observer Z.1; objective lenses: Plan-Apochromat × 5/0.16, avg. z -projection, voxel size: 1.29 × 1.29 × 50 μm 3 , scale bar overview: 500 μm, close-up: 25 μm. b Schematic plot of feature extraction based on time-resolved bright-field images. Multiple features, such as the projected luminal area, expansion phases, and size oscillation events, were analysed. c The projected areas of single organoids growing within one well were analysed for 48 h, starting 12 h after seeding and revealed high heterogeneity in the projected areas. A high intercultural heterogeneity is illustrated by a broad inter quartile range (black) and outliers (dashed lines) within the box plot ( n = 34). d Medians of projected areas of three wells (technical replicates) differ. The medians of the normalised projected areas are coherent between individual wells. Median shown in c is highlighted in green ( n = 34, 31, 35). e The colour code signals the amount of registered size oscillation events. Smaller organoids display an increased number of oscillation events. Close-up reveals location of organoids collapsing four to six times ( n = 100). f The median of the average expansion factor is 0.11 (green line). Independent of their initial projected area [mm 2 ], 50% of all organoids display an average expansion factor between 0.09 and 0.14. Here, 12% of the organoids feature an average expansion factor above 0.22 and are marked as outliers (red) ( n = 100) The model is used to support the theoretical considerations and to qualitatively reproduce the size oscillations of the three analysed mPOs (Fig. 4 a, b). Hereby, the cell division rate is directly extracted from the experimental data (Fig. 3 b). Simulations of two large organoids do not show a size oscillation during phases of exponential cell number increase but start to oscillate after transitioning to a linear growth (Fig. 5 c, d, green and red lines). Simulations with a small organoid exhibit size oscillation even during the initial exponential growth, which confirms our hypothesis that small organoids are more prone to rupture and deflation (Fig. 5 c, d, blue lines; Fig. 6 e). Hence, the simulation results show a large qualitatively agreement in the size oscillations with the experimental data and also coincide with the analytical results.
Show full methods section
Agent-based mathematical model captures the experimental organoid dynamics and confirms theoretical considerations In order to confirm our hypotheses, we developed a mechanical 3D agent-based model for organoid size oscillations, based on the experimental data obtained by long-term single cell analysis of mPOs (Fig. 5 a; Additional file 11 : Fig. S10). Fig. 5 Computational simulation of a multi-agent object. a Illustration of the general model. b Snapshot of a simulated sphere cut in half. c Piecewise exponential-linear fit (black dashed lines) to the growth rates for the long-term single-cell analysis of mPOs. The colours resemble organoids shown in Fig. 3 . The dots indicate the cell count of the organoids. The coloured dashed lines indicate the transition from exponential to linear growth. d Volumes of the simulated organoids. The coloured dashed lines indicate the transition from an exponential to a linear growth rate. The coloured solid lines show the volumes of the spheres We hypothesise that the organoids can be represented as elastic spheres with a growing surface due to cell division (Fig. 5 b). The agents represent single cells applying mechanical forces onto neighbouring cells. Concerning the mechanical properties of the cells, we used a general framework describing epithelial cell-cell interaction, which was previously used to resolve the underlying dynamics of lung cancer cell migration and local cell fate clustering in inner cell mass organoids [ 25 , 30 ]. We hypothesise that the observed polarisation of the cells (Fig. 1 ) is maintaining the spherical shape of the organoids. Thus, a bending potential is added to the model. Based on the findings of Ruiz-Herrero et al. [ 24 ], we assume that the cells continuously secrete a substance into the lumen, which leads to an osmotic influx. This influx leads to an increase in the internal pressure which, however, can be balanced by an increase in volume. When the average distance of neighbouring cells exceeds a certain limit, the organoid shell ruptures, leading to a substantial outflow of liquid and deflation of the organoid. Following the law of parsimony, we consider the mechanical properties, cell size, and each cell’s contribution to the osmotic influx to be homogeneous for all organoids. In agreement with the data, cell division dynamics in the simulations differ between the organoids, but are also assumed homogeneous within the same organoid. Based on these assumptions, we derived that the organoid can balance the inner pressure when the cell count increases at least quadratically (Additional file 24 : Supplementary theoretical considerations). Furthermore, for small organoids, the ratio between surface and volume is smaller than for large organoids. Therefore, small organoids should reach a critical pressure for leakage faster than large organoids. Thus, we expect the size oscillations to critically depend on (a) the cell division dynamics and (b) the organoid size. The latter (b) is confirmed by the data obtained through bright-field analysis (Fig. 6 e). Fig. 6 Analysis of multiple monocystic mPOs reveals heterogeneity as well as core regulatory principles. a Overview bright-field images of mPOs displaying a monocystic phenotype. Microscope: Zeiss Axio Observer Z.1; objective lenses: Plan-Apochromat × 5/0.16, avg. z -projection, voxel size: 1.29 × 1.29 × 50 μm 3 , scale bar overview: 500 μm, close-up: 25 μm. b Schematic plot of feature extraction based on time-resolved bright-field images. Multiple features, such as the projected luminal area, expansion phases, and size oscillation events, were analysed. c The projected areas of single organoids growing within one well were analysed for 48 h, starting 12 h after seeding and revealed high heterogeneity in the projected areas. A high intercultural heterogeneity is illustrated by a broad inter quartile range (black) and outliers (dashed lines) within the box plot ( n = 34). d Medians of projected areas of three wells (technical replicates) differ. The medians of the normalised projected areas are coherent between individual wells. Median shown in c is highlighted in green ( n = 34, 31, 35). e The colour code signals the amount of registered size oscillation events. Smaller organoids display an increased number of oscillation events. Close-up reveals location of organoids collapsing four to six times ( n = 100). f The median of the average expansion factor is 0.11 (green line). Independent of their initial projected area [mm 2 ], 50% of all organoids display an average expansion factor between 0.09 and 0.14. Here, 12% of the organoids feature an average expansion factor above 0.22 and are marked as outliers (red) ( n = 100) The model is used to support the theoretical considerations and to qualitatively reproduce the size oscillations of the three analysed mPOs (Fig. 4 a, b). Hereby, the cell division rate is directly extracted from the experimental data (Fig. 3 b). Simulations of two large organoids do not show a size oscillation during phases of exponential cell number increase but start to oscillate after transitioning to a linear growth (Fig. 5 c, d, green and red lines). Simulations with a small organoid exhibit size oscillation even during the initial exponential growth, which confirms our hypothesis that small organoids are more prone to rupture and deflation (Fig. 5 c, d, blue lines; Fig. 6 e). Hence, the simulation results show a large qualitatively agreement in the size oscillations with the experimental data and also coincide with the analytical results.
Material and methods
Organoid culture hCCAOs were initiated from primary liver tumour biopsies of cholangiocarcinoma patients (~ 0.5 cm 3 ) collected during surgery performed at the Erasmus MC – University Medical Center Rotterdam (NL) and cultured as previously described [ 4 ]. mPOs were obtained from Meritxell Huch (Gurdon Institute, Cambridge, UK) and cultured as described [ 59 ]. Transgenic murine pancreas-derived organoids The transgenic mPO line was obtained from Meritxell Huch’s laboratory at the Wellcome Trust/CRUK Gurdon Institute, University of Cambridge, UK. The cells were isolated from the adult pancreas of the Rosa26-nTnG mouse line ( B6;129S6-Gt (ROSA)26Sortm1(CAG-tdTomato*,-EGFP*)Ees/J , stock no. 023035, The Jackson Laboratory, Bar Harbour, Maine) according to the isolation protocol [ 60 ]. Viral transduction of human liver-derived tumour organoids hCCAOs were transduced using a third generation lentivector (pLV-Puro-EF1A-H2B/EGFP:T2A:LifeAct/mCherry, vector ID: IK-VB180119-1097haw, custom-made by and commercially obtained from AMSBIO, Abingdon, UK) for stable expression of the fluorescent fusion proteins H2B-eGFP to visualise cell nuclei and LifeAct-mCherry to visualise the F-actin cytoskeleton. Lentiviral particles were commercially obtained from AMSBIO (Abingdon, UK). Viral transduction of organoids for stable expression of fluorescent markers in hCCAOs was performed according to a protocol published by Broutier et al. [ 60 ] with slight modifications. In brief, organoids were dissociated into small cell clusters by mechanical fragmentation in pre-warmed (37 °C) trypsin and subsequent incubation for 5–10 min. All centrifugation steps were carried out at room temperature. Positive (transduced) organoids were selectively picked under semi-sterile conditions instead of being selected by puromycin administration and were expanded into positively labelled cultures without sorting.
Light sheet pipeline
In order to generate single-cell resolved high-content data of organoid dynamics, the previously published ultra-thin FEP-foil cuvette [ 16 ] was used. To implement it into the Zeiss Lightsheet Z.1 system (Carl Zeiss AG, Oberkochen, Germany), a new positive module was produced, and the cuvette was connected with a capillary. Fabrication of positive moulds for vacuum forming We designed positive moulds of the cuvettes for the use in the Zeiss Lightsheet Z.1 system by using the free CAD software “123D Design” (version 2.2.14, Autodesk). We 3D-printed the positive moulds by using the service of the company Shapeways. Before use, the positive moulds were inspected by stereomicroscopy and cleaned by immersion in an ultrasonic bath. Cuvette fabrication with vacuum forming For a detailed description of the cuvette fabrication with vacuum forming refer to Hötte et al. [ 16 ]. In brief, a 10 cm × 10 cm squared patch of FEP-foil (50 μm thickness, batch no. GRN069662, Lohmann Technologies, Milton Keynes, UK) was clamped into the vacuum-forming machine (JT-18, Jin Tai Machining Company), heated up to 280 °C and pressed onto the square cross-section positive mould described in Additional file 3 : Fig. S2d-e. The positive mould was assembled with a 2 mm × 2 mm 3D-printed square cross-section rod and a glass capillary (borosilicate glass 3.3, material no. 0500, Hilgenberg GmbH, Malsfeld, Germany), cut to a length of about 15 mm with a diamond cutter (Additional file 3 : Fig. S2d-e). After vacuum forming of the FEP foil, the square cross-section rod was carefully removed, leaving the FEP cuvette supported by the glass capillary, which serves as mechanically stable connection with the Zeiss Z.1 holder. A shrinking tube (flame retardant polyolefin tube, size 3, cat. no. E255532, G-APEX, Yuanlin City, Taiwan) was used to close the FEP cuvette and to connect it to the glass capillary connected with the Zeiss Lightsheet Z.1 xyz stage (Blaubrand intraMark 200 μl micropipette, cat. no. 708757, BRAND GmbH & Co. KG, Wertheim am Maim, Germany) (Additional file 3 : Fig. S2f). In order to pipette the samples into the cuvette, the capillary was removed. Finally, the complete FEP cuvette setup was cleaned with a detergent solution (1% Hellmanex-II in ultrapure water), sterilised in 75% ethanol for at least 2 h and washed twice with PBS.
Specimen preparation
Organoids were cultured as described. During the splitting procedure, 20 μl of ECM containing mPO/hCCAO cell clusters were filled into the cuvette. To avoid air bubbles, the use of a 20 μl pipette tip is recommended (TipOne 10/20 μl, STARLAB, Hamburg, Germany). Subsequently, a glass capillary (Blaubrand intraMark 200 μl micropipette) that has been filled with expansion medium beforehand was connected. To ensure no leakage, the connections between the shrinking tube, the FEP cuvette, and the glass capillary were wrapped with Parafilm (Additional file 3 : Fig. S2). For imaging, the FEP cuvette attached to the capillary was inserted in the Zeiss Lightsheet Z1. The imaging medium in the Zeiss Lightsheet Z1 chamber was DMEM (without phenol red) dosed with 2% penicillin and streptomycin and HEPES (1:100). During the time of observation, the medium exchange was conducted under semi-sterile conditions directly at the microscope with a 10 μl microloader tip (Microloader Tip 0.5–10 μl/2–20 μl, Eppendorf AG, Hamburg, Germany) every 2 days. The organoid density within a cuvette can be varied by using more cell organoid fragments. However, with increasing amount of cells, the frequent medium exchange should be enhanced. Due to the monolayered luminal character of epithelial organoids, only minor effects of shadowing and light scattering were observed in the conducted experiments. However with increasing cell density, it may gain importance and need to be considered.
Image acquisition and microscopic feature extraction
Image stacks of the entire
Z1-FEP-cuvette containing the mPOs/hCCAOs were acquired with the Zeiss Lightsheet Z1 microscope. The mPO cells expressed Rosa26-nTnG and were exited with a 561 nm laser. The hCCAO cells expressed H2B-eGFP and LifeAct-mCherry and were exited with a 488 nm and 561 nm laser. Both cell lines were imaged with a Carl Zeiss W Plan-Apochromat × 20/1.0 UV_VIS objective and illuminated from two sides with Zeiss LSFM × 10/0.2. During the image acquisition, the chamber was temperature- and CO 2 -controlled and constantly filled with pre-warmed DMEM containing 2% penicillin and streptomycin and HEPES (1:100). Dependent on the number of z -slices, views, and tiles, the size of a long-term live imaging data set recorded with LSFM is usually in the hundreds of GB up to TB range (Additional file 6 : Fig. S5 and Additional file 7 : Fig. S6). To handle the data, the acquired image stacks were inspected and specific regions were cropped and exported via ZEN 3.2 (Blue edition, freeware) as TIFF files per z -slice and time point. mPO image stacks were cropped towards the corresponding organoid (Fiji, ImageJ) and all single time points of each organoid were segmented and processed separately by using the previous published multiscale image analysis pipeline [ 22 ] with the configurations mentioned in Additional file 23 : Table S1. For feature extraction and the surface approximation, the configurations mentioned in Additional file 23 : Table S1 were used.
Evaluation of segmentation performance
To evaluate the nuclei segmentation performance of the image analysis pipeline previously published [ 22 ] for live organoids, we generated ground truth (GT) data sets as a comparison to the segmentation result. For each individual organoid, a random time point was selected to manually identify the nuclei centroids of the entire organoid. A previously described custom programme [ 21 , 22 ] was used to identify cell nuclei correctly detected by the segmentation (true positives, TP) and falsely detect cell nuclei (false positives, FP) and the number of cell nuclei in the GT that was not detected by the segmentation (false negatives, FN). The numbers were determined by checking, if exactly one segmented nuclei centroid was found in the spherical neighbourhood range of ten voxels of a ground truth centroid. If multiple centroids were found in the neighbourhood range, the closest was registered as TP. Based on TP, NP, and FN, the recall, precision, and F score were calculated as described in Schmitz et al. [ 22 ] (Additional file 10 : Fig. S9 and Additional file 23 : Table S2). Movement visualisation using Arivis Vision4D 3D volume rendering and 3D cell tracking was performed with Arivis Vision4D (Version: 3.1.3, Arivis AG, Munich, Germany) to visualise cell movement and rotation. Prior the use of Arivis Vision4D, the single z -stacks per time point were combined as hyper-stacks (Fiji/ImageJ). For the segmentation, image stacks were filtered with “Particle enhancement” (Diameter: 10, Lambda: 1). Single-cell nuclei were subsequently segmented with “Blob Finder” (Segment value: 500 μm, Threshold: 5, Watershed level: 1.303, NormalizePerFrame: true, SplitSensitivity: 82%) and tracked with “Segment Tracker” (Motion type: Brownian Motion (centroid), Max. distance: 5 μm, Track: Fusion: false – Divisoins: true, Weighting: Multiple). Fiji/ImageJ Organoid and nuclei sizes for the visual inspections part of the results were measured manually on maximum intensity z -projections of the acquired fluorescence image data using Fiji/ImageJ.
Mechanical 3D agent-based model
An individual cell-based model was implemented to explain the size oscillations of the pancreas-derived organoids. The mathematical model was given as a set of stochastic differential equations that were solved using the Euler-Maruyama method. To describe the pancreas-derived organoid, we assumed it has a roughly spherical shape, with cells forming a monolayer filled with fluid at a different pressure relative to the environment. The volume of the organoid is affected by two mechanisms: (a) the influx of liquid caused by an osmotic imbalance or active pumping of the cells, and (b) cell division. While (a) is increasing the internal pressure, (b) leads to a relaxation of the surface. Each cell was described by a small set of features, i.e. a position in 3D space and a cell size denoted by its radius. Displacement of the cells was described as a response to three forces: (1) external forces exerted by surrounding cells, given as a spring potential, (2) internal pressure of the organoid pushing the cells outwards, given by the ideal gas law, and (3) a surface bending energy, keeping the organoid in its spherical shape. Cell division was adjusted to match the experimental data, obtained by long-term single-cell analysis of pancreas-derived organoids, but can easily be adapted to other growth dynamics. If the average distance of neighbouring cells exceeds a certain limit, we assumed the mechanical stress to be too high and a leakage in the shell of the organoid emerges. Through the rupture, the internal liquid is released and the internal pressure decreases. Thus, the mechanical forces, exerted on the cells, might relax and the organoid deflates. When the average distances between all neighbouring cells fall below a given threshold, the shell closes and the liquid stops to be released. For the initial model setup, we utilised the cell count data retrieved from the light sheet pipeline. To reproduce the experimental observations from the bright-field analysis pipeline, we assumed simple cell proliferation dynamics. Due to the lack of exact cell proliferation dynamics from the bright-field pipeline, we estimated the initial cell number based on the projected area of the organoid and taking into account the light sheet microscopy data. The assumed cell proliferation dynamics are fitted to the linear increase in the projected area of the organoids, retrieved from the bright-field analysis.
Bright-field pipeline Specimen preparation
For the bright-field analysis, organoids were seeded in 25 μl ECM (Matrigel, Corning, New York) droplets in suspension culture plates (48-well, Greiner Bio-One, Kremsmünster, Austria), overlaid with 250 μl expansion medium and cultured for 12 h before imaging. They were then imaged every 30 min in a 3 × 3 tile imaging (15% overlap) mode using the Zeiss Cell Observer Z.1, fully equipped with an incubation chamber and motorised stage using a Plan-Apochromat × 5/0.16 objective, with a pixel size of 1.29 μm × 1.29 μm. In total, ten planes throughout the droplet were imaged, with a z -distance of 50 μm (mPOs) and 65 μm (hCCAOs), respectively, capturing a z -range of 450 to 585 μm.
Image processing and organoid segmentation
Organoid growth rates were determined using a python custom-made pipeline for bright-field-based image segmentation. The whole pipeline was equipped with a general user interface. The recorded time-lapse image stacks were pre-processed with Fiji (ImageJ version 1.51n, Java version 1.8.0_6 (64-bit)) by reducing the dimensionality of the raw data set from 9 (3 × 3) tiles with 10 z -planes each to one stitched image with one z -plane per time frame using the functions Average Intensity z -Projection, Subtract Background (Rolling ball radius: 700 pixels, Light background, Sliding paraboloid, Disable smoothing), and Grid/Collection stitching [ 61 ] (Type: Grid: row-by-row, Order: Right & Down). The resulting image stacks were further subjected to filtering (Median, Radius: 5 pixels) and background subtraction (Rolling ball radius: 500 pixels, Light background, Sliding paraboloid), and the projected luminal areas of the organoids were using the Fiji plugin Morphological Segmentation (MorphoLibJ [ 62 ] ➔ Segmentation ➔ Morphological Segmentation; Border Image, Tolerance: 10 (mPOs), 12 (hCCAOs), Calculate dams: true, Connectivity: 6). Subsequently, the segmented images were subjected to manual editing in which incompletely segmented organoids and organoids overlaying each other were excluded. Segmented luminal areas were measured with the Fiji plugin Region Morphometry (MorphoLibJ [ 62 ] ➔ Analyse ➔ Region Morphometry). The results were plotted and statistically evaluated (Kruskal-Wallis ANOVA, p < 0.05) using OriginPro 2019 or Excel. For a normalisation, the projected areas were normalised to the median of the fifth time point.
Mesoscopic feature extraction
Quantitative features were extracted using a Python script and were defined as follows: A size oscillation event consists of a decline phase followed by an expansion phase. The start of a decline phase was defined as the time point after which the area declines by 5%, and the end is marked if the area increases again. Expansion phases were defined between the end of a decline phase and the start of the following decline phase. As additional criterion, the duration of expansion phases is greater than or equal to five time points, and the correlation coefficient of the fitted polynomial is above 0.9. The number of decline and expansion phases per organoid was determined including their duration and slope. Subsequently, maximum and average expansion slopes were computed. The average expansion factor is specified as the average slope of all detected expansion phases per organoid. The maximum expansion factor is specified as the maximum slope of all detected expansion phases per organoid. Outliers in average expansion were defined as smaller than the first quartile minus 1.5 × IQR or above the third quartile plus 1.5 × IQR. The circularity was monitored continuously and is defined as 4π(area/perimeter 2 ). Its standard deviation is displayed as the average standard deviation in all analysed wells. Organoids displaying a circularity below 0.6 were considered as deficiently segmented and were excluded from further analyses. Due to deficient segmentation during organoid formation, the projected area was normalised to the fifth time point of acquisition.
Supplementary Information Additional file 1: Definitions. Definitions of the terminology used in this work and list of abbreviations. Additional file 2: Fig. S1. Light sheet and bright field time-resolved observation allow quantitative analyses of micro-, meso- and macroscale dynamics. Using a light sheet-based fluorescent microscope time-resolved image stack of organoids are recorded. The high-resolution images are subjected to nuclei segmentation [ 22 ] for the quantification of dynamics on single cell level (microscale). Besides that, dynamics, such as size oscillation events, of individual organoids (mesoscale) can be analysed. The restricted throughput of this pipeline is matched with the analyses based on time-resolved bright field images. Here, the dynamics of high numbers of organoids are quantified based on the normalised (norm.) projected (proj.) luminal areas. The pipeline also enables the observation of entire organoid cultures (macroscale) within individual wells. Additional file 3: Fig. S2. Ultra-thin FEP-foil cuvette holders for live recordings with the Zeiss Lightsheet Z.1 microscope system. (a) Illustration of the general setup of the Zeiss Lightsheet Z.1 microscope. (b) Close-up of the microscope chamber with the downwards directed Z1-FEP-cuvette enclosing the sample. (c) Close-up of the sample holder. The shrinking tube that seals the FEP cuvette and connects it with the glass capillary is depicted in black. (d) CAD-derived drawings of positive moulds of the FEP cuvette and the glass capillary needed to produce the Z1-FEP-cuvette. (e) Printed mould with a glass capillary used to form the Z1-FEP-cuvette in the vacuum forming process. (f) Ready-to-use Z1-FEP-cuvette. (g) mPOs grown for 7 days in the Z1-FEP-cuvette. Additional file 4: Fig. S3.
Validation of the temperature properties of the Zeiss Lightsheet
Z.1 microscope. (a) Illustration of the temperature distribution inside of the Zeiss Lightsheet Z.1 microscope chamber and the corresponding measurement landmarks. Beside the open, upper part with a slightly lower value, the temperature is equally distributed throughout the chamber. (b) Results of the measurement of the heating-up time. The included heating unit of the microscope needs to heat up the medium starting from room temperature (21 °C). After 12 min the medium reaches the physiological temperature of 37 °C. Additional file 5: Fig. S4.
Validation of the pH properties of the Zeiss Lightsheet
Z.1 microscope. (a) Illustration of the pH-value distribution inside the chamber of the Zeiss Lightsheet Z.1 microscope and the corresponding measurement landmarks. After filling the chamber with buffered media, the pH-value is evenly distributed at 7.5 throughout the chamber. (b) The constant CO 2 fumigation that is directed over the liquid column is not able to recover a lower pH-value over time. The pH-value of the medium changes from 8.5 to 8 but it never reaches the physiologically necessary 7.5 (liquid depth: 3 cm). The same is observed at 1 cm and 2 cm liquid depth. At the bottom of the chamber, the pH-value does not change within 48 h. (c) Once the inserted medium has the right pH-value, the incubation system is able to keep it on the same level for more than 2 days. Additional file 6: Fig. S5. Overview of entire hCCAO cultures within one Z1-FEP-cuvette and observation of isolated single-cell dynamics. hCCAOs expressed the nuclei marker H2B-eGFP (magenta) and the F-actin cytoskeletal marker LifeAct-mCherry (green). (a) Maximum intensity z-projection of the entire field of view in the Lightsheet Z1 microscope. One cuvette (i) with low organoid density and one cuvette (ii) with high organoid density are displayed. We counted about 120 organoids in the cuvette (ii) with high organoid density. Organoids show different sizes and isolated cell nuclei are visible in the interspaces. Scale bar: 250 μm. (b) Excerpts of the maximum intensity z-projections shown in (a). Isolated single organoid cells show signs of polarisation and undergo cell division. Scale bars: Cell division, Polarisation - 10 μm, Formation – 20 μm. Microscope: Zeiss Lightsheet Z.1; objective lenses: detection: W Plan-Apochromat 20x/1.0, illumination: Zeiss LSFM 10x/0.2; laser lines: 488 nm, 561 nm; filters: laser block filter (LBF) 405/488/561; voxel size: 1.02 × 1.02 × 2.00 μm 3 ; recording interval: 30 min. Additional file 7: Fig. S6. Representative overview images of three different mPO cultures grown in Z.1-FEP-cuvettes. (a) mPO grown within the Z.1-FEP-cuvette were kept in an incubator as a control for organoids grown within the Z.1 microscope. Images were taken directly after seeding, after 6 days and 10 days. (b) Two representative mPO cultures expressing the nuclei marker Rosa26-nTnG (grey) were imaged with the Zeiss Z.1 microscope over 6 days. Dependent on the number of views, tiles, z-planes and the temporal resolution, the amount of data which is generated and needs to be processed varies between hundreds of gigabyte and tens of terabyte (cuvette 1: total acquisition time: 6 days, temporal resolution: 30 min, views: 1, tiles: 1, total size: 220 GB; cuvette 2: total acquisition time: 6 days, temporal resolution: 30 min, views: 4 (only one is shown), tiles: 1, total size: 1054 GB). Microscope: (a) Zeiss Axio Imager, (b) Zeiss Lightsheet Z.1; objective lenses: (a) Plan S 1.0x FWD 81 mm, (b) detection: W Plan-Apochromat 20x/1.0, illumination: Zeiss LSFM 10x/0.2; laser lines: 561 nm; filters: laser block filter (LBF) 405/488/561; voxel size: 1.02 × 1.02 × 2.00 μm 3 , recording interval: 30 min; scale bar: 100 μm. Additional file 8: Fig. S7. Dynamic processes observed in organoid morphogenesis. hCCAOs expressed the nuclei marker H2B-eGFP (magenta) and the F-actin cytoskeletal marker LifeAct-mCherry (green) and were cultured in Z1-FEP-cuvettes for long-term live observation. The figure shows excerpts of maximum intensity z-projections. Manual tracking of cell nuclei was performed using the Manual Tracking plugin in Fiji . Microscope: Zeiss Lightsheet Z.1; objective lenses: detection: W Plan-Apochromat 20x/1.0, illumination: Zeiss LSFM 10x/0.2; laser lines: 488 nm, 561 nm; filters: laser block filter (LBF) 405/488/561; voxel size: 1.02 × 1.02 × 2.00 μm 3 ; recording interval: 30 min; scale bars: 50 μm, 25 μm (inset). Additional file 9: Fig. S8. Time-resolved, representative images of the growth and heterogeneity in mPOs. Illustrated are single organoids extracted from three different cultures showing rotation, size oscillation, luminal dynamics, fusion and different cell nucleus sizes. In addition, cell division events at a late stage (day 4, 5, 6) and the formation of differently sized organoid fragments are shown. Besides the luminal dynamics, which are imaged by the use of a bright field microscope, all behaviour patterns and appearances were observed from organoids expressing the nuclei marker Rosa26-nTnG (grey) and grown within the Z.1-FEP-cuvette inside the Z.1 Lightsheet microscope. The red rectangles indicate the corresponding close-up, the red arrows indicate the position within the organoid where the event occurs, the curved arrow indicate the direction of rotation and the red circle indicates the volume change during a size oscillation event. Microscope fluorescence images: Zeiss Lightsheet Z.1; Plan S 1.0x FWD 81 mm, detection: W Plan-Apochromat 20x/1.0, illumination: Zeiss LSFM 10x/0.2; laser lines: 561 nm; filters: laser block filter (LBF) 405/488/561; voxel size: 1.02 × 1.02 × 2.00 μm 3 ; recording interval: 30 min; Microscope bright field images: Zeiss Axio Observer Z.1; objective lenses: Plan-Apochromat 5x/0.16, voxel size: 1.26 × 1.26 × 4 μm3, avg. z-projection. Additional file 10: Fig. S9. Visualisation of segmentation performance in live mPOs expressing nuclear tdTomato. a) Maximum intensity z-projections of raw image stacks of three different mPOs. Image quality ensures a clear separation amongst the labelled nuclei, which is essential for semi-automated nuclei segmentation. Different colours indicate individual nuclei in overviews and close-ups of segmented nuclei. Microscope: Zeiss Lightsheet Z.1; objective lenses: detection: W Plan-Apochromat 20x/1.0, illumination: Zeiss LSFM 10x/0.2; laser lines: 561 nm; filters: laser block filter (LBF) 405/488/561; voxel size: 1.02 × 1.02 × 2.00 μm3; recording interval: 30 min, scale bar: 100 μm b) Evaluation of segmentation performance for different organoids. The performance was measured against a manually determined ground truth for the organoid I (red), II (blue) and III (green). The performance metrics recall, precision and F score are determined based on the number of true positives, false negatives and false positives (Supplementary Table 2). TP: true positives; FN: false negatives; FP: false negatives. Additional file 11: Fig. S10. Illustration of the input, the assumptions and the output of the model. Measured cell counts and cell division dynamics are used to initialise the simulations. Organoid behaviour is based on the following main assumptions [ 1 ]. Each cell produces a substance with constant rate Jin, the substance leads to increase of internal pressure [ 2 ]. Cell displacement is driven by mechanical cell-cell-interactions, internal pressure and a surface energy of the organoid [ 3 ]. If the organoid shell ruptures, substance is released to the outside with flux Jout, releasing pressure and leading to a contraction of the sphere until the cell-cell connections are restored. The output of the model is the volume data as a function of time of the simulated organoids. Additional file 12: Fig. S11. Analysis of simulated monocystic mPOs. Simulations starting with heterogenous initial cell numbers confirm an influence of organoid size onto the number of oscillation events. The colour code signals the number of registered size oscillation events. The amount of size oscillations is dependent on the initial size of the organoids. While small organoids tend to show frequent inflation-deflation oscillations, initially larger organoids seem less prone to oscillation events. Additional file 13: Fig. S12. mPO feature extraction using the bright field analysis pipeline. (a) The initial and final projected luminal areas correlate positively in healthy mPOs (R 2 -value = 0.7445). (b) The maximum slope of the expansion phases are in average higher than the average slope. (c) The minimum area falls in average slightly below the initial area. (d) Furthermore, the final area equals the maximum area, which indicates continuous growth – green: linear trend line, m: slope, red: f(x) = 1x. (e) Average circularity over time of organoids grown in three wells. Average standard deviation estimated within the three wells is indicated. Mathematically possible values range between 0 and 1. Additional file 14: Fig. S13. Bright field pipeline allows detailed analysis of polycystic hCCAOs. (a) Polycystic hCCAOs display a dense phenotype. Microscope: Zeiss Axio Observer Z.1; objective lenses: Plan-Apochromat 5x/0.16, avg. z-projection, voxel size: 1.29 × 1.29 × 65 μm 3 , scale bar overview: 500 μm, close-up: 25 μm. (b) The average circularity is around 0.8 over time. (c) Similarly to monocystic organoid cultures, the detected projected luminal areas and growth behaviours are heterogeneous. Box plot analysis, median in green ( n = 87) (d) While the median projected luminal areas of three different wells (technical replicates) vary, the normalised projected area increase is similar (n = 87, 34, 63). (e) The initial projected area correlates with the final projected area (R 2 = 0.8744) with a linear regression slope m = 1.5857. (f) The organoids display a similar average expansion factor independent of their initial size with an average of 0.02 and outliers (red) lying above 0.078. Additional file 23: Table S1. Used settings for the segmentation and post-processing of the data obtained with the light-sheet pipeline. Table S2 . Evaluation of segmentation performance for different organoids. The performance was measured against a manually determined ground truth for organoid I (red), II (blue) and III (green). The performance metrics recall, precision and F score are determined from the number of true positives, false negatives and false positives. Values range from 0 (worst performance) to 1 (optimal performance). GT: number of cell nuclei in the ground truth; SC: number of cell nuclei determined by segmentation; TP: true positives; FN: false negatives; FP: false negatives. Additional file 24: Supplementary Theoretical Considerations. A mechanical model to describe the dynamics of pancreas organoids.
📊 Figures
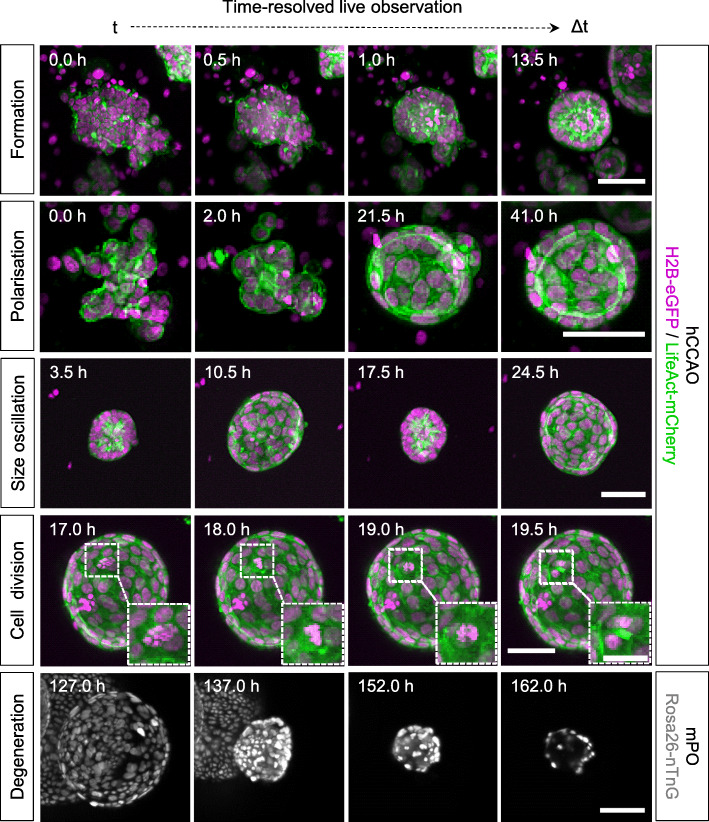
Fig. 1
Time-resolved live LSFM recordings for detailed qualitative inspections of dynamic morphological processes in organoid development. hCCAOs and mPOs were seeded into Z1-FEP-cuvettes for long-term live ...
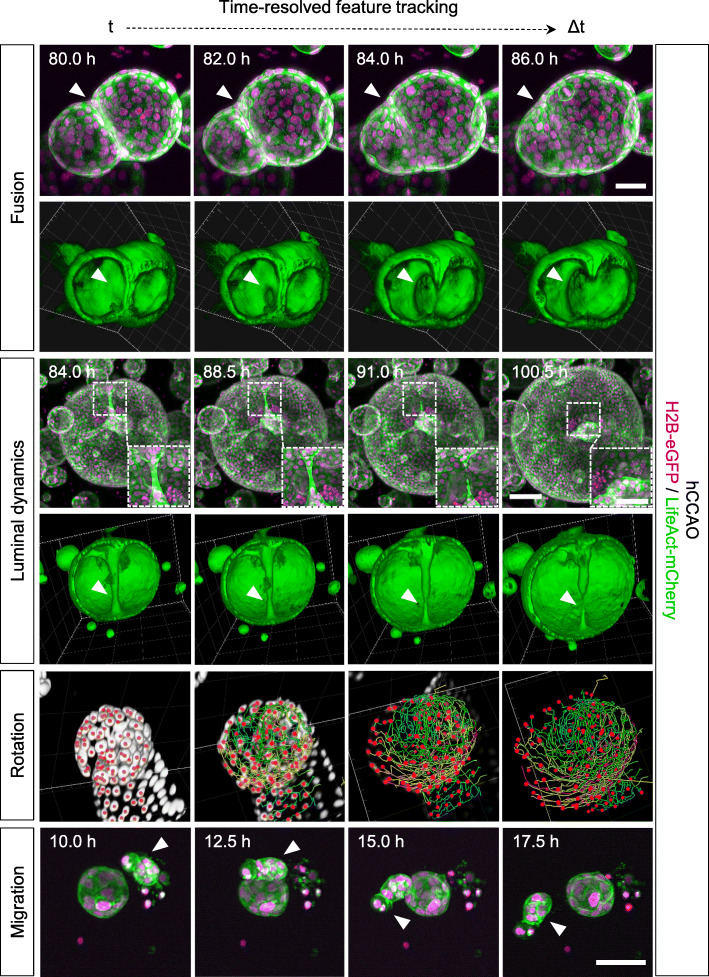
Fig. 2
High-quality live LSFM image data provide an excellent basis for volume rendering and detailed feature tracking. It can be used for the quantitative description of cellular dynamics in organoid develo...
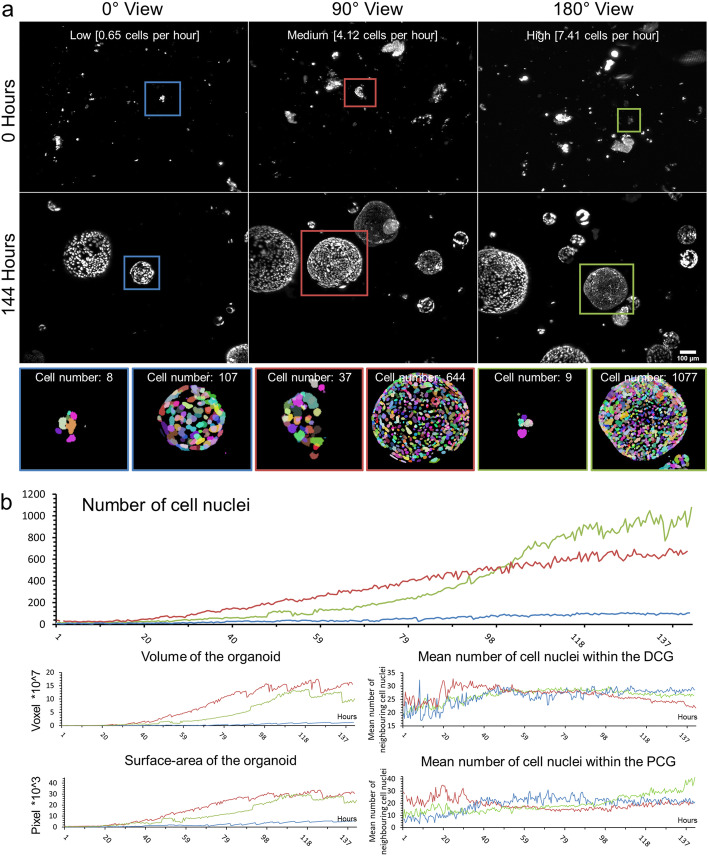
Fig. 3
Long-term single-cell analysis of mPOs reveals heterogeneity of proliferation potentials. mPOs (seeded and maintained in one Z1-FEP-cuvettes) expressed the nuclei marker Rosa26-nTnG (grey). Organoids ...
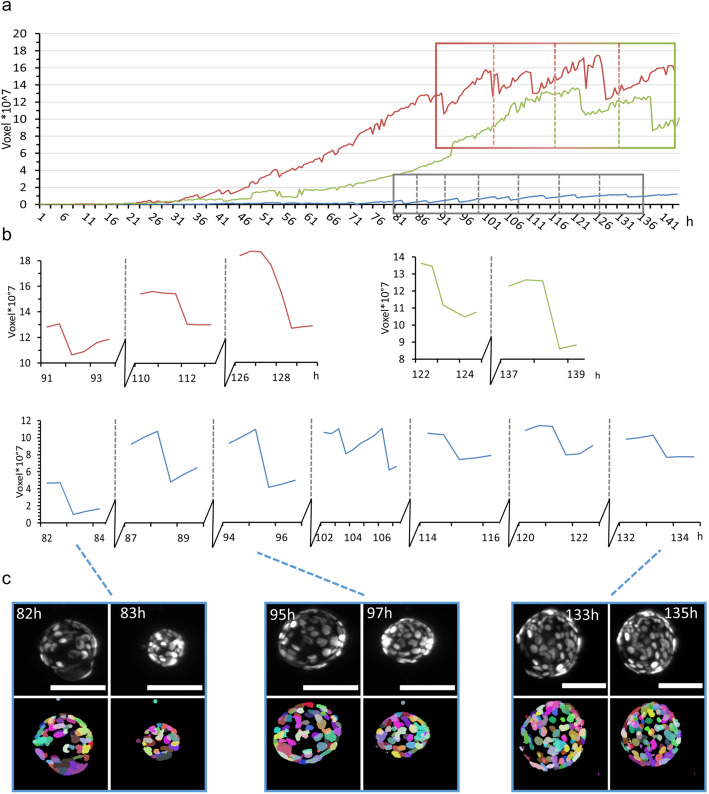
Fig. 4
Volume analysis of three representative mPOs reveals different oscillation frequencies . MPOs (seeded and maintained in one Z1-FEP-cuvettes) expressed the nuclei marker Rosa26-nTnG (grey). Organoids w...
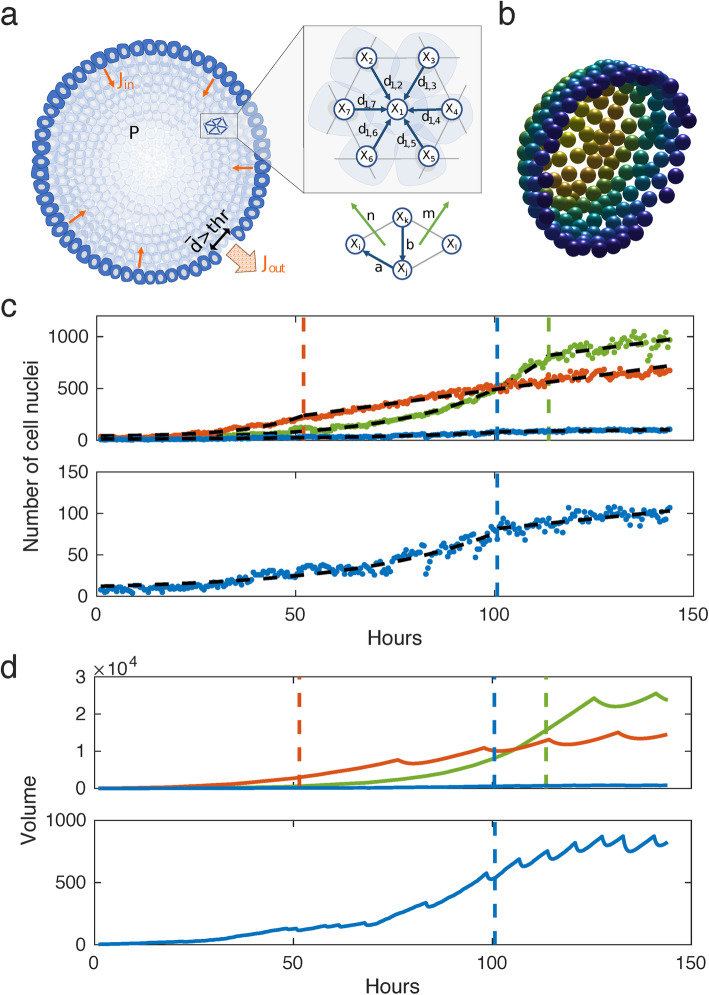
Fig. 5
Computational simulation of a multi-agent object. a Illustration of the general model. b Snapshot of a simulated sphere cut in half. c Piecewise exponential-linear fit (black dashed lines) to the grow...
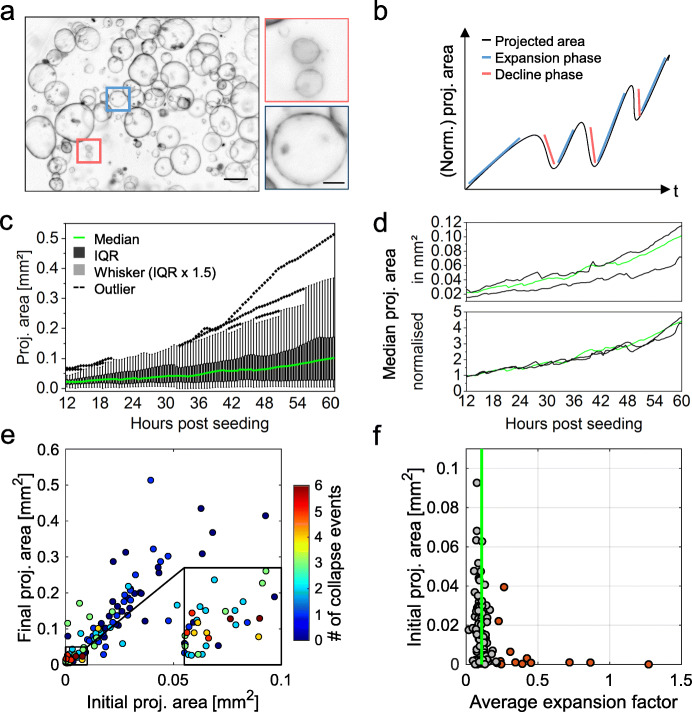
Fig. 6
Analysis of multiple monocystic mPOs reveals heterogeneity as well as core regulatory principles. a Overview bright-field images of mPOs displaying a monocystic phenotype. Microscope: Zeiss Axio Obser...
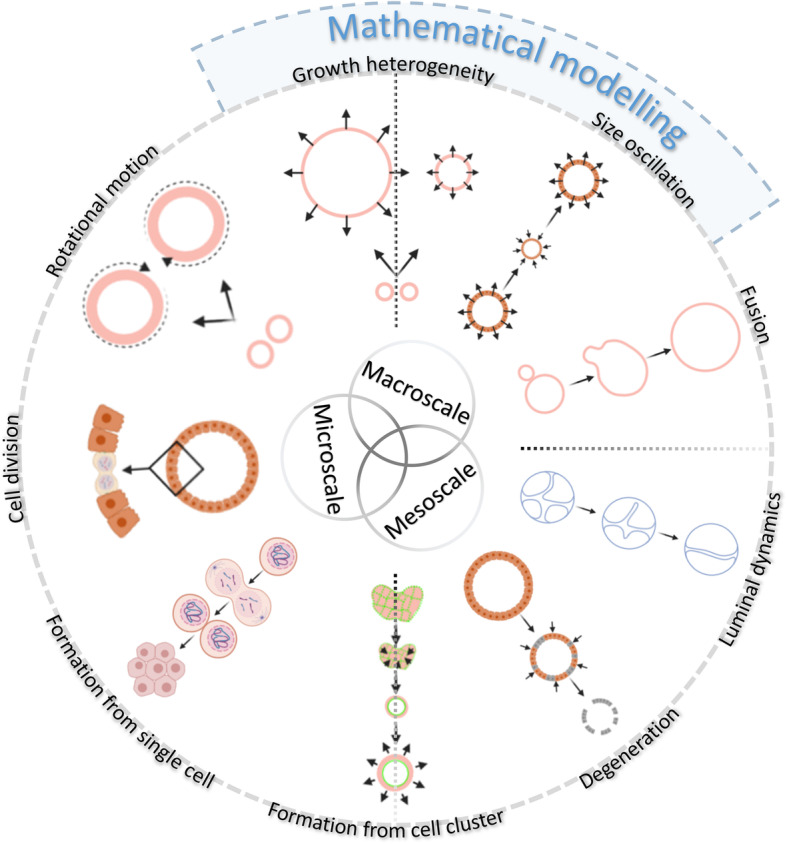
Fig. 7
The infographic shows an overview of all the observed organoid dynamics at multiple scales. The organoids display a wide range of motional and morphogenetic events, at single-cell (microscale), indivi...
Figure images are served from the NIH/NLM PubMed Central Open Access Subset or Europe PMC; copyright remains with the publishers and authors.
💬 Discussion
0 commentsNo comments yet. Be the first to start a discussion!
Leave a Comment