Abstract
During meiosis, repair of programmed DNA double-strand breaks (DSBs) by recombination promotes pairing of homologous chromosomes and their connection by crossovers. Two DNA strand-exchange proteins, Rad51 and Dmc1, are required for meiotic recombination in many organisms. Studies in budding yeast imply that Rad51 acts to regulate Dmc1's strand exchange activity, while its own exchange activity is inhibited. However, in a dmc1 mutant, elimination of inhibitory factor, Hed1, activates Rad51's strand exchange activity and results in high levels of recombination without participation of Dmc1. Here we show that Rad51-mediated meiotic recombination is not subject to regulatory processes associated with high-fidelity chromosome segregation. These include homolog bias, a process that directs strand exchange between homologs rather than sister chromatids. Furthermore, activation of Rad51 does not effectively substitute for Dmc1's chromosome pairing activity, nor does it ensure formation of the obligate crossovers required for accurate homolog segregation. We further show that Dmc1's dominance in promoting strand exchange between homologs involves repression of Rad51's strand-exchange activity. This function of Dmc1 is independent of Hed1, but requires the meiotic kinase, Mek1. Hed1 makes a relatively minor contribution to homolog bias, but nonetheless this is important for normal morphogenesis of synaptonemal complexes and efficient crossing-over especially when DSB numbers are decreased. Super-resolution microscopy shows that Dmc1 also acts to organize discrete complexes of a Mek1 partner protein, Red1, into clusters along lateral elements of synaptonemal complexes; this activity may also contribute to homolog bias. Finally, we show that when interhomolog bias is defective, recombination is buffered by two feedback processes, one that increases the fraction of events that yields crossovers, and a second that we propose involves additional DSB formation in response to defective homolog interactions. Thus, robust crossover homeostasis is conferred by integrated regulation at initiation, strand-exchange and maturation steps of meiotic recombination.
🔬 Techniques
🔭 Microscopes
🧬 Organisms
💻 Software
✨ Fluorophores
🧪 Sample Preparation
🏭 Microscope Brands
🧪 Reagent Suppliers
💻 Software Details
🏛️ Research Organizations (ROR)
Affiliated research institutions:
📋 Methods
Yeast strains
Strain information is listed in Supplemental Table S6 . All strains are derivative of strain SK-1. Meiotic time course Synchronous yeast cultures were induced to undergo meiosis by transfer to sporulation media as described previously [4] . Samples were taken over time to monitor the events of meiotic recombination and SC assembly. Meiotic progression was monitored by counting the number of DAPI staining bodies per cell for at least 100 cells per time point.
Tetrad analysis
Haploid strains were mated for 4–24 hrs on YPD plates and sporulated on plates containing 1% potassium acetate and 0.02% raffinose at 30°C for 2 days. Alternatively, asci were taken from meiotic time course after 48 hrs. Asci were digested with zymolyase and dissected on YPD plates supplemented with adenine, uracil, methionine, lysine, and threonine. Only tetrads producing four viable spores and showing Mendelian segregation of markers were used to calculate genetic map distance. Map distances were determined using the Perkins equation: (100(6NPD+TT))/(2(PD+NPD+TT)) [102] . Standard errors were calculated using Stahl Lab Online Tools ( http://www.molbio.uoregon.edu/~fstahl/ ). The NPD ratio for interference analysis is calculated as the fraction of NPDs observed/fraction of NPDs expected. NPD expected is calculated under the assumption where there is no interference using the Papazian equation: NPD expected = 0.5[(1-fT)−(1-(3fT/2)) 2/3 ], where fT denotes the observed frequency of tetratypes [77] .
Construction of a system to monitor JMs at a native
DSB hotspot The diploid strain used for JM analysis at ERG1 was engineered by a series of two-step gene replacements. On one copy of chromosome VII, SacII restriction sites were engineered into intragenic regions at Saccharomyces Genome Database (SGD) (S288c genome assembly) coordinate 844276 ( YGR173w ) and coordinate 854464 ( YGR179c ); and a Sal I site was engineered between ERG1 and YGR177c at coordinate 848724. For the Sac II site at coordinate 844276 the region between coordinates 843173 and 845291 was PCR amplified (5′ and 3′ primers contain Hind III restriction sites), digested with Hind III, and cloned into pRS306. The Sac II site was introduced by Quickchange Site-Directed Mutagenesis (Invitrogen) with the primers 5′-GTTGTTGCCACAGCAAGGACCGCGGATCTAGTATTAATGG and 5′-CCATTAATACTAGATCCGCGGTCCTTGCTGTGGCAACAAC (A→G). This plasmid was subsequently linearized using a unique Msc I restriction site. For the Sac II site at coordinate 854464, the region between coordinates 853473 and 855252 was PCR amplified (5′ and 3′ primers contain Hind III restriction sites), digested with Hind III, and cloned into pRS306. The Sac II site was introduced by site-directed mutagenesis with the primers 5′-GCTTTAATTCATAATTCCGCGGCAACCTTTCTCTATACTCAGC and 5′-GCTGAGTATAGAGAAAGGTTGCCGCGGAATTATGAATTAAAGC (G→C). This plasmid was linearized using a unique EcoN I restriction site. For the Sal I restriction site at coordinate 848724, the region between coordinates 847679 and 849776 was PCR amplified (5′ and 3′ primers contain Hind III restriction sites), digested with Hind III, and cloned into pRS306. The Sal I site was introduced by site-directed mutagenesis with the primers 5′-GCAGCCACGGCATGCGTCGACTACGAGCGTATTGTG and 5′-CACAATACGCTCGTAGTCGACGCATGCCGTGGCTGC (A→G). This plasmid was linearized using a unique Age I restriction site. On the other copy of chromosome VII, SacII restriction sites were engineered at SGD coordinate 845470 (intergenic) and coordinate 852145 ( YGR178c ) and a Spe I site was engineered between ERG1 and YGR177c at coordinate 848683. For the Sac II restriction site at coordinate 845470, the region between coordinates 844520 and 846322 was PCR amplified (5′ and 3′ primers contain Hind III restriction sites), digested with Hind III, and cloned into pRS306. The Sac II site was introduced by site-directed mutagenesis with the primers 5′-GGTTTAGATCCAAGATTCCGCGGTTCCACCATTTAATATG and 5′-CATATTAAATGGTGGAACCGCGGAATCTTGGATCTAAACC (C→G). This plasmid was linearized using a unique Nru I restriction site. For the Sac II restriction site at coordinate 852145, the region between coordinates 851037 and 853268 was PCR amplified (5′ and 3′ primers contain Sal I restriction sites), digested with Sal I, and cloned into pRS306. The Sac II site was introduced by site-directed mutagenesis with the primers 5′-CCTCTGGCGCACCTGCTGCCGCGGGAGTAGAGGTATCCG and 5′-CGGATACCTCTACTCCCGCGGCAGCAGGTGCGCCAGAGG (T→C). This plasmid was linearized using a unique Bgl II restriction site. For the Spe I restriction site at coordinate 848683, the region between coordinates 847679 and 849776 was PCR amplified (5′ and 3′ primers contain Hind III restriction sites), digested with Hind III, and cloned into pRS306. The Spe I site was introduced by site-directed mutagenesis with the primers 5′-CATGCGAGGTAAGACTAGTGTCTGAGACTTATACCCGACC and 5′-GGTCGGGTATAAGTCTCAGACACTAGTCTTACCTCGCATG (T→G). This plasmid was linearized using a unique Age I restriction site.
Show full methods section
Yeast strains
Strain information is listed in Supplemental Table S6 . All strains are derivative of strain SK-1. Meiotic time course Synchronous yeast cultures were induced to undergo meiosis by transfer to sporulation media as described previously [4] . Samples were taken over time to monitor the events of meiotic recombination and SC assembly. Meiotic progression was monitored by counting the number of DAPI staining bodies per cell for at least 100 cells per time point.
Tetrad analysis
Haploid strains were mated for 4–24 hrs on YPD plates and sporulated on plates containing 1% potassium acetate and 0.02% raffinose at 30°C for 2 days. Alternatively, asci were taken from meiotic time course after 48 hrs. Asci were digested with zymolyase and dissected on YPD plates supplemented with adenine, uracil, methionine, lysine, and threonine. Only tetrads producing four viable spores and showing Mendelian segregation of markers were used to calculate genetic map distance. Map distances were determined using the Perkins equation: (100(6NPD+TT))/(2(PD+NPD+TT)) [102] . Standard errors were calculated using Stahl Lab Online Tools ( http://www.molbio.uoregon.edu/~fstahl/ ). The NPD ratio for interference analysis is calculated as the fraction of NPDs observed/fraction of NPDs expected. NPD expected is calculated under the assumption where there is no interference using the Papazian equation: NPD expected = 0.5[(1-fT)−(1-(3fT/2)) 2/3 ], where fT denotes the observed frequency of tetratypes [77] .
Construction of a system to monitor JMs at a native
DSB hotspot The diploid strain used for JM analysis at ERG1 was engineered by a series of two-step gene replacements. On one copy of chromosome VII, SacII restriction sites were engineered into intragenic regions at Saccharomyces Genome Database (SGD) (S288c genome assembly) coordinate 844276 ( YGR173w ) and coordinate 854464 ( YGR179c ); and a Sal I site was engineered between ERG1 and YGR177c at coordinate 848724. For the Sac II site at coordinate 844276 the region between coordinates 843173 and 845291 was PCR amplified (5′ and 3′ primers contain Hind III restriction sites), digested with Hind III, and cloned into pRS306. The Sac II site was introduced by Quickchange Site-Directed Mutagenesis (Invitrogen) with the primers 5′-GTTGTTGCCACAGCAAGGACCGCGGATCTAGTATTAATGG and 5′-CCATTAATACTAGATCCGCGGTCCTTGCTGTGGCAACAAC (A→G). This plasmid was subsequently linearized using a unique Msc I restriction site. For the Sac II site at coordinate 854464, the region between coordinates 853473 and 855252 was PCR amplified (5′ and 3′ primers contain Hind III restriction sites), digested with Hind III, and cloned into pRS306. The Sac II site was introduced by site-directed mutagenesis with the primers 5′-GCTTTAATTCATAATTCCGCGGCAACCTTTCTCTATACTCAGC and 5′-GCTGAGTATAGAGAAAGGTTGCCGCGGAATTATGAATTAAAGC (G→C). This plasmid was linearized using a unique EcoN I restriction site. For the Sal I restriction site at coordinate 848724, the region between coordinates 847679 and 849776 was PCR amplified (5′ and 3′ primers contain Hind III restriction sites), digested with Hind III, and cloned into pRS306. The Sal I site was introduced by site-directed mutagenesis with the primers 5′-GCAGCCACGGCATGCGTCGACTACGAGCGTATTGTG and 5′-CACAATACGCTCGTAGTCGACGCATGCCGTGGCTGC (A→G). This plasmid was linearized using a unique Age I restriction site. On the other copy of chromosome VII, SacII restriction sites were engineered at SGD coordinate 845470 (intergenic) and coordinate 852145 ( YGR178c ) and a Spe I site was engineered between ERG1 and YGR177c at coordinate 848683. For the Sac II restriction site at coordinate 845470, the region between coordinates 844520 and 846322 was PCR amplified (5′ and 3′ primers contain Hind III restriction sites), digested with Hind III, and cloned into pRS306. The Sac II site was introduced by site-directed mutagenesis with the primers 5′-GGTTTAGATCCAAGATTCCGCGGTTCCACCATTTAATATG and 5′-CATATTAAATGGTGGAACCGCGGAATCTTGGATCTAAACC (C→G). This plasmid was linearized using a unique Nru I restriction site. For the Sac II restriction site at coordinate 852145, the region between coordinates 851037 and 853268 was PCR amplified (5′ and 3′ primers contain Sal I restriction sites), digested with Sal I, and cloned into pRS306. The Sac II site was introduced by site-directed mutagenesis with the primers 5′-CCTCTGGCGCACCTGCTGCCGCGGGAGTAGAGGTATCCG and 5′-CGGATACCTCTACTCCCGCGGCAGCAGGTGCGCCAGAGG (T→C). This plasmid was linearized using a unique Bgl II restriction site. For the Spe I restriction site at coordinate 848683, the region between coordinates 847679 and 849776 was PCR amplified (5′ and 3′ primers contain Hind III restriction sites), digested with Hind III, and cloned into pRS306. The Spe I site was introduced by site-directed mutagenesis with the primers 5′-CATGCGAGGTAAGACTAGTGTCTGAGACTTATACCCGACC and 5′-GGTCGGGTATAAGTCTCAGACACTAGTCTTACCTCGCATG (T→G). This plasmid was linearized using a unique Age I restriction site.
DNA physical assays
Recombination events at HIS4::LEU2 and ERG1 loci were similarly monitored by gel electrophoresis. The HIS4::LEU2 assay system contains XhoI restriction site polymorphisms between parental homologs producing fragments diagnostic for parental and recombinant chromosomes. A BamHI/NgoMIV polymorphism immediately at the DSB site allows detection of non-crossover products. Non-crossovers were analyzed by double digestion of genomic DNA with XhoI and NgoMIV and separation on one-dimensional gels. The ERG1 locus contains Sac II restriction site polymorphisms that produce fragments diagnostic for JMs and recombinant products. To analyze relative amounts of crossover and non-crossover products at ERG1 , genomic DNA was doubly digested with Sac II and Sal I and analyzed by one-dimensional gel and Southern hybridization. The polymorphic Sal I site located at the DSB site is diagnostic for non-crossover products. Samples were treated with psoralen and UV to crosslink DNA and stabilize JM intermediates using previously described methods [36] , [54] , [103] . DNA extraction and Southern blot analysis were carried out using methods that have been described in detail previously [100] .
Yeast cytology and chromosome spreads for immunofluorescence
Yeast cells were fixed and spread as described previously [4] , [103] . For STED microscopy ProLong Gold (Invitrogen Molecular Probes, catalog # P36930 ) was used as an anti-fade reagent instead of vectashield. Spreads were stained with primary antibodies followed by incubation with fluorochrome-conjugated secondary antibodies (Invitrogen Molecular Probes, 1∶1000 dilution). Images were acquired using Zeiss Axiovision 4.6 at 100×magnification. For STED microscopy images were acquired using a Leica SP5 II STED-CW at 100×magnification. Images were adjusted for brightness and contrast using NIH ImageJ. NIH ImageJ was utilized to measure intensities of staining structures. The rabbit anti-Ctf19 antibody was a gift from Phil Heiter and was used following 1 to 1000 dilution. The rabbit anti-Zip3 and rabbit anti-Rec8 antibodies were gifts from Akira Shinohara and were both used diluted 1∶500. The rabbit anti-Red1 antibody used was a gift from Shirleen Roeder and was used at a 1∶500 dilution. The Goat anti-Zip1 antibody is commercially available via Santa Cruz (catalog # sc-15632). Random spore analysis to test crossover homeostasis Random spore analysis was performed as described [18] . Briefly, strains were induced to undergo sporulation, harvested, and asci were digested with zymolyase, diluted in 0.1% Tween-20, sonicated to produce single spores, and plated onto solid media lacking arginine. ARG+ colonies were then tested for growth on plates lacking uracil and threonine.
Visualization of the SC via electron microscopy
Nuclei were first fixed and spread followed by silver staining to visualize the synaptonemal complex [104] , [105] . To prepare spheroplasts, 10 ml of meiotic culture was collected and spun for 2.5 min at 1,600 rpm, the pellet was resuspended in 2 ml of ZK buffer (25 mM Tris pH 7.5, 0.8 M KCl), and 40 µl of 1 M DTT was added. After a 2 min incubation at room temperature, cells were spun for 2.5 min at 1,600 rpm, the pellet was then resuspended in 2 ml ZK buffer, 15 µl zymolyase solution (50 mM Tris pH 7.5, 2% glucose, 20 mg/ml zymolyase) was added, and cells were incubated for 20 min with gentle rotation at 30°C. Cells were then spun for 2.5 min at 1,300 rpm, washed in 5 ml MES (1 M sorbitol, 0.1 M MES pH 6.5, 1 mM EDTA, 0.5 mM MgCl 2 ), and pelleted as before. Next, cells were resuspended in 1 ml MES and spun for 1 min at 200 rpm, followed by aspiration of the supernatant. To release nuclei from the spheroplasts, 5 µl of the pellet was placed into 50 µl MEM/protease inhibitor (0.1 M MES pH 6.8, 1 mM EDTA, 0.5 mM MgCl 2 ) with freshly added 0.1 M PMSF (10 µl of PMSF stock to 1 ml MEM), then gently resuspended by pipetting. To fix the released nuclei, 50 µl of PFA was added and mixed well. 50 µl of the final mixture was spread across microscope slide precoated with polystyrene plastic and incubated at room temperature in a humid chamber. After 5 min, an additional 400 µl of PFA was pipetted onto the slide. After 5 min more, preparations were rinsed with 4 ml of 0.4% Photoflo (Kodak) and allowed to dry completely before proceeding to silver staining. Silver staining 200 µl of colloidal developer and 200 µl silver nitrate were mixed on a 24×50 coverslip and the mixture was put on top of a slide that had fixed nuclei. The preparation was placed on a 60°C hotplate for 2–5 min, then gently rinsed with water to remove the coverslip and stop the reaction. Once dry the polystyrene membrane was floated off on a water surface and clean EM grids were placed on the membrane. The membrane and grids were removed from H 2 O and allowed to dry. Images were taken at 3,500×magnification using a Hitachi H-7600 electron microscope housed in the Oklahoma Medical Research Foundation Core Facility for Imaging.
Supporting Information Figure S1 Independent analysis of JM formation and crossing-over in hed1, dmc1 , and dmc1 hed1 strains. A. Representative Southern images of JMs resolved by 2D gels. B. Timing and efficiency of meiotic divisions. C. Quantification of JMs over time. D. IH/IS dHJ ratios over time. E. Images of 1D Southern analysis of crossing-over at the HIS4::LEU2 locus. F. Quantification of final crossover levels at the HIS4::LEU2 . Averages of four independent time courses are shown. Error bars show standard error. (TIFF) Click here for additional data file. Figure S2 Analysis of JMs in the ndt80 background. A. 2D Southern images showing accumulated JMs in ndt80, hed1 ndt80 and dmc1 hed1 ndt80 strains. B. IH/IS dHJ ratios at 7 and 8 hrs after induction of meiosis. C.
Quantification of various
JM species in ndt80 strains. *Note that the SEI-like species are distinct from the SEIs that form at early times, which form more discrete signals and have a defined strand composition [52] . However, the exact nature of these structures and their fate remain unclear. (TIFF) Click here for additional data file. Figure S3 rad51 is epistatic to hed1 . A. Representative Southern images showing 1D gel analysis of crossing over at HIS4::LEU2 in rad51 and rad51 hed1 time course experiments. B. Quantitation of crossovers at 12 and 24 hours in rad51 and rad51 hed1 cells. Each strain was analyzed in triplicate. C. Representative Southern images of 2D gels showing JM analysis at HIS4::LEU2 in wild-type, rad51 and rad51 hed1 strains. Lower panels show blowups of the JM regions. D. Quantification of IH-dHJs and IS-dHJs at HIS4::LEU2 in wild-type, rad51 and rad51 hed1 strains. E. Southern images showing 1D gel analysis of DSB formation and crossing over at HIS4::LEU2 in wild-type, dmc1 rad51 and dmc1 rad51 hed1 time course experiments. F. Quantification of the Southerns shown in E. The apparent reduction of DSB signals at late times in dmc1 rad51 and dmc1 rad51 hed1 strains results from excessive resection of DSBs past the diagnostic Xho I restriction site. Residual crossover products detected in rad51 dmc1 double mutants (∼10–25% of normal crossover levels) have been noted previously [47] , [81] . It is unclear whether these products represent bond fide reciprocal crossovers. The aberrant pathway responsible for these products has not been defined, but JMs are not detected in the rad51 dmc1 double mutant [32] , [106] . (TIFF) Click here for additional data file. Figure S4 JM analysis in mek1-as strains. A. Representative Southern images of 2D gels showing JM analysis at HIS4::LEU2 in wild-type, mek1-as , hed1 , and mek1-as hed1 cells. Lower panels show blowups of the JM regions. B. Timing and efficiency of meiotic divisions in wild-type, hed1 , mek1-as , and mek1-as hed1 cells. C. Quantification of IH-dHJs, IS-dHJs and the IH/IS dHJ ratio in wild-type, mek1-as , hed1 , and mek1-as hed1 cells. (TIFF) Click here for additional data file. Figure S5 Additional images of Red1 immunostaining analyzed by STED microscopy. Red1 (red) is imaged via STED and Zip1 by confocal microscopy. (TIFF) Click here for additional data file. Figure S6 Immunostaining and EM analysis of spread meiotic nuclei shows that elongated Zip1 structures formed in the dmc1 hed1 mutant are SCs. A. Representative immunostained nuclei showing Zip1 (green), Zip3 (red) and merged channels. Note that Zip3 foci colocalize with elongated ZIp1 structures. B. Average numbers of Zip3 foci per nucleus for wild-type, hed1 , dmc1 hed1 , and dmc1 cells. At lest 50 nuclei were analyzed for each strain. C. Electron micrographs of SCs stained with silver. Both wild-type nuclei and one of the dmc1 hed1 nuclei have fully formed tripratite SCs.The hed1 dmc1 nucleus to the left displays regions of tripartite SC as well as unsynapsed regions. (TIFF) Click here for additional data file. Figure S7 Analysis of crossover interference along chromosome III with and without non-exchange tetrads. A. NPD ratios. In the graph on the left, NPD ratio were calculated for the dmc1 hed1 dataset that included non-exchange tetrads. In the graph on the right, non-exchange tetrads were excluded from the dmc1 hed1 dataset. The asterisks indicate intervals in dmc1 hed1 dataset that show a significant change from wild type. B. Analysis of interference using the “adjacent intervals” approach of Malkova et al. [76] . Ratios of map distances Adj CO /Adj PD for wild-type, hed1 , and dmc1 hed1 are shown. The reported ratios are averages of the two ratios for each interval pair. Solid lines represent significant interference and dashed lines represent non-significant deviations from a ratio of one. The panels on the left shows the analysis for dmc1 hed1 with non-exchange tetrads included and the panel on the right shows the analysis for dmc1 hed1 with non-exchange tetrads excluded. The asterisks indicate intervals with a significant change from wild type. (TIFF) Click here for additional data file. Figure S8 Analysis of crossover interference for distant intervals. Analysis of interference between distant intervals using the nearest neighbor approach of Malkova et al. (2004). Ratios of map distances Adj CO /Adj PD for wild type, dmc1 hed1 including non-exchange tetrads, and dmc1 hed1 excluding non-exchange tetrad. The number is the average of the two Adj CO /Adj PD ratios obtained by taking each interval as reference. Solid lines represent significant interference and dotted lines represent non-significant interference. dmc1 hed1 shows significant negative interference when non-exchange tetrads are included in the analysis. (TIFF) Click here for additional data file. Table S1 Quantitation of Red1, Zip1, and Zip3 localization. (PDF) Click here for additional data file. Table S2 Quantitation and comparison of Red1 staining by STED microscopy. (PDF) Click here for additional data file. Table S3 Analysis of crossover interference using non-parental ditype ratios. (PDF) Click here for additional data file. Table S4 Analysis of crossover interference using adjacent intervals. (PDF) Click here for additional data file. Table S5 Analysis of crossover interference for distant intervals. (PDF) Click here for additional data file. Table S6 Yeast strains used in this study. (PDF) Click here for additional data file. Text S1 Supplementary discussion. (PDF) Click here for additional data file.
📊 Figures
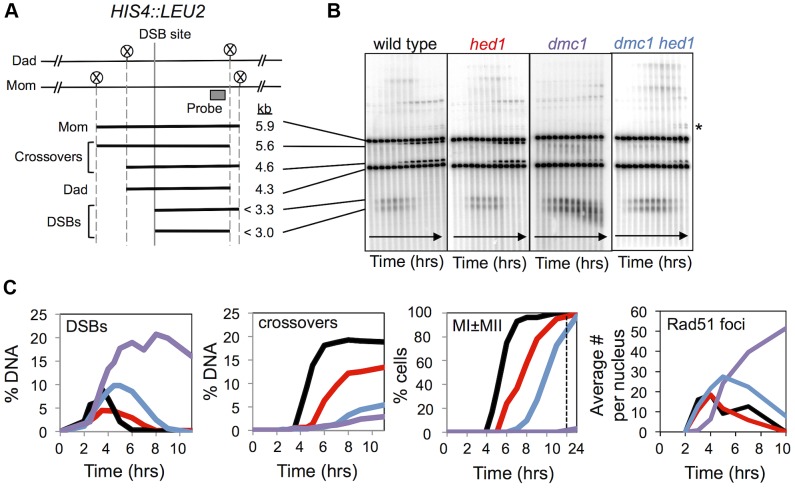
Figure 1
Analysis of DSBs and crossovers in hed1 and dmc1 hed1 mutants.
A. Map of the HIS4::LEU2 hotspot showing the DSB site, Xho I restriction sites (circled Xs) and the position of the probe used in Southern analysis. Sizes of diagnostic fragments are shown below. B. 1...
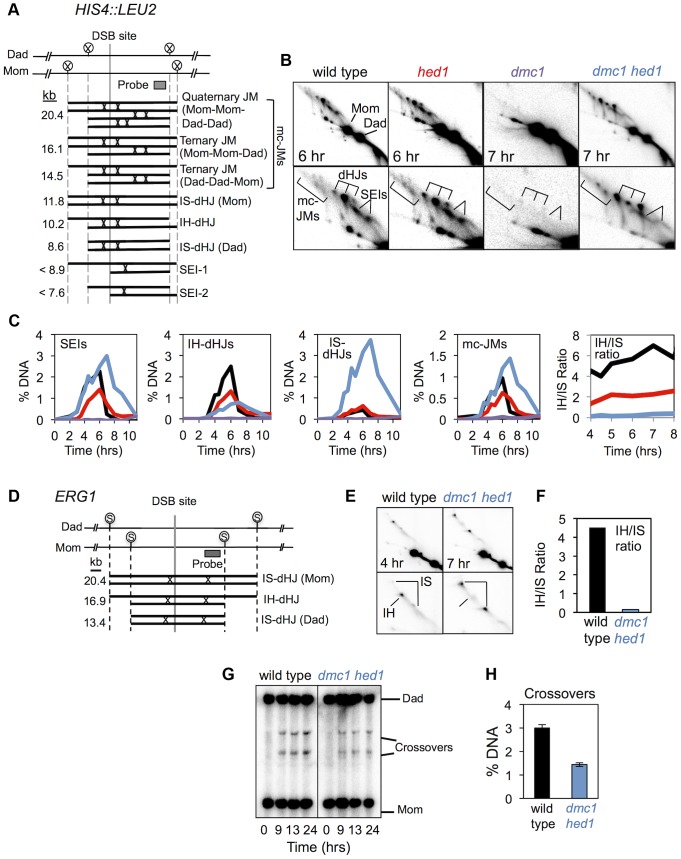
Figure 2
hed1 and dmc1 hed1 mutants are defective for interhomolog bias at two recombination hotspots.
A. Diagram of JM structures detected at the HIS4::LEU2 hotspot, from lowest to highest mobility. Positions of diagnostic Xho I sites (circled Xs) and the Southern probe are also highlighted. B. Images...
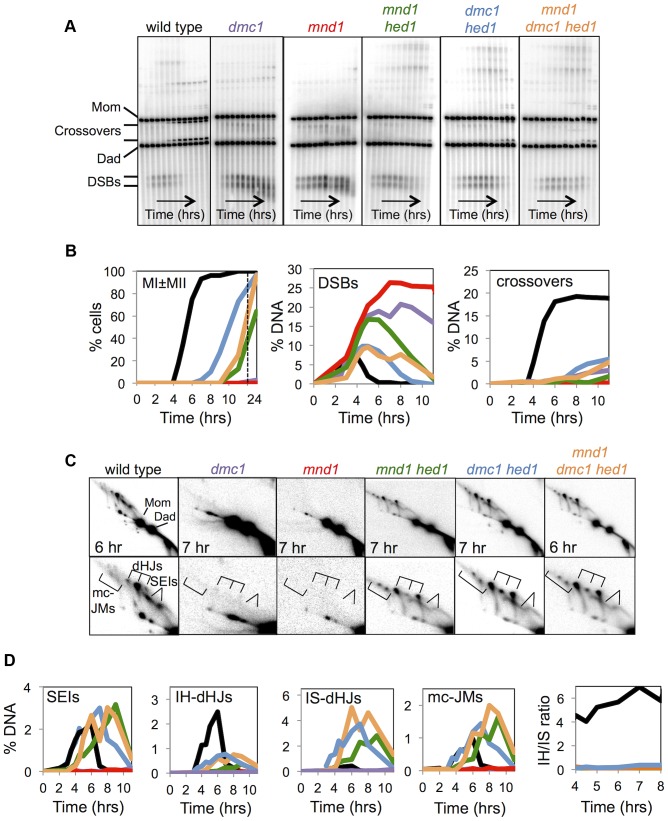
Figure 3
Mnd1 promotes Dmc1-dependent interhomolog recombination and Dmc1 inhibits Rad51-mediated recombination.
A. Images of 1D Southern analysis at HIS4::LEU2 for wild-type, dmc1 , mnd1 , mnd1 hed1 , dmc1 hed1 , and mnd1 dmc1 hed1 time-course experiments. B. Quantification of the first meiotic division (MIu00b...
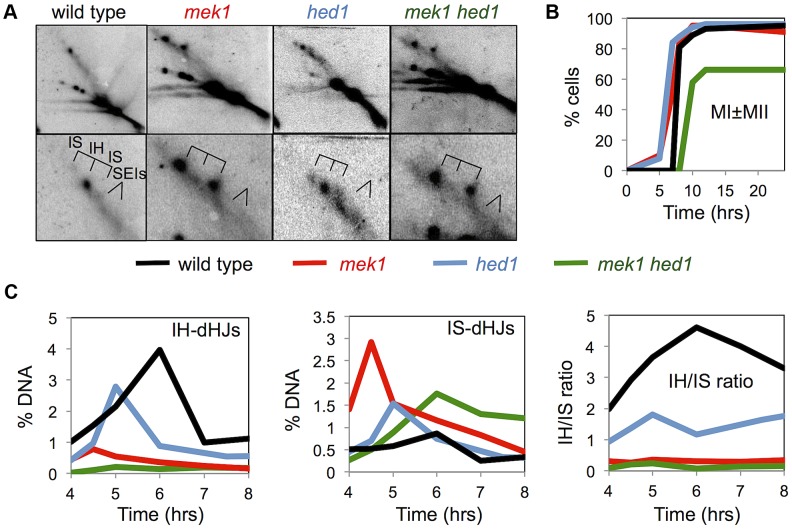
Figure 4
Mek1 and Hed1 make independent contributions to interhomolog template bias.
A. Images of representative panels from 2D Southern analysis, with corresponding enlargements of the JM regions. B. Analysis of the first meiotic division in the indicated strains. C. Quantification o...
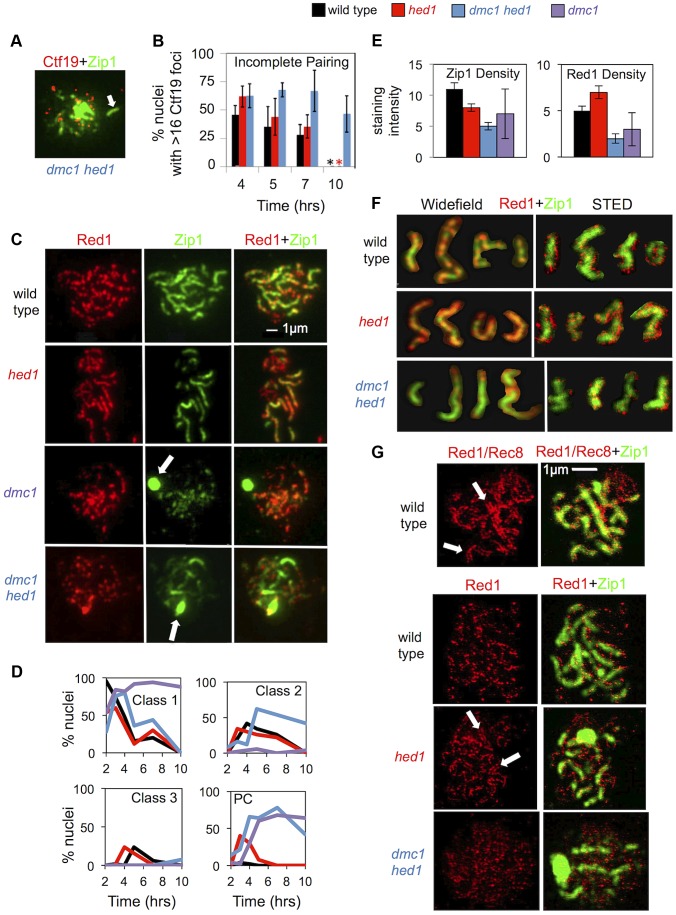
Figure 5
Synaptonemal complex formation is defective in hed1 and dmc1 hed1 strains.
A. Representative image of a spread meiotic nucleus from the dmc1 hed1 strain showing greater than 16 Ctf19 foci: immunostain for Zip1 is shown in green, Ctf19 stain is shown in red. Colocalization of...
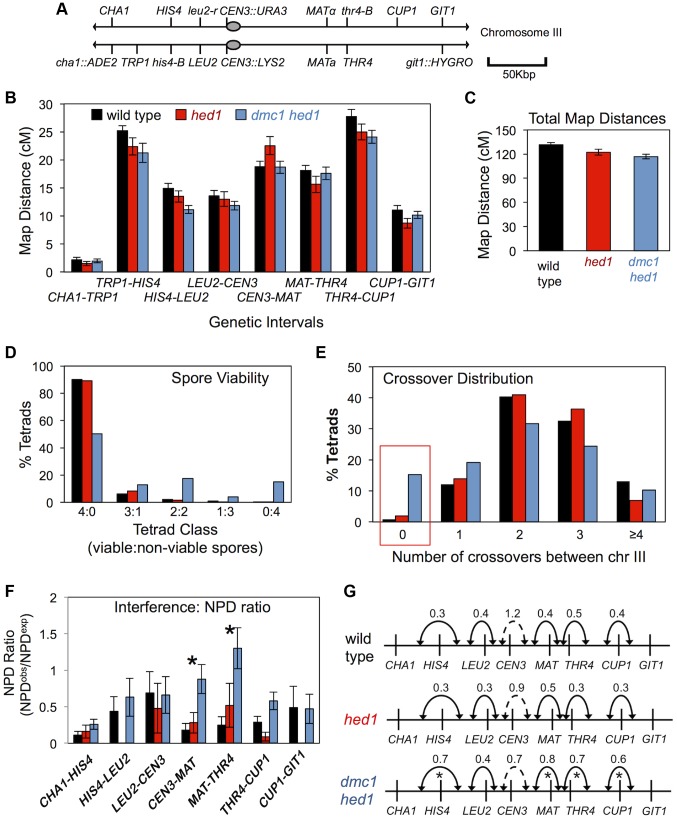
Figure 6
Analysis of crossing-over in hed1 and dmc1 hed1 mutants.
A. Map of marker configurations along chromosome III. Note that this strain does not carry the artificial HIS4::LEU2 hotspot. B. Map distances for 8 genetic intervals along chromosome III. Map distanc...
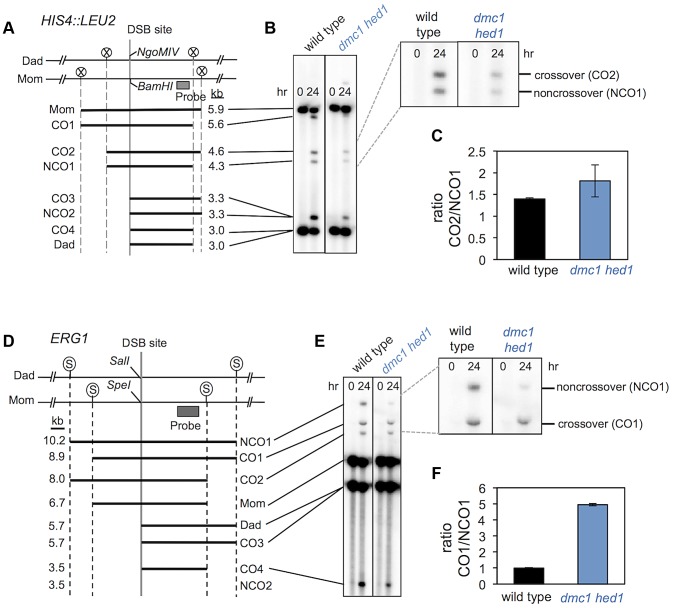
Figure 7
dmc1 hed1 strains have elevated crossover/non-crossover ratios at two recombination hotspots.
A. Map of the HIS4::LEU2 DSB site showing diagnostic restriction site heterologies. Positions of Xho I (circled Xs), Bam HI and Ngo MIV sites are indicated. B. 1D Southern analysis of Xho I+ Ngo MIV d...
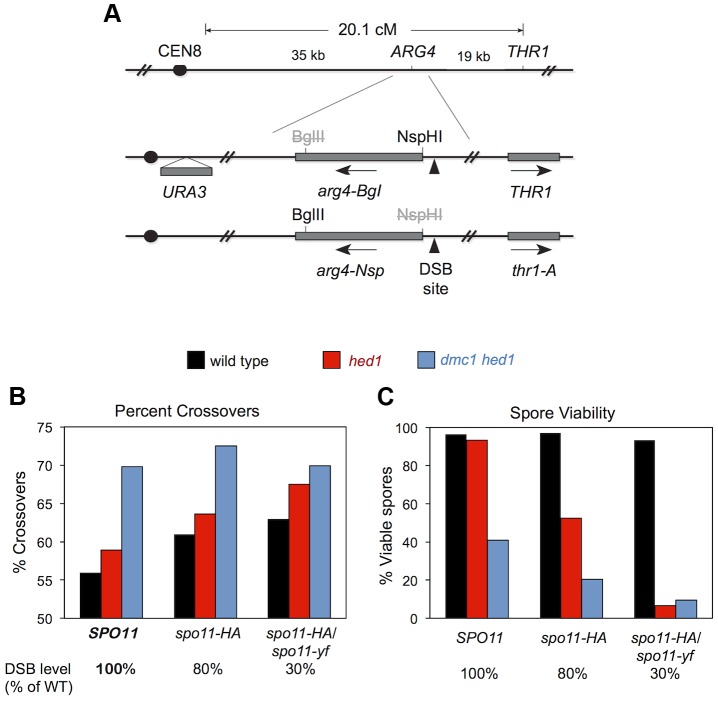
Figure 8
Crossover/noncrossover ratios at ARG4 measured by random spore analysis.
A. Map of the ARG4 region (top) and heterozygous markers used to select ARG4 + gene conversions and determine whether they are associated with crossing over (bottom). B. Percent of ARG4 gene conversio...
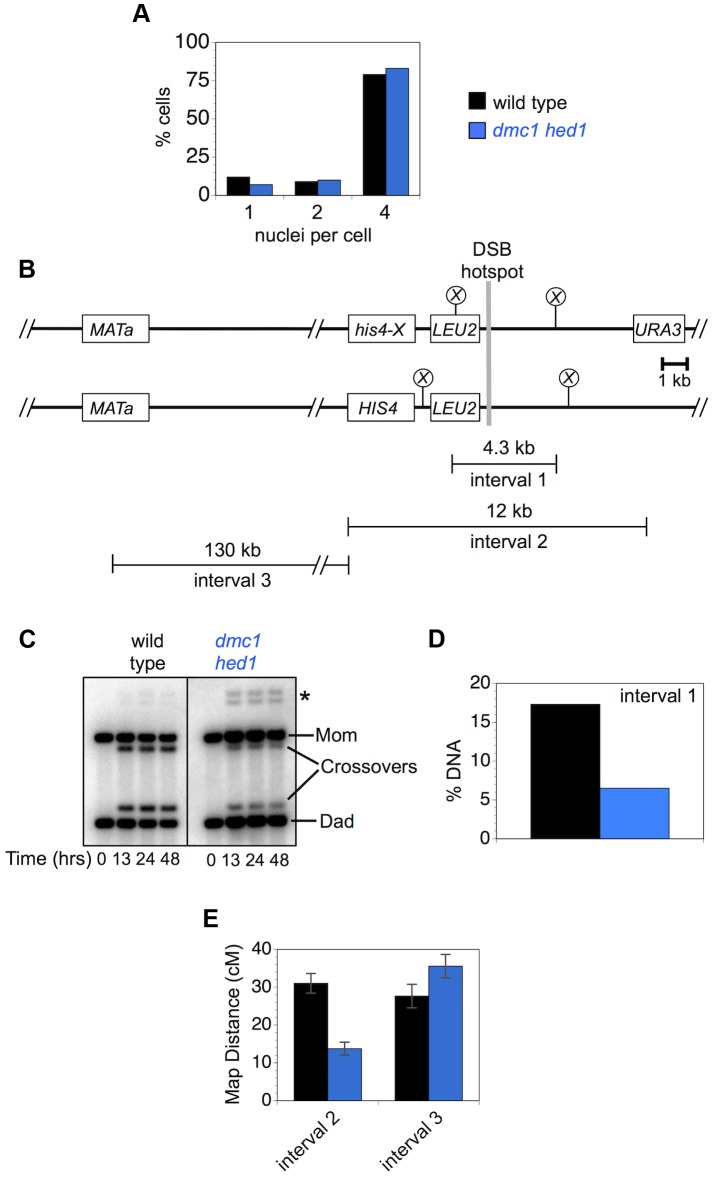
Figure 9
Crossover homeostasis as a function of interval size.
A. Efficiency of meiotic divisions in parallel cultures of wild-type and dmc1 hed1 cells. B. Physical map of HIS4::LEU2 and adjacent regions of chromosome III showing intervals monitored for crossing-...
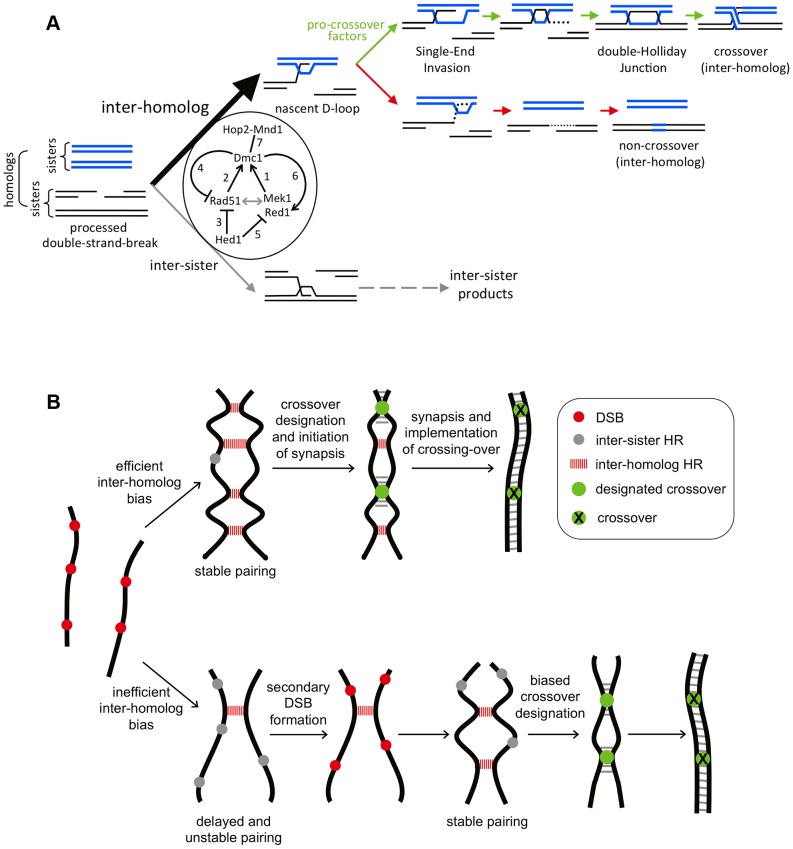
Figure 10
Models for Rad51-Dmc1 mediated interhomolog bias and homeostatic responses to inefficient interhomolog interactions.
A. Rad51-Dmc1 dependent interhomolog recombination during meiosis. DNA intermediates leading to interhomolog or intersister recombination are shown. Intersister strand-exchange is presumed to produce ...
Figure images are served from the NIH/NLM PubMed Central Open Access Subset or Europe PMC; copyright remains with the publishers and authors.
💬 Discussion
0 commentsNo comments yet. Be the first to start a discussion!
Leave a Comment