Abstract
Abstract We introduce MINSTED, a fluorophore localization and super-resolution microscopy concept based on stimulated emission depletion (STED) that provides spatial precision and resolution down to the molecular scale. In MINSTED, the intensity minimum of the STED doughnut, and hence the point of minimal STED, serves as a movable reference coordinate for fluorophore localization. As the STED rate, the background and the required number of fluorescence detections are low compared with most other STED microscopy and localization methods, MINSTED entails substantially less fluorophore bleaching. In our implementation, 200–1,000 detections per fluorophore provide a localization precision of 1–3 nm in standard deviation, which in conjunction with independent single fluorophore switching translates to a ~100-fold improvement in far-field microscopy resolution over the diffraction limit. The performance of MINSTED nanoscopy is demonstrated by imaging the distribution of Mic60 proteins in the mitochondrial inner membrane of human cells.
🔬 Techniques
💻 Software
✨ Fluorophores
🧪 Sample Preparation
🔬 Cell Lines
🏭 Microscope Brands
🧪 Reagent Suppliers
📷 Detectors
💻 Software Details
💾 Data Repositories
🏛️ Research Organizations (ROR)
Affiliated research institutions:
📋 Methods
Experimental MINSTED localization precision
To test these predictions, we localized immobilized individual Atto 647N fluorophores on coverslips 12 using MINSTED with d min ≈ 40 nm. Driven by each detection i , the scan centre progressed toward the fluorophore and ultimately meandered around the estimated final coordinate ( Fig. 3a,b and Supplementary Video 2 ). Recording many of these traces for many fluorophores allowed us to explore the attainable precision. The fluorophores were localized multiple times and the localization precision was analysed between the different localizations of the same molecule. To attribute localizations to individual fluorophores, we clustered localizations that were ≤25 nm apart. Only sets with more than five localizations were analysed and the scan centres C i were regarded as the fluorophore coordinate estimates for N < N c , as in the simulations. Once d min = 40 nm was reached, the ‘meandering’ positions C i were averaged to C ¯ i until the specified N and hence C ¯ N was reached. Within each localization cluster, the estimated final coordinates were calculated at multiple photon numbers to establish σ as a function of N . Our experiments show that σ decreases rapidly with decreasing d i until d min is achieved at N c ≈ 60 ( Fig. 3c ). For N> N c , the precision σ follows the 1 / N − N c + 1 dependence (compare Fig. 2c ) until it deviates from the simulation at about σ < 2 nm. This deviation is likely due to residual drifts of the fluorophore and/or the setup. The measured σ at around N = 10 is slightly better than the previously simulated values, because the 5–10 detections gained from the initial fluorophore identification by galvo-scanning provided σ 0 ≈ 60 nm right at the outset. Consideration of this σ 0 resulted in an excellent agreement between the simulated and experimental σ as a function of N ( Fig. 3c ). Since we cannot exclude residual movement of fluorophores on distances substantially less than the standard deviation σ C of C i , we can safely assert that in our experiments MINSTED reached σ = 2–3 nm with just N = 200 detections. Next, we measured σ obtained after d min had been reached. Since the total number of detections before bleaching typically exceeded 1,000 per fluorophore, we split the resultant C i traces into segments of different sizes M and calculated the standard deviations σ M of the localization in these segments. To avoid boundary artefacts, we explored the range N – N c > 25. In agreement with the simulations, the measurements again followed the 1 / N − N c + 1 relation and the linear dependence on d min ( Fig. 3d and Supplementary Fig. 5 ). To highlight the latter, we also scaled the measured σ M to d min = 200 nm so that any difference from the linear dependence could be noticed in the overlay. At σ < 3 nm, the measured σ deviates from the simulations as before. However, the data show that at d min =40 nm, 1,000 detected photons yield molecule-size precisions σ ≈ 1 nm. If residual movements of the stage or the fluorophore could be avoided, ~500 detections at SBR = 20 would suffice for σ ≤ 1 nm. Indeed, comparison of the measured precision with that simulated for the ideal SBR = ∞ case shows improved agreement for smaller d min , indicating that the STED doughnut not only improves the information of the detected photons by confining their origin in space, but also by suppressing the background.
Show full methods section
Experimental MINSTED localization precision
To test these predictions, we localized immobilized individual Atto 647N fluorophores on coverslips 12 using MINSTED with d min ≈ 40 nm. Driven by each detection i , the scan centre progressed toward the fluorophore and ultimately meandered around the estimated final coordinate ( Fig. 3a,b and Supplementary Video 2 ). Recording many of these traces for many fluorophores allowed us to explore the attainable precision. The fluorophores were localized multiple times and the localization precision was analysed between the different localizations of the same molecule. To attribute localizations to individual fluorophores, we clustered localizations that were ≤25 nm apart. Only sets with more than five localizations were analysed and the scan centres C i were regarded as the fluorophore coordinate estimates for N < N c , as in the simulations. Once d min = 40 nm was reached, the ‘meandering’ positions C i were averaged to C ¯ i until the specified N and hence C ¯ N was reached. Within each localization cluster, the estimated final coordinates were calculated at multiple photon numbers to establish σ as a function of N . Our experiments show that σ decreases rapidly with decreasing d i until d min is achieved at N c ≈ 60 ( Fig. 3c ). For N> N c , the precision σ follows the 1 / N − N c + 1 dependence (compare Fig. 2c ) until it deviates from the simulation at about σ < 2 nm. This deviation is likely due to residual drifts of the fluorophore and/or the setup. The measured σ at around N = 10 is slightly better than the previously simulated values, because the 5–10 detections gained from the initial fluorophore identification by galvo-scanning provided σ 0 ≈ 60 nm right at the outset. Consideration of this σ 0 resulted in an excellent agreement between the simulated and experimental σ as a function of N ( Fig. 3c ). Since we cannot exclude residual movement of fluorophores on distances substantially less than the standard deviation σ C of C i , we can safely assert that in our experiments MINSTED reached σ = 2–3 nm with just N = 200 detections. Next, we measured σ obtained after d min had been reached. Since the total number of detections before bleaching typically exceeded 1,000 per fluorophore, we split the resultant C i traces into segments of different sizes M and calculated the standard deviations σ M of the localization in these segments. To avoid boundary artefacts, we explored the range N – N c > 25. In agreement with the simulations, the measurements again followed the 1 / N − N c + 1 relation and the linear dependence on d min ( Fig. 3d and Supplementary Fig. 5 ). To highlight the latter, we also scaled the measured σ M to d min = 200 nm so that any difference from the linear dependence could be noticed in the overlay. At σ < 3 nm, the measured σ deviates from the simulations as before. However, the data show that at d min =40 nm, 1,000 detected photons yield molecule-size precisions σ ≈ 1 nm. If residual movements of the stage or the fluorophore could be avoided, ~500 detections at SBR = 20 would suffice for σ ≤ 1 nm. Indeed, comparison of the measured precision with that simulated for the ideal SBR = ∞ case shows improved agreement for smaller d min , indicating that the STED doughnut not only improves the information of the detected photons by confining their origin in space, but also by suppressing the background.
Methods MINSTED setup
The setup consists of an epi-fluorescence microscope with a dual-channel confocal laser scanning system using a Leica × 100/1.4NA oil-immersion objective lens. Two galvanometer mirrors and pupil relay optics allowed for rapid beam scanning over a quadratic sample area of about 100 μm extent (x,y) . A continuous-wave (CW) HeNe laser provided fluorescence excitation at the 633 nm wavelength for rapid overview. A single-photon counting module detected the fluorescence light in the 650–750 nm range. A confocal pinhole with a diameter of 0.5 Airy units blocked out-of-focus light. For STED microscopy and single-molecule localization, an additional illumination path without moving parts was implemented. Two electro-optic deflectors with pupil relay systems featured beam scanning within a square image area of about 2.6 μm extent. A 635 nm pulsed diode laser delivered excitation pulses of about 100 ps duration, whereas a 775 nm pulsed fibre laser provided STED pulses of about 1 ns duration. A vortex phase plate imprinted a 2π phase ramp on the phase front of the STED beam and a polarization controller converted it to circular polarization to shape the STED beam into a doughnut profile. A laser at 355 nm wavelength illuminated the STED image area to photoactivate the fluorophores. All laser beam powers were modulated with short response times of several microseconds. The sample was mounted on an X-Y-Z-piezo positioning stage whose position was locked by a sample-tracking system. For this purpose, the position of fiducial markers was monitored with infrared light from a super-luminescent light-emitting diode and fast CMOS cameras. The tracking system issued the closed-loop control signals to cancel the sample drift. The MINSTED microscope was fully controlled by an FPGA board and a custom control program. Our software ran diffraction-limited overview scans using only the galvanometer beam scanner as well as high-resolution STED image scans and single-molecule localizations using both scanners synchronously. For STED imaging and localization, a time gate blocked the early fluorescence detections during the STED pulses. A graphical user interface allowed definition of the measurement parameters and retrieval of the measurement results. Immobilization of Atto 647N fluorophores Atto 647N molecules were sparsely distributed and immobilized on cover slides as described in ref. 8 . A flow channel, consisting of a cleaned coverslip glued to a microscope slide with double-sided scotch tape, was rinsed with 100 μl phosphate-buffered saline (PBS; 137 mM NaCl, 2.7 mM KCl, pH 7.4). The channel was filled with 15 μl biotinylated bovine serum albumin (biotinylated BSA; A8549, Sigma Aldrich) 0.5 mg ml -1 in PBS. After 4 min of incubation, the channel was flushed with 100 μl PBS and filled with 15 μl streptavidin (11721666001, Sigma Aldrich) 0.5 mg ml -1 in PBS. After an incubation time of 4 min, the channel was flushed with 100 μl PBS and filled with 15 μl of 200 pM hybridized biotin-DNA/Atto647N-DNA in PBS 8 . After 4 min of incubation, the channel was flushed with 100 μl PBS and filled with 0.01% (w/v) poly-L-lysine (P8920, Sigma Aldrich) in PBS for 10 min. After flushing with 100 μl PBS, the channel was filled with 15 μl freshly diluted silica shelled silver nanoplates (SPSH1050, nanoComposix) 2.5 μg ml -1 in PBS. After 10 min of incubation the channel was flushed with PBS again, filled with 15 μl ROXS buffer 21 and sealed with epoxy glue (Hysol, Locktite). Antibody conjugation The labelling of the antibody using glycan modification and strain-promoted click chemistry, together with the synthesis of the dye used was as described previously 13 . In short, the rabbit monoclonal antibody (ab245764, Abcam) was modified with azide groups using a commercial enzyme system (GlyClick, Genovis). After the modification, 250 μg antibody in 200 μl Tris-buffered saline (TBS; 20 mM Tris HCl, 150 mM NaCl, pH 7.6) was mixed with 50 μl dimethylformamide containing 50 μg dibenzylcyclooctyne dye and stirred overnight. The free dye was removed via phase extraction by adding 600 μl distilled water, 90 μl saturated (NH4)2SO4 solution and 900 μl tert -butanol, vortexing and separating the phases after a short centrifugation pulse. The aqueous phase (about 600 μl) was diluted using 600 μl TBS. The labelled antibodies were aliquoted and stored at −20 °C.
Cell labelling
The human osteosarcoma cell line U-2 OS was obtained from the European Collection of Authenticated Cell Cultures (ECACC; cat. no. 92022711, lot 17E015) and cultivated on coverslips in McCoy’s medium (Thermo Fisher Scientific) supplemented with 10% (v/v) fetal bovine serum (Thermo Fisher Scientific), 1% (v/v) sodium pyruvate (Sigma Aldrich) and penicillin–streptomycin (Sigma Aldrich). The cells were fixed using 8% (w/v) paraformaldehyde in PBS for 5 min, permeabilized with 0.5% (w/v) Triton X-100 for 5 min and quenched with 100 mM NH 4 Cl in PBS for 5 min. The fixed cells were washed with PBS, blocked with 2% (w/v) BSA in PBS and treated with the primary antibody in the same buffer for 1 h, washed with 2% (w/v) BSA in PBS, treated with a secondary goat anti-rabbit antibody conjugated with Alexa 647 as counterstain for MINSTED and washed with PBS. The cells were incubated with freshly diluted silica shelled silver nanoplates (SPSH1050, nanoComposix) 2.5 μg ml -1 in PBS for 10 min and washed with PBS again.
Cell imaging
The confocal and STED images were recorded using a commercial Abberior Instruments Expert Line microscope equipped with a 775 nm 40 MHz STED laser and a 640 nm excitation laser after activation with a spectrally broad 405 nm light-emitting diode as described in ref. 13 . For MINSTED, the labelled cells were incubated with freshly diluted silica shelled silver nanoplates in PBS for 20 min and then washed with PBS. The samples were mounted with buffer (20 mM HEPES, 150 mM NaCl, pH 7) using Twinsil (Picodent). Before MINSTED, the cells were selected based on the counterstain signal and the Alexa 647 dyes were bleached using low-power STED light. The localization routine was started without the excitation laser to equilibrate the temperature in the immersion oil and sample, which were warmed up by the STED laser. After 10 s, the excitation laser was enabled and the caged dyes were sparsely activated using 355 nm light when searching for another active fluorophore. Over the duration of the measurement, the ultraviolet laser power was slowly increased to keep the activation rate constant. The imaging was stopped when no further molecules could be activated.
Data analysis
The localizations were analysed based on the centre positions C i ≥ N c at d min . The localizations were further selected with a maximum filter on the standard deviation σ c of the C i , together with a minimum filter on the number of detected photons N . The precision of each localization was estimated as described in the Supplementary Information and validated by simulations ( Supplementary Fig. 3 ). The image was rendered with the estimated precision lower-bounded to 3 nm. Reporting summary Further information on research design is available in the Nature Research Reporting Summary linked to this article.
Supplementary Material Supplementary material Supplementary video 1 Supplementary video 2
📊 Figures
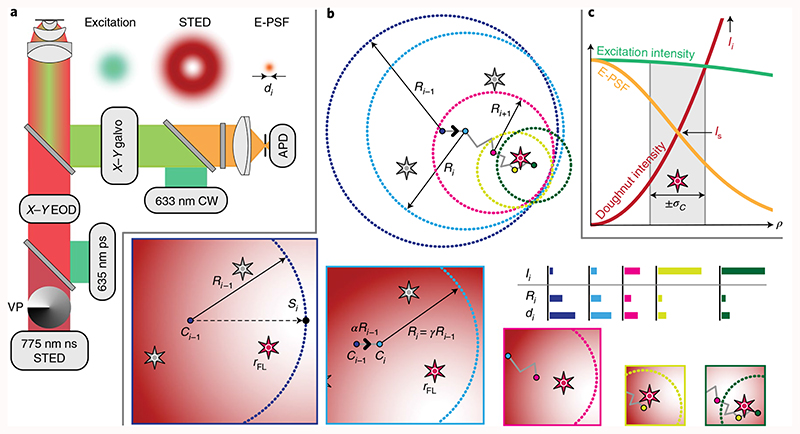
Fig. 1
Principles of MINSTED localization.
a , STED setup with co-aligned pulsed lasers for excitation and STED at 635 and 775 nm, respectively, and a vortex phase plate (VP) for helical phase modulation converting the STED beam into a doughnu...
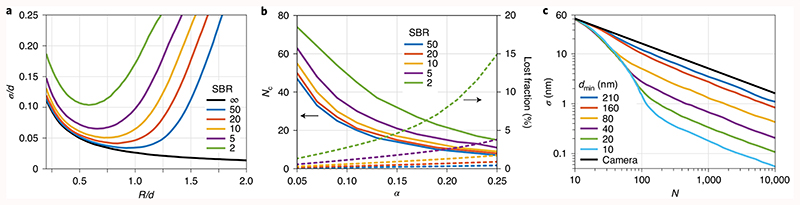
Fig. 2
Simulation of MINSTED localization with N = 100 detected photons.
a , Localization precision u03c3 with different ratios of scan radius R to FWHM d of the STED microscopeu2019s Gaussian E-PSF with the SBR as the parameter. While the hypothetical infinite SBR case ca...
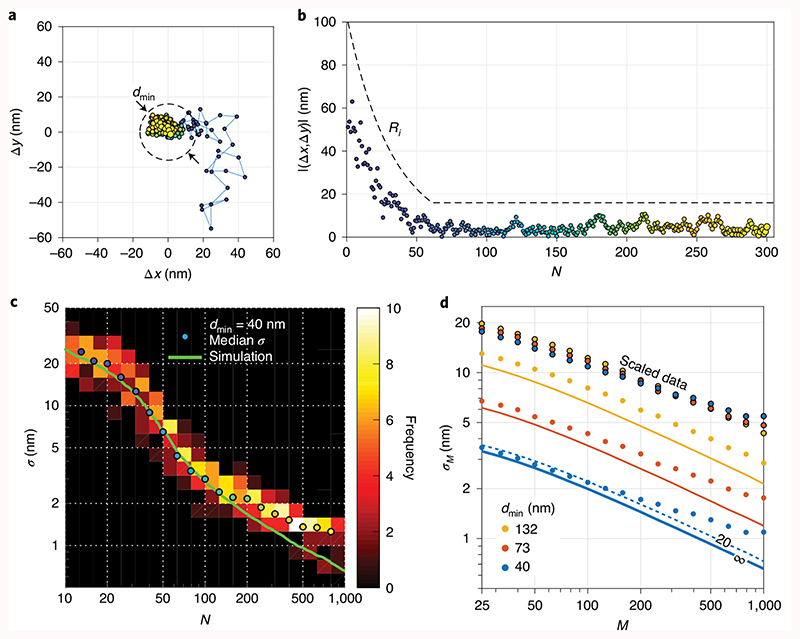
Fig. 3
MINSTED localization of single fluorophores.
a , Localization trace from the first i = 1 (blue) to the last detection i = 300 (yellow) with the final scan circle (dashed line) around the estimated (x,y) position. b , Scan radius R i (dashed line...
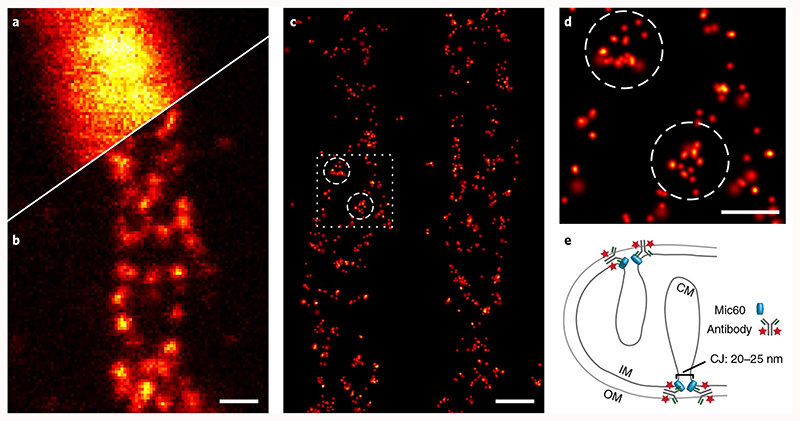
Fig. 4
MINSTED nanoscopy of mitochondrial protein Mic60.
a , b Confocal ( a ) and STED ( b ) images with d u2248 60nm of the same mitochondrion taken after simultaneous activation of all fluorophores. c , MINSTED nanoscopy image of similar mitochondria reso...
Figure images are served from the NIH/NLM PubMed Central Open Access Subset or Europe PMC; copyright remains with the publishers and authors.
💬 Discussion
0 commentsNo comments yet. Be the first to start a discussion!
Leave a Comment