Abstract
Mitochondrial dynamics is an essential physiological process controlling mitochondrial content mixing and mobility to ensure proper function and localization of mitochondria at intracellular sites of high-energy demand. Intriguingly, for yet unknown reasons, severe impairment of mitochondrial fusion drastically affects mtDNA copy number. To decipher the link between mitochondrial dynamics and mtDNA maintenance, we studied mouse embryonic fibroblasts (MEFs) and mouse cardiomyocytes with disruption of mitochondrial fusion. Super-resolution microscopy revealed that loss of outer mitochondrial membrane (OMM) fusion, but not inner mitochondrial membrane (IMM) fusion, leads to nucleoid clustering. Remarkably, fluorescence in situ hybridization (FISH), bromouridine labeling in MEFs and assessment of mitochondrial transcription in tissue homogenates revealed that abolished OMM fusion does not affect transcription. Furthermore, the profound mtDNA depletion in mouse hearts lacking OMM fusion is not caused by defective integrity or increased mutagenesis of mtDNA, but instead we show that mitochondrial fusion is necessary to maintain the stoichiometry of the protein components of the mtDNA replisome. OMM fusion is necessary for proliferating MEFs to recover from mtDNA depletion and for the marked increase of mtDNA copy number during postnatal heart development. Our findings thus link OMM fusion to replication and distribution of mtDNA.
🔬 Techniques
🔭 Microscopes
💻 Software
✨ Fluorophores
🧪 Sample Preparation
🔬 Cell Lines
🏭 Microscope Brands
🧪 Reagent Suppliers
🔎 Objectives
💻 Software Details
💾 Data Repositories
🏛️ Research Organizations (ROR)
Affiliated research institutions:
📋 Methods
Contact for reagent and resource sharing
Further information and requests for resources and reagents should be directed to and will be fulfilled by the lead contact, Nils-Göran Larsson ( nils-goran.larsson@ki.se ) Ethics statement All animal procedures were conducted in accordance with European, national and institutional guidelines and protocols were approved by the Landesamt für Natur, Umwelt und Verbraucherschutz, Nordrhein-Westfalen, Germany. Animal work also followed the guidelines of the Federation of European Laboratory Animal Science Associations (FELASA).
Mice
C57BL/6N mice with loxP-flanked Mfn1 and Mfn2 genes were previously described in Lee et al ., 2012 [ 51 ]. To generate Mfn1 and 2 heart conditional double knockout mice, male mice homozygous for mitofusin 1, heterozygous for mitofusin 2, and heterozygous for expression of cre-recombinase in heart and skeletal muscle ( Mfn1 loxP/loxP , Mfn2 +/l oxP ; Ckmm-cre -/+ ), were crossed with female mice homozygous for loxP-flanked mitofusin 1 and 2 genes ( Mfn1 loxP/loxP , Mfn2 loxP/l oxP ). Littermates lacking the transgenic Cre-recombinase allele were used as controls. In some crosses, an allele allowing for the ubiquitous expression of a mitochondria-targeted YFP from the ROSA26 locus was also introduced.
Cell lines Immortalized
MEFs with homozygous knockout for Mfn1 , Mfn2 or both Mfn1 and Mfn2 , were originally generated in the lab of Dr. David Chan [ 2 , 52 ]. Mitofusin and Opa1 KO MEFs were obtained from Dr. Thomas Langer. MEFs were maintained in DMEM GlutaMax containing 25 mM glucose (Thermo Fisher Scientific, 31966–021) supplemented with 10% fetal bovine serum (Thermo Fisher Scientific, 10270–106), 1% penicillin/streptomycin (Thermo Fisher Scientific, 15070–063), 1% non-essential amino acids (Thermo Fisher Scientific, 11140–050), and 50 μg/ml uridine. Cells were passaged every 3 to 4 days.
Show full methods section
Contact for reagent and resource sharing
Further information and requests for resources and reagents should be directed to and will be fulfilled by the lead contact, Nils-Göran Larsson ( nils-goran.larsson@ki.se ) Ethics statement All animal procedures were conducted in accordance with European, national and institutional guidelines and protocols were approved by the Landesamt für Natur, Umwelt und Verbraucherschutz, Nordrhein-Westfalen, Germany. Animal work also followed the guidelines of the Federation of European Laboratory Animal Science Associations (FELASA).
Mice
C57BL/6N mice with loxP-flanked Mfn1 and Mfn2 genes were previously described in Lee et al ., 2012 [ 51 ]. To generate Mfn1 and 2 heart conditional double knockout mice, male mice homozygous for mitofusin 1, heterozygous for mitofusin 2, and heterozygous for expression of cre-recombinase in heart and skeletal muscle ( Mfn1 loxP/loxP , Mfn2 +/l oxP ; Ckmm-cre -/+ ), were crossed with female mice homozygous for loxP-flanked mitofusin 1 and 2 genes ( Mfn1 loxP/loxP , Mfn2 loxP/l oxP ). Littermates lacking the transgenic Cre-recombinase allele were used as controls. In some crosses, an allele allowing for the ubiquitous expression of a mitochondria-targeted YFP from the ROSA26 locus was also introduced.
Cell lines Immortalized
MEFs with homozygous knockout for Mfn1 , Mfn2 or both Mfn1 and Mfn2 , were originally generated in the lab of Dr. David Chan [ 2 , 52 ]. Mitofusin and Opa1 KO MEFs were obtained from Dr. Thomas Langer. MEFs were maintained in DMEM GlutaMax containing 25 mM glucose (Thermo Fisher Scientific, 31966–021) supplemented with 10% fetal bovine serum (Thermo Fisher Scientific, 10270–106), 1% penicillin/streptomycin (Thermo Fisher Scientific, 15070–063), 1% non-essential amino acids (Thermo Fisher Scientific, 11140–050), and 50 μg/ml uridine. Cells were passaged every 3 to 4 days.
Transmission electron microscopy
Electron micrographs of heart mitochondria from control and dMfn heart double knockout mice were obtained as previously described [ 53 ]. Small pieces from the left myocardium were fixed in a mix of 2% glutaraldehyde and 1% paraformaldehyde in 0.1 M phosphate buffer pH 7.4, at room temperature for 30 min, followed by 24 hours at 4°C. Specimens were rinsed in 0.1 M phosphate buffer and post-fixed in 2% OsO 4 for 2 hours, dehydrated and embedded in LX-112 resin. Ultra-thin sections (approximately 50–60 nm) were cut and sections were examined in a transmission electron microscope (Tecnai 12, FEI Company, Netherlands) at 80 kV. Digital images at a final magnification of 8,200x were randomly taken on myofibrils from sections of the myocardium. The volume density (Vv) of mitochondria was calculated on printed digital images by point counting using a 2 cm square lattice [ 54 ]. To determine the number of images needed for an appropriate sampling, we used a cumulative mean plot [ 54 ]. In total, 15 randomly taken images were used from each animal.
Mitochondria isolation
Mice were sacrificed by cervical dislocation and hearts were quickly washed in ice-cold PBS. Hearts were then minced and gently homogenized using a Potter S homogenizer (Sartorius) in 5 ml of mitochondria isolation buffer (MIB, 310 mM sucrose, 20 mM Tris-HCl, and 1 mM EGTA). Differential centrifugation of homogenates was performed to isolate intact mitochondria. First, homogenates were centrifuged for 10 min at 1,000x g at 4°C. Then, supernatants were collected and centrifuged again for 10 min at 4,500x g at 4°C. Crude mitochondria were resuspended in MIB and the protein concentration was determined by using the DC Protein assay (Bio-Rad). Mitochondrial respiration The flux of mitochondrial oxygen consumption in isolated heart mitochondria was measured as previously described [ 55 ]. The assay was performed on 100–125 μg of crude heart mitochondria diluted in 2 ml of mitochondria respiration buffer (120 mM sucrose, 50 mM KCl, 20 mM Tris-HCl, 4 mM KH 2 PO 4 , 2 mM MgCl 2 , and 1 mM EGTA, pH 7.2) in an Oxygraph-2K (Oroboros Instruments) at 37°C. The mitochondria oxygen consumption rate was evaluated using either 10 mM pyruvate, 5 mM glutamate, and 5 mM malate. The oxygen consumption flux was assessed in the phosphorylating state with 1 mM ADP or in the non-phosphorylating state by addition of 2.5 μg/ml oligomycin. Lastly, mitochondrial respiration was uncoupled by successive addition of CCCP up to 3 μM to reach maximal oxygen consumption. The respiratory control ratio values were >10 with pyruvate/glutamate/malate and >5 with succinate/rotenone based on control heart mitochondria.
Western blotting
Heart tissue and whole cells were lyzed in RIPA buffer (150 mM sodium chloride, 1.0% NP-40 or Triton X-100, 0.5% sodium deoxycholate, 0.1% SDS (sodium dodecyl sulfate), 50 mM Tris, pH 8.0). Isolated heart mitochondria were resuspended in NuPAGE LDS Sample Buffer (novex, NP0007) with 0,1M dithiothreitol, and proteins were separated by SDS-PAGE using 4–12% precast gels (Invitrogen), followed by blotting onto polyvinylidene difluoride (PVDF) membranes or in particular cases onto nitrocellulose membranes (GE Healthcare). Membranes were blocked in 3% milk/TBS. The following primary antibodies were used: mouse anti-OXPHOS cocktail (1:1000, ab110413), mouse ATP5A (1:1000, ab14748), rabbit anti-POLγA (1:250, ab12899), rabbit anti-TFAM (1:1000, ab131607), mouse anti-VDAC (1:1000, ab14734), all from Abcam, and rabbit anti-SSBP1 (1:500, HPA002866) from Sigma. Rabbit polyclonal antisera were generated by Agrisera and recognize the mouse TWINKLE, TFB2M, LRPPRC, and POLRMT proteins [ 48 , 56 , 57 ]. All TWINKLE, TFB2M, and POLRMT rabbit polyclonal antisera were affinity purified using the corresponding recombinant protein. The following secondary antibodies were applied at a 1:10,000 dilution: donkey anti-rabbit IgG (NA9340V) and sheep anti-mouse (NxA931) both from GE Healthcare. Detection of HRP-conjugated secondary antibodies was achieved by enhanced chemiluminescence (Immun-Star HRP Luminol/Enhancer from Bio-Rad). Glycerol gradients Mitochondrial isolation from cells and glycerol density gradients were performed as described [ 58 ]. In brief, crude mitochondria were isolated from cells by differential centrifugation, treated with DNase and RNase and purified in sucrose gradients. A 15–40% glycerol gradient containing a 20% glycerol / 30% iodixanol pad at the bottom was cast using a gradient master (model 107, Biocomp) with the following settings: 2 min and 31 sec run time, 81.65 angle, and speed set to 14. Mitochondria (250–600 μg) were lyzed in 2% Triton X-100 for 15 min on ice and afterwards the total lysate was carefully layered on top of the gradient. Samples were centrifuged at 151,000 x g at 4°C for 4 hours. The gradient was manually fractionated in 750 μl increments from top to bottom. Fractions were then divided in half, whereby one portion was used to precipitate proteins overnight with 12% trichloroacetic acid and 0.02% sodium deoxycholate, followed by centrifugation at 20,000 x g for 20 min at 4°C and acetone washes, while the other half of fraction 1 was used to isolated mtDNA by proteinase K treatment followed by phenol/chloroform extraction. Thereafter, protein samples were processed for western blot analysis and mtDNA samples for Southern blot analysis.
Determination of cellular dNTP pools
Cells were grown on 100 mm dishes in DMEM GlutaMax containing 25 mM glucose and supplemented with 10% FBS, 1% penicillin and streptomycin, 1% non-essential amino acids, and 50 μg/ml uridine. Positive control cells were treated with hydroxyurea (Sigma, H8627) at 2 mM for 30 hours to mildly deplete purines. Cells were quickly washed with ice-cold PBS, detached by trypsinization with 0.05% trypsin and the total number of cells was determined using a Vi-cell XR cell analyzer (Beckman Coulter). Approximately 2 million cells were centrifuged at 800x g for 5 min, washed with ice-cold PBS, and resuspended in 1 ml of ice-cold 60% methanol. Samples were then vortexed rigorously, frozen for 30 min at -20°C, and sonicated for 15 min on ice. After sonication, samples were centrifuged at 1000x g for 5 min at 4°C and supernatants collected. Extraction solution was evaporated using an Eppendorf Concentrator plus at room temperature. Dried pellets were dissolved in 100 μl Milli-Q water, vortexed and sonicated for 2 min. After sonication samples were vortexed again and filtrated through a 0.2 μm modified nylon centrifugal filter (VWR) with an Eppendorf centrifuge 5424R set to 8°C and 12000 rpm. The external standard calibration curve was prepared in concentrations from 5 to 600 ng/ml of the dNTPs. All solutions were daily fresh prepared from stock solutions of 100 μg/ml and dissolved in Milli-Q water. dNTP analysis was conducted using a Dionex ICS-5000 (Thermo Fisher) Anion exchange chromatography using a Dionex Ionpac AS11-HC column (2 mm x 250 mm, 4 μm particle size, Thermo Fisher) at 30°C. A guard column, Dionex Ionpac AG11-HC b (2 mm x 50 mm, 4 μm particle size, Thermo Fisher), was placed before the separation column. The eluent (KOH) was generated in-situ by a KOH cartridge and deionized water. At a flow rate of 0.380 mL/min a gradient was used for the separation: 0–3 min 10 mM KOH, 3–12 min 10–50 mM, 12–19 min 50–100 mM, 19–21 min 100 mM 21–25 min 10 mM. A Dionex suppressor AERS 500, 2 mm was used for the exchange of the KOH and operated with 95 mA at 15°C. The suppressor pump flow was set at 0.6 mL/min. 10 μL of sample in a full loop mode (overfill factor 3) was injected. Autosampler was set to 6°C. The Dionex ICS-5000 was connected to a XevoTM TQ (Waters) and operated in negative ESI MRM (multi reaction monitoring) mode. The source temperature was set to 150°C, desolvation temperature was 350°C and desolvation gas was set to 50 L/h, cone gas to 50 L/h. The following MRM transitions were used for quantification: dGTP, transition 505.98 → 408.00, cone 30, collision 20; dATP, transition 490.02 → 158.89, cone 30, collision 26; dTTP, transition 480.83 → 158.88, cone 28, collision 46; dCTP, transition 465.98 → 158.81, cone 28, collision 30. The software MassLynx and TargetLynx (Waters) were used for data management and data evaluation & quantification. The calibration curve presented a correlation coefficient: r2 > 0.990 for all the compounds (response type: area; curve type linear). Quality control standards were tested during the sample analysis. The deviation along the run was between 0.5% and 40% respectively. Blanks after the standards, quality control and samples did not present significant peaks.
Northern blotting
RNA was isolated from heart tissue either by using the ToTALLY RNA isolation kit (Ambion) or by using TRIzol Reagent (Invitrogen), and subjected to DNase treatment (TURBO DNA-free, Ambion). 1–2 μg of total RNA was denatured in RNA Sample Loading buffer (Sigma), electrophoresed in 1 or 1.8% formaldehyde-MOPS agarose gels prior transfer onto Hybond-N+ membranes (GE Healthcare). After UV crosslinking the membranes were successively hybridized with various probes at 65°C in RapidHyb buffer (Amersham) and then washed in 2x SSC/0.1% SDS and 0.2x SSC/0.1% SDS before exposure. Mitochondrial probes used for visualization of mRNA and rRNA levels were restriction fragments labeled with α- 32 P-dCTP and a random priming kit (Agilent). Different tRNAs and 7S rRNA were detected using specific oligonucleotides labeled with γ- 32 P-dATP. Radioactive signals were detected by autoradiography. mRNA expression analysis Total RNA from frozen heart tissue was isolated using RNeasy Mini Kit (Qiagen) following the manufacturer’s instructions, DNase treated using TURBO DNA-free Kit (Thermo Fisher Scientific), and RNA subjected to reverse transcription PCR (RT-PCR) for cDNA synthesis using High Capacity cDNA reverse transcription kit (Applied Biosystems). Real-time quantitative reverse transcription PCR (qRT-PCR) was performed using the following Taqman probes from Thermo Fisher Scientific: Mfn1 (Mm01289372_m1), Mfn2 (Mm00500120_m1), and β-2-microglobulin ( B2M , Mm00437762_m1). The quantity of transcripts was normalized to B2M as a reference gene transcript. mtDNA and 7S DNA quantification mtDNA analysis by Southern blotting Southern blotting was performed as previously described [ 48 ]. In brief, total DNA from heart tissue was extracted using phenol/chloroform. Total DNA, 5 μg, was digested with Sac I (New England Biolabs), the fragments were separated in a 0.8% agarose gel, and transferred to nitrocellulose membrane (Hybond-N+, GE Healthcare). Membranes were hybridized with α- 32 P-dCTP-labeled probes for mtDNA (pAM1) and nuclear DNA (18S). D-loop Southern blotting Mitochondrial DNA was isolated from crude heart mitochondria by phenol/chloroform extraction followed by RNase A treatment for 1 hour at 37°C. The mtDNA, 3 μg, was linearized overnight by SacI digestion at 37°C. DNA was precipitated, resuspended in 10 mM Tris pH 8.0, separated in a 0.9% agarose gel, transferred to a nitrocellulose membrane, and hybridized with α- 32 P-dATP-labeled probe recognizing mtDNA and 7S DNA. mtDNA and 7S DNA analysis by quantitative PCR Total DNA from heart tissue and immortalized MEFs was extracted using the DNeasy Tissue and Blood Kit (QIAGEN) based on the manufacturer’s instructions. Total DNA, 5 ng, was used to quantify mtDNA and nuclear DNA by qPCR using the following Taqman probes from Thermo Fisher Scientific: 16S (Mm04260181_s1), ATP6 (Mm03649417-g1), β-actin (Mm01205647_g1), and 18S (Hs99999901_s1). To quantify the mitochondrial 7S DNA, a custom Taqman probe recognizing mouse 7S DNA was constructed and validated using models known to have changes in 7S DNA levels. The mouse 7S DNA probe sequences are the following: forward primer, CTAATGTTATAAGGACATATCTGTGTTATCTGACATAC; reverse primer, GGTTTCACGGAGGATGGTAGATTAA; FAM reporter primer binding to 7S DNA and the displaced mtDNA strand, ACCATACAGTCATAAACTCTT. Since this probe can quantify both mtDNA (displaced strand) and 7S DNA, the abundance of 7S DNA was determined by normalizing the value obtained from 7S DNA probe to the value from an ATP6 probe which does not recognize 7S DNA. Mutation load analysis Total DNA was extracted from heart and the somatic mtDNA mutation load was determined by post-PCR, cloning, and sequencing as described previously [ 59 ]. We used primers that amplify a region of the mtDNA spanning the 3’ end of mtND2 through approximately a third of mtCO1 (nucleotide pair 4950–5923 of the mouse reference mtDNA sequence GenBank NC_005089 ). The resulting clones were filtered to remove sequences derived from the known nuclear mitochondrial sequences (NUMTs).
Sequencing to identify mitochondrial DNA deletions
DNA from isolated heart mitochondria was used to generate libraries for sequencing to detect mtDNA deletions. Total genomic DNA from the Deletor mouse was provided by Dr. Anu Suomalainen-Wartiovaara and used as a positive control for the detection of mtDNA rearrangements [ 32 ]. A standard Illumina TrueSeq paired-end library was prepared with ~500 base pair fragment inserts. Paired-end 100 base pair sequencing was conducted using an Illumina HiSeq 2500. The reads were mapped to the genomic sequence without the mitochondria using bowtie (VN: 2.1.0) to remove nuclear-genomic sequences [ 60 ]. The unmapped reads were then mapped to the mitochondrial sequence (GenBank JF286601.1 ) using bwa (n = 0.04, VN: 0.6.2-r126) [ 61 ] with unmapped reads undergoing an additional mapping round after trimming fastx_trimmer, VN: 0.0.13.2) to ensure higher mapping results. Using samtools [ 62 ] (VN: 1.0: samtools -f1 –F14) reads, where the two paired sequences were observed to be greater than 600 base pair apart were identified as those containing deletion breakpoints. These reads were extracted for additional analysis. The data presented in this publication have been deposited in NCBI's Gene Expression Omnibus [ 63 ] and are accessible through GEO Series accession number GSE124420 ( https://www.ncbi.nlm.nih.gov/geo/query/acc.cgi?acc=GSE124420 ). mtDNA topology analysis Total DNA was extracted from 20 mg of mouse heart tissue. Briefly, the minced tissue was lyzed in 600 μl of lysis buffer (100 mM Tris-HCl pH 7.5, 100 mM EDTA, 100 mM NaCl, 0.5% SDS, 0.5 mg/ml Proteinase K) at 55°C for 3 hours followed by 2 hours incubation on ice with premixed LiCl and K-acetate (final concentration 270 mM K-acetate, 820 mM LiCl) to precipitate contaminants. To remove the precipitate, the sample was centrifuged for 10 min at 10,000 rpm at room temperature and thereafter the DNA was precipitated with isopropanol overnight. The pelleted DNA was washed with 75% ethanol and resuspended to 10 mM Tris-HCl, 1 mM EDTA pH 8.0 followed by quantification with Qubit. To analyze the major topological isomers of the mtDNA, 200 ng of total DNA was resolved in a 0.4% agarose gel (15 x 15 cm) without ethidium bromide at 35 V for 20 hrs, followed by transfer onto Hybond-N+ membrane (GE Healthcare). The mtDNA was detected using [α- 32 P]-dCTP labeled probe (pAM1). To identify different topological isomers of the mtDNA, 200 ng of control total DNA was incubated at 37°C for 30 min with only buffer, SacI (New England Biolabs; 20 U), Nt.BbvCI (New England Biolabs; 10 U), Topo I (New England Biolabs; 5 U), Topo II (USB Affymetrix; 20 U), DNA gyrase (New England Biolabs; 5 U). The method was modified from [ 64 ]. de novo mitochondrial transcription assay Isolated heart mitochondria were purified by differential centrifugation in 320 mM sucrose, 10 mM Tris-HCl and 2 mM EDTA. From the same mitochondrial preparation: i) 300 μg of mitochondria were labeled with 50 μCi of [α- 32 P]-UTP (Perkin-Elmer) and processed as previously described to assess de novo mitochondrial transcription [ 57 ]; ii) as a loading control, 30 μg of mitochondria were subjected to SDS-PAGE and immunoblotted using mouse anti-VDAC antibody (Calbiochem); and iii) 300 μg of mitochondria were used to measure the ratio between 7S DNA and mitochondrial DNA. In the latter case, the mitochondrial pellet was resuspended in 50 mM Tris-HCl pH 7.5, 75 mM NaCl, 6.25 mM EDTA, 1% SDS and 1,2 mg/ml of Proteinase K and incubated for 1 hr at 37°C. After boiling for 5 min at 95°C, samples were electrophoresed in 0.8% agarose gels and transferred onto nylon membranes by Southern blotting. Both, mitochondrial DNA and 7S DNA were detected using [α- 32 P]-dCTP-labeled DNA probes specific for 7S DNA. de novo mitochondrial replication assay Isolated heart mitochondria were purified by differential centrifugation and 15 μg of mitochondria were used to assess loading. For de novo mtDNA replicaton, 300 μg of mitochondria were washed with 500 μl ice-cold incubation buffer (25 mM sucrose, 75 mM sorbitol, 10 mM K 2 HPO 4 , 100 mM KCl, 0.05 mM EDTA, 5 mM MgCl 2 , 10 mM Tris-HCl pH 7.4, 10 mM glutamate, 2.5 mM malate, 1 mg/ml BSA, and fresh 1 mM ADP, final pH 7.2), centrifuged at 9,000 rpm for 4 min at 4°C, resuspended in incubation buffer containing 50 μM of dCTP, dGTP, dTTP and 20 μCi of radioactive α- 32 P-dATP, and incubated for 2 hours at 37°C. Thereafter, mitochondria were centrifuged at 9,000 rpm for 4 min at 4°C and washed 3x with 500 μl ice-cold washing buffer (10% glycerol, 0.15 mM MgCl 2 , 10 mM Tris-HCl pH 6.8). Mitochondria were treated with 1,2 mg/ml proteinase K and DNA extracted with phenol/chloroform. The mtDNA was resuspended in 30 μl TE buffer and one half boiled at 95°C for 5 min. Next, DNA was separated by electrophoresis on a 0.8% agarose gel for 15 hours at 20 V and transferred onto nylon membranes (Hybond-N+, GE Healthcare), followed by membrane cross-linking. Both Phosphor Imager (Fuji Film FLA-7000) and autoradiography films (GE Healthcare) were used to detect the radioactive signal. After the radioactive signal had decayed, steady-state mitochondrial DNA and 7S DNA levels were assessed by using an α- 32 P-dATP-labeled DNA probe for 7S DNA. Analysis of abortive mtDNA products de novo mtDNA replication images were quantified using ImageJ for densitometry analysis. The cumulative abortive mtDNA products were defined as the signal directly above and below the 7S DNA band.
Growth curve assay
The growth rate of log phase cells was assessed by equilibrating cells to galactose media (DMEM supplemented with 15 mM galactose, 1mM sodium pyruvate (Thermo Fisher Scientific, 11360–039), 10% FBS, 1% Penicillin/Streptomycin, 1% non-essential amino acids, and 50 μg/ml uridine) for 3 days, followed by plating 27,000 cells in a six-well plate containing 3 ml of galactose media. Cells were collected by trypsinization with 1 ml of 0.05% Trypsin-EDTA (Thermo Fisher Scientific, 25300–054) every 24 hours and viable cells counted using a Vi-Cell XR analyzer (Beckman Coulter). Cellular respiration MEFs in log phase were grown in DMEM GlutaMax containing 25 mM glucose and supplemented with 1% dialyzed fetal bovine serum, 1% penicillin/streptomycin, 1% non-essential amino acids, and 50 μg/ml uridine for 5 to 6 days. MEFs were passaged once during this timeframe. Cells were then collected by trypsinization and counted. The flux of mitochondrial oxygen consumption was determined using 1 million viable cells as described for isolated heart mitochondria, see Mitochondrial respiration , expect for the following modifications. Cells were permeabilized with 0.02 mg/ml digitonin and the oxygen consumption rate in state 3 was assessed using 10 mM succinate and 5 mM glycerol-3-phosphate.
Ethidium bromide treatment of cells
MEFs were cultivated in 18 ml of DMEM GlutaMax containing 25 mM glucose and supplemented with 10% FBS, 1% penicillin and streptomycin, 1% non-essential amino acids, and fresh 100 ng/ml ethidium bromide. After 6 days of cultivation in the presence of ethidium bromide, cells were switched to medium containing no ethidium bromide for 6 days. Cells were passaged every 2–3 days during both conditions. Total DNA was extracted using the DNeasy Tissue and Blood Kit (QIAGEN) and mtDNA levels determined, see mtDNA quantification by qPCR .
Immunocytochemistry Cell lines
Cells plated onto glass coverslip were fixed in 4% paraformaldehyde for 10 min at room temperature, washed twice with PBS, permeabilized with 0.1% Triton-X in PBS for 5 min, blocked in 3% BSA for 30 min, and incubated overnight at 4°C with the following primary antibodies prepared in 3% BSA: mouse IgM anti-DNA (Progen, 61014, 1:250), rabbit anti-TOM20 (Santa Cruz, sc-11415, 1:1000), goat anti-HSP60 (Santa Cruz, 1052, 1:500), rabbit anti-SSBP1 (Sigma, HPA002866 1:500), rat anti-BrdU (Abcam, 6326,1:250), and rabbit anti-TFAM (Agrisera, custom-made, 1:3000). The following secondary antibodies at 1:500 in 3% BSA were incubated for 2 hours at room temperature: donkey anti-mouse IgM Alexa 488, donkey anti-goat Alexa 633, donkey anti-rat DyLight 488, or donkey anti-rabbit Cy3. Coverslips were extensively washed with PBS, counterstained with DAPI in PBS (1:1000, Invitrogen) before mounting with Aqua/Poly-mount (Polyscience Inc.). For super-resolution imaging, cells were grown on coverslips overnight, fixed with methanol at -20°C for 5 min, blocked with 5% (w/v) BSA in PBS for 5 min, incubated with 20 μg/ml RNAse A (Sigma Aldrich) in 0.5% Tween 20 (Sigma Aldrich) in PBS for 2 hours at 37 °C. Finally, the cells were incubated with Quant-iT PicoGreen dsDNA Reagent (Thermo Fisher Scientific) in PBS for 30 min. After several washing steps, the samples were mounted in Mowiol. Samples were measured within three hours after the sample preparation. Heart tissue Freshly isolated hearts were fixed by immersion in 4% PFA, cryopreserved in 30% sucrose and frozen in optimal cutting temperature compound (OCT). 10 μm-thick cryosections were cut and air dried prior to fluorescent immunohistochemistry. Sections were then permeabilized in 0.5% Triton X-100/PBS and binding of antibodies to unspecific sites was prevented by incubation in blocking buffer (3% BSA/PBS). Primary antibody incubation was performed overnight at 4°C, by applying the following antibodies in blocking buffer: mouse IgM anti-DNA (Progen, 1:100), chicken anti-GFP (Aves, 1:300). After washing, the following secondary antibodies were applied: goat anti-mouse IgM Alexa 594, and donkey anti-chicken Alexa 488. Nuclei were counterstained with DAPI.
Fluorescence in situ hybridization
For experiments requiring dual visualization of mRNA and proteins, FISH was performed prior to immunocytochemistry, by using the QuantiGene ViewRNA ISH Cell Assay (Affymetrix) following the manufacturer’s instructions. To visualize mitochondrial RNA, cells were hybridized 3 hours at 40°C using the Cox1 mRNA probe (1:500, cat# VB4-17017, Affymetrix). To confirm probe specificity towards RNA, treatments with RNAse T1 and DNAse1 (both at 250U/mL, 37°C) were performed prior to hybridization.
Bromouridine labeling
Cells grown on coverslips for 24 hours in DMEM medium, without uridine supplementation were incubated with 5 mM BrU for 1 hour at 37°C and 5% CO 2 . A short chase using DMEM medium containing 50 μg/ml uridine was performed followed by a PBS wash prior to fixation. BrU was prepared fresh for each experiment. Standard immunocytochemistry procedures were carried out to visualize the mitochondrial network, mtDNA, and newly synthesized BrU-labeled RNA.
Imaging of MEFs Confocal microscopy
Fluorescence images were acquired using a laser-scanning Leica TCS SP8-X inverted confocal microscope, containing a white light laser, a 405-diode UV laser, and a 100x objective (HCX PL APO 100x oil, 1.46 N.A). Stack images were acquired in sequential mode using a scanning speed of 200 Hz, an image size of 1,024 x 1,024 pixels, and z-step of 0.2 μm.
STED microscopy
STED images of MEFs were acquired with a two-color Abberior STED 775 QUAD scanning nanoscope (Abberior Instruments, Goettingen Germany) using a 485 nm excitation laser and a pulsed 595 nm STED laser (PicoGreen labeling) or a 640 nm excitation laser together with a 775 nm STED laser (Antibody labeling) and a 100x oil immersion objective lens (NA 1.4). Image analysis was performed manually using Imspector Software, by measuring the diameter of nucleoids at full width at half maximum (Abberior Instruments, Goettingen Germany).
Imaging of heart tissue
Imaging of heart sections was performed using a Leica TCS SP8 gated STED (gSTED) microscope, equipped with a white light laser and a 93x objective lens (HC PL APO CS2 93x GLYC, NA 1.30). For confocal images of mitochondria and DNA, Z-stacks in accordance with the Nyquist sampling criteria were taken by exciting the fluorophores at 488 nm and 594 nm, respectively, and Hybrid detectors collected fluorescent signals. Stimulated emission depletion of DNA channel was performed with a 775 nm depletion laser. 2D confocal and gSTED images were acquired sequentially with the optical zoom set to obtain a voxel size of 17 x 17 nm. Excitation was provided at 594 nm and Hybrid detectors collected signal. Gating between 0.3–6 ns was applied. Images were deconvolved with the Huygens software. Performance of the microscope and optimal depletion laser power were tested as previously described [ 65 ].
Image analysis
Image analysis of CoxI mRNA and BrU-labeled RNA in MEFs
Analysis of Cox1 mRNA and BrU-labeled
RNA in MEFs was performed in ImageJ. For quantification of Cox1 mRNA and the BrU-labeled RNA per cell, a ROI corresponding to the cell boundaries was drawn, and the DAPI channel was used to exclude the nuclear region prior to analysis. Integrated density of the signal coming from the Cox1 mRNA channel or the BrU channel was then quantified and normalized over the cytoplasmic area. For quantification of nucleoids positive for Cox1 mRNA or BrU-labeled RNA, dual color pictures of DNA, Cox1 mRNA, and BrU channels were generated in ImageJ. Nucleoids were then classified based on the presence or absence of Cox1 mRNA foci or BrU foci in their proximity and quantified using the Cell Counter plug-in from ImageJ.
Image analysis of nucleoid and SSBP1 abundance in MEFs
The amount mtDNA foci per cell was determined using stacked confocal images acquired and analyzed using ImageJ. Prior to analysis, the DAPI channel was used to manually trace nuclear DNA with the polygon section tool, a region of interest (ROI) selected, and this same area omitted from the anti-DNA channel to quantify only mtDNA foci for each cell. The find maxima tool was used to count mtDNA and SSBP1 foci with noise tolerance manually determined between 50–60. To determine the relative abundance of mtDNA foci relative to TOM20 surface area, binary images were generated from stacked confocal images. A ROI encompassing the mitochondrial network, as visualized by immunostaining for TOM20, was selected for each cell and the analyze particles tool was used to determine the total surface area. The same ROI was then applied to the anti-DNA image with an omitted nuclear DNA area to determine the total number of mtDNA particles. Line scan analysis of SSBP1-mtDNA in MEFs A line scan analysis of SSBP1 was performed on stacked confocal images acquired and analyzed using ImageJ. Using merged images of SSBP1, mtDNA, and HSP60, a line segment was drawn larger than the diameter of the SSBP1 foci, the RGB profiler plugin applied, and spectra plots analyzed. SSBP1 spectra plots were categorized into three groups; no overlap with mtDNA (separated), partial overlap with mtDNA, and full overlap with mtDNA.
Image processing
Image panels were assembled with Photoshop (Adobe); no digital manipulation was applied except for unbiased adjustment of brightness and contrast.
Quantification and statistical analysis
Data are presented as mean ± SEM unless otherwise indicated in figure legends. Sample number (n) indicates the number of independent biological samples (individual mice, number of cells, or wells of cells) in each experiment. Sample numbers and experimental repeats are indicated in the figures. Data were analyzed in Graphpad Prism using the unpaired Student’s t-test, one-way ANOVA using Turkey’s multiple comparison test, two-way ANOVA using Bonferroni multiple comparison test between group comparison, as appropriate. A p-value ≤ 0.05 was considered statistically significant.
Supporting information S1 Fig Genetic and functional characterization, related to Fig 1 . (A) Genotype distribution of progeny born from seven intercrosses (n = 52) between Mfn1 loxP/ loxP , Mfn2 loxP/ loxP females and Mfn1 loxP/ loxP , Mfn2 loxP/+ , Ckmm- Cre +/- males. (B) RT-PCR quantification of transcripts in heart from control (n = 4) and dMfn KO (n = 5) animals at 4 weeks of age. Normalization to beta-2-microglobulin. (C) Assessment of cellular respiration from control (n = 5), dMfn KO (n = 6), Opa1 KO (n = 6) MEFs. Cells were grown in glucose medium with 1% dialyzed FBS (dFBS) for 5–6 days, permeabilized and mitochondrial respiration was assessed under phosphorylating (ST3), non-phosphorylating (ST4), and uncoupled (UC) conditions using complex II substrates. (D) Growth curves of control, dMfn KO, and Opa1 KO MEFs grown in DMEM medium with galactose. For all genotypes three independent experiments, each with three technical replicates, were performed. For all, error bars indicate ± SEM. (B) Student T-test; ***, P < 0.001. For (C) and (D), two-way ANOVA using Bonferroni multiple comparison test was used; ***, P < 0.001. (TIF) Click here for additional data file. S2 Fig Characterization of nucleoid distribution, related to Fig 3 . (A) Quantification of nucleoids per cell in control and dMfn KO MEFs. Total nucleoids were counted from stacked confocal images decorated with anti-DNA antibodies. In total, 3 independent experiments were performed for each genotype and 9–11 cells measured per experiment. (B) Quantification of nucleoids (mtDNA foci) per mitochondrial surface area (TOM20) in control and dMfn KO MEFs. Total mtDNA foci and the mitochondrial surface area were determined from stacked confocal images. In total, 3 independent experiments were performed for each genotype and 9–11 cells measured per experiment. For A and B, Error bars indicate ± SEM. Student T-test; ***, P < 0.001. (C) Representative images of control and dMfn KO MEFs labeled with anti-DNA antibodies and imaged by confocal and STED microscopy. Scale bar is 1 μm. (D) Quantification of the average nucleoid diameters in confocal and STED acquired images after labeling with anti-DNA antibodies in control, Mfn1 KO, Mfn2 KO, dMfn KO, Opa1 KO MEFs. The nucleoid diameters were measured at full width at half maximum on 100 nucleoids from each genotype. (E) Quantification of the ratio between the nucleoid diameters observed by confocal and STED images acquired after anti-DNA labeling in control, Mfn1 KO, Mfn2 KO, dMfn KO, and Opa1 KO MEFs, n = 12 for all genotypes. Errors bars indicate the standard error of the mean. For (D and E), one-way ANOVA using Turkey’s multiple comparison test; *, P < 0.05; ***, P < 0.001. (TIF) Click here for additional data file. S3 Fig Abundance of mitochondrial transcripts, 7S RNA and 7S DNA, related to Fig 5 . (A) Northern blot analysis of mitochondrial transcripts from the heavy and light strand promoter (HSP and LSP) of control and dMfn heart KO animals at 5 weeks of age (n = 4 for each genotype). Mterf4 and Polrmt heart knockouts were included as controls for increase and decrease of mtDNA transcription. (B) Quantification of 7S RNA abundance relative to nuclear DNA (18S) as determined by northern blot analysis, related to (A), n = 4 for each genotype. (C) Southern blot quantification of relative 7S DNA levels in heart mitochondria from controls and dMfn KO mice, n = 4 for both genotypes. (D) Quantitative PCR analysis of 7S DNA levels relative to mtDNA levels (ATP6) in heart tissue from control (n = 3) and dMfn KO (n = 3) at 3 weeks of age; control (n = 4) and Mgme1 KO (n = 4) at 11 weeks of age; and control (n = 4) and Polrmt KO (n = 4) animals at 4 weeks of age. Error bars indicate ± SEM. For all Student T-test; *, P < 0.05; ***, P < 0.001; n.s, no significant difference. (TIF) Click here for additional data file. S4 Fig Abundance of cellular dNTP pools in MEFs, related to Fig 6 . (A) Quantification of cellular dNTPs by UPLC-MS from control (n = 10) and dMfn KO (n = 11), Opa1 KO (n = 12) MEFs, control MEFs without hydroxyurea treatment (-HU, n = 3), and control MEFs treated with for 30 hours with hydroxyurea (+HU, n = 3) MEFs. A two-way ANOVA using Bonferroni multiple comparison test was performed and no statistical difference was observed between genotypes and deoxynucleotides. (TIF) Click here for additional data file.
📊 Figures
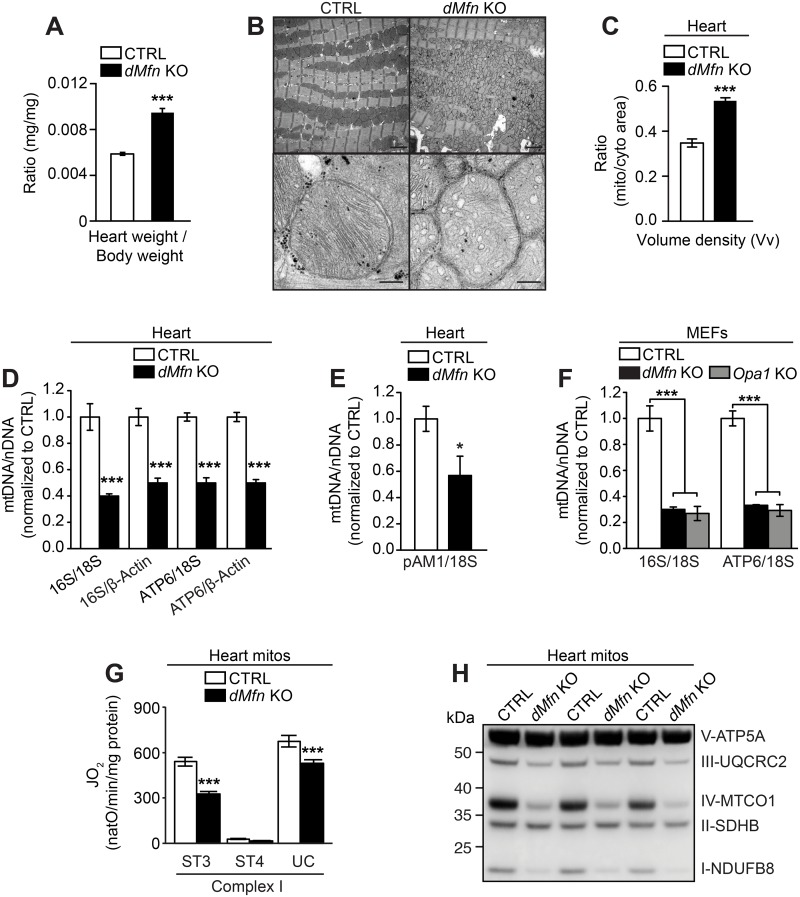
Fig 1
Loss of outer membrane fusion results in mtDNA depletion and OXPHOS dysfunction.
(A) Heart weight to body weight ratio of male and female control (n = 19) and dMfn KO (n = 13) mice at 5 weeks of age. (B) Representative images of fixed heart tissue from control and dMfn KO animals ...
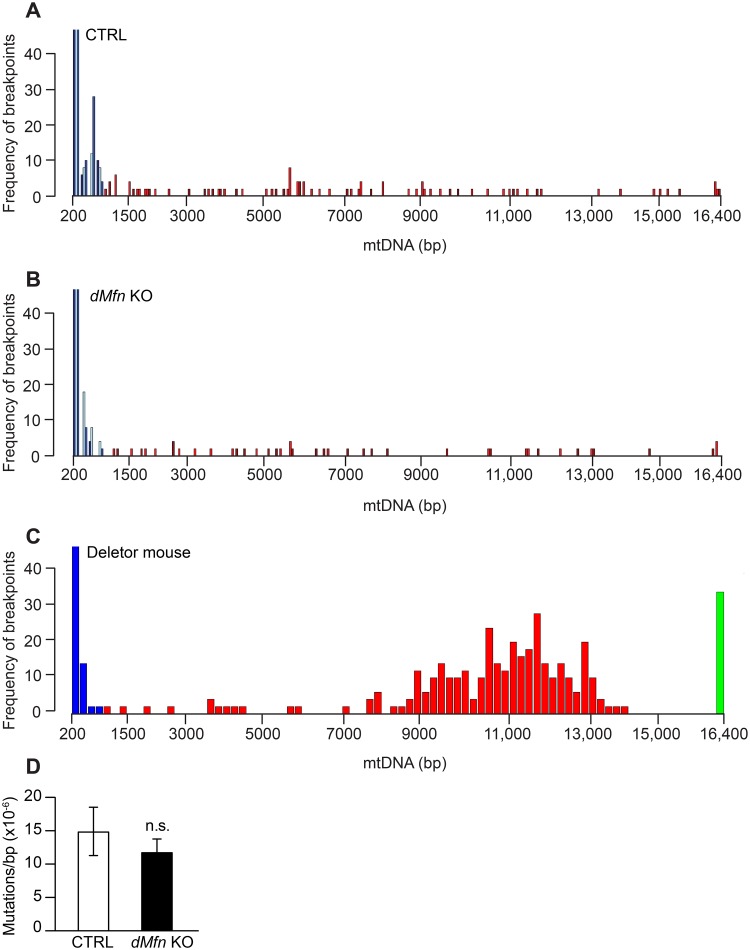
Fig 2
Integrity of mtDNA is unaffected upon loss of mitochondrial fusion.
Analysis of mitochondrial DNA rearrangement frequency from hearts of control (A), dMfn KO (B), and Deletor (C) animals at 5 weeks of age as determined by Illumina sequencing (control n = 3; dMfn KO n ...
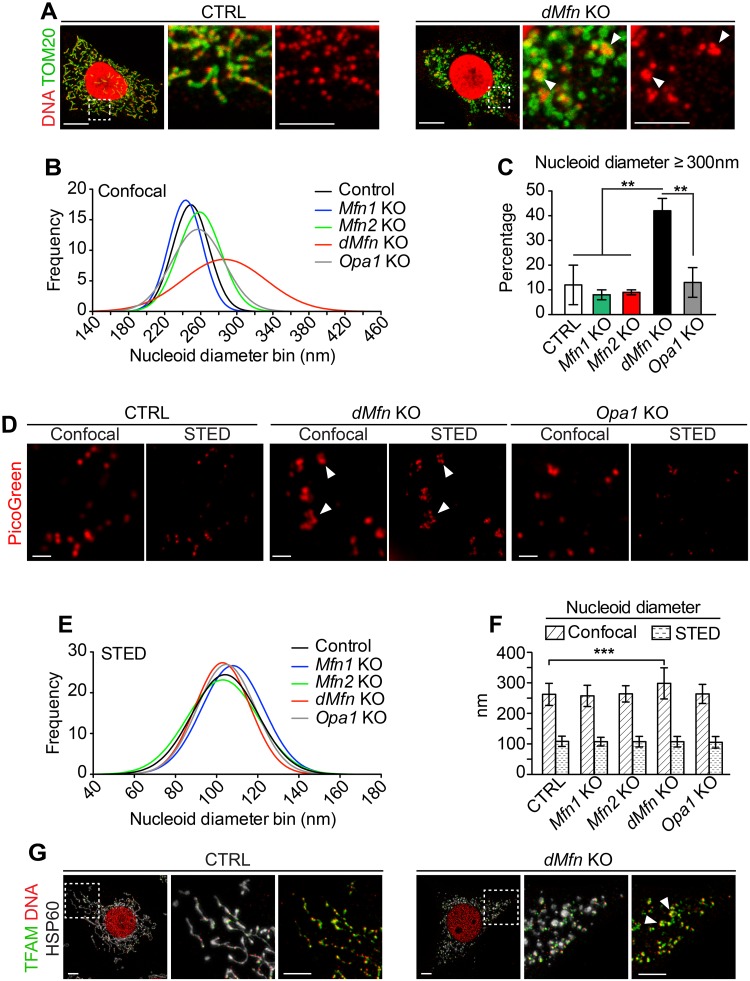
Fig 3
Loss of outer membrane fusion results in mitochondrial nucleoid clustering.
(A) Confocal microscopy images of control and dMfn KO MEFs immunostained to detect TOM20 protein or DNA. Dashed boxes specify the areas of magnification shown in the panels to the right. Scale bars, m...
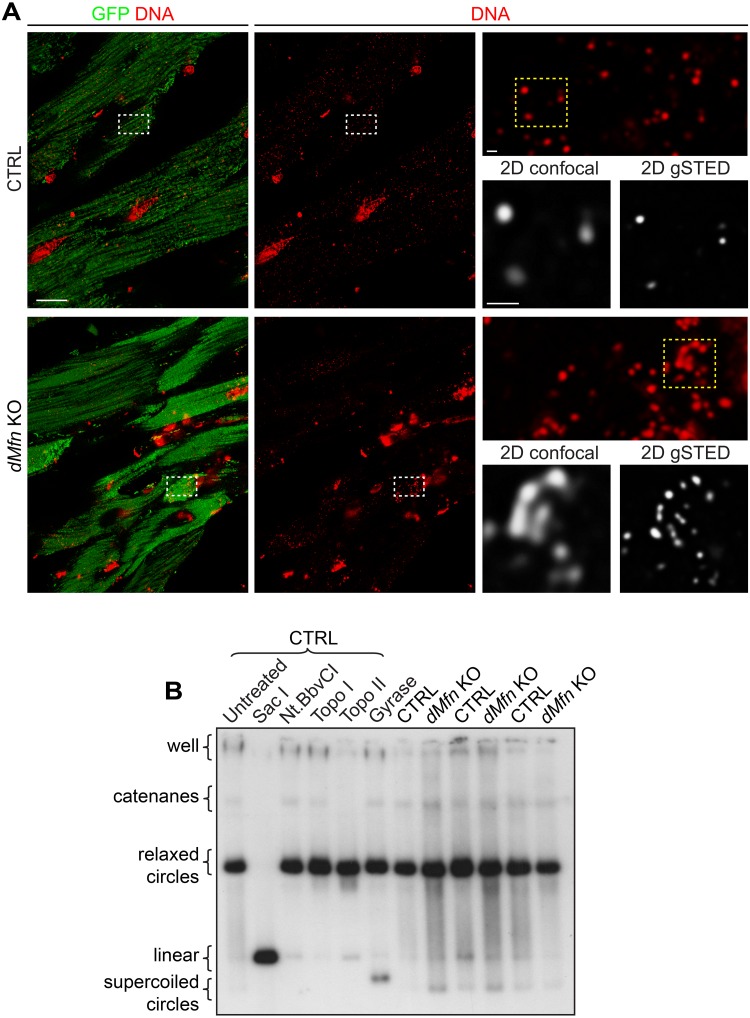
Fig 4
Loss of outer membrane fusion does not affect mtDNA topology.
(A) Representative deconvoluted confocal and STED images of mtDNA from heart sections of control and dMfn KO animals at 4 weeks of age. Tissue samples were stained with anti-GFP and anti-DNA antibodie...
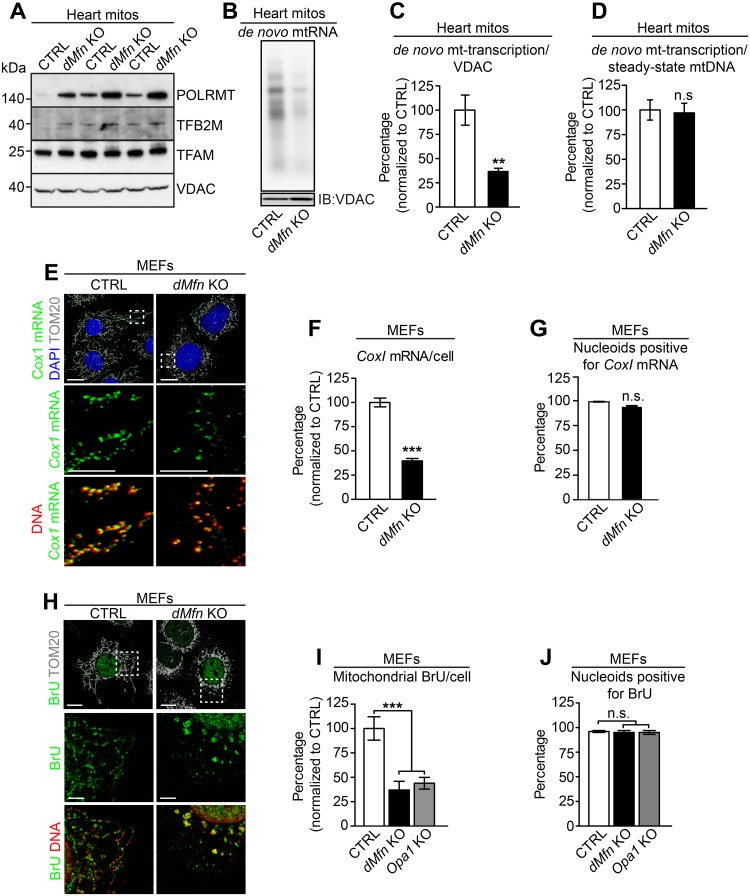
Fig 5
Loss of mitochondrial fusion does not affect mtDNA transcription.
(A) Western blot analysis of steady-state levels of proteins essential for mitochondrial transcription in heart mitochondria from control and dMfn heart KO animals at 5u20136 weeks of age (n = 3 for e...
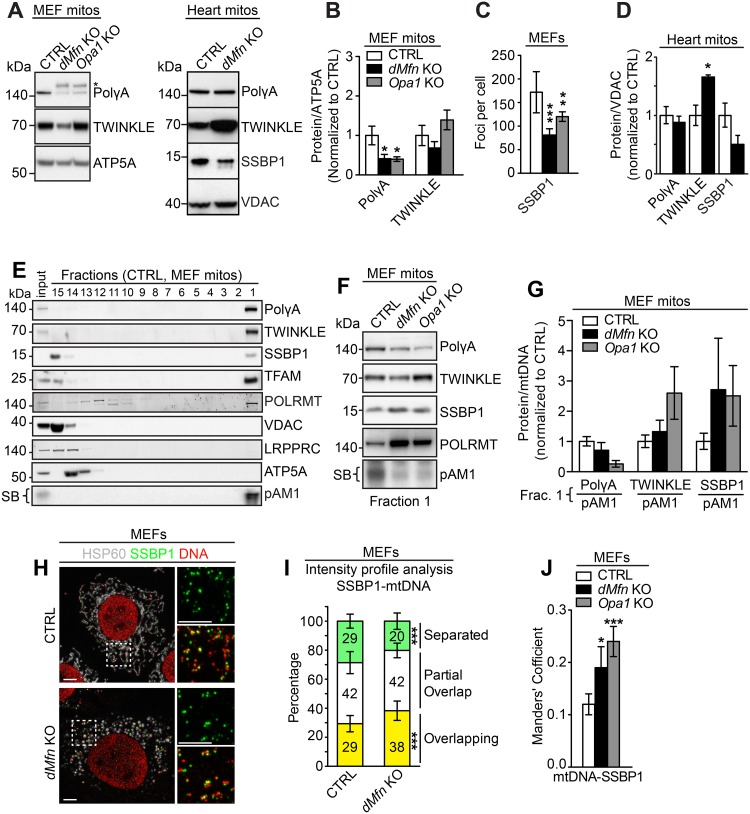
Fig 6
Loss of mitochondrial fusion affects replisome composition.
(A) Left, representative western blot showing the steady-state levels of mitochondrial replication proteins from isolated MEF mitochondria from control, dMfn KO, Opa1 KO MEFs. Right, representative we...
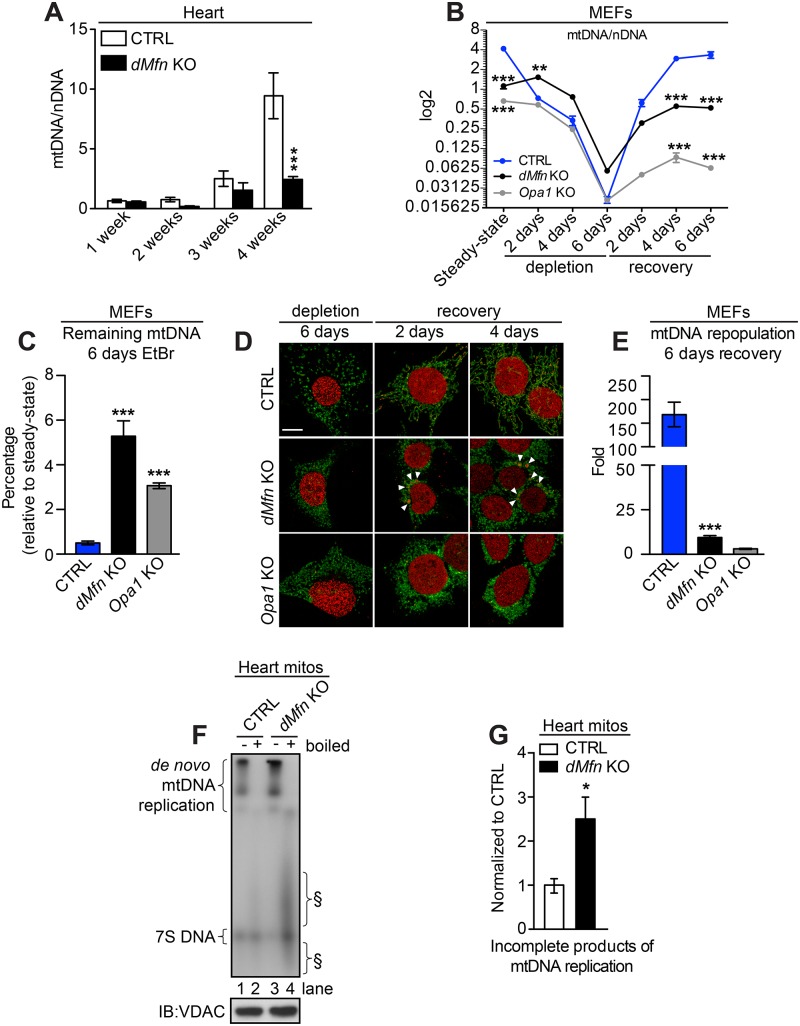
Fig 7
Loss of mitochondrial fusion impairs mtDNA replication.
(A) Quantitative PCR analysis of mtDNA copy number (ATP6) normalized to nuclear DNA (18S) in heart samples from control and dMfn KO between 1u20134 weeks of age (n = 3u201310 per genotype). (B) Quanti...
Figure images are served from the NIH/NLM PubMed Central Open Access Subset or Europe PMC; copyright remains with the publishers and authors.
💬 Discussion
0 commentsNo comments yet. Be the first to start a discussion!
Leave a Comment