Abstract
Mitochondria are dynamic organelles that undergo constant remodeling through the regulation of two opposing processes, mitochondrial fission and fusion. Although several key regulators and physiological stimuli have been identified to control mitochondrial fission and fusion, the role of mitochondrial morphology in the two processes remains to be determined. To address this knowledge gap, we investigated whether morphological features extracted from time-lapse live-cell images of mitochondria could be used to predict mitochondrial fate. That is, we asked if we could predict whether a mitochondrion is likely to participate in a fission or fusion event based on its current shape and local environment. Using live-cell microscopy, image analysis software, and supervised machine learning, we characterized mitochondrial dynamics with single-organelle resolution to identify features of mitochondria that are predictive of fission and fusion events. A random forest (RF) model was trained to correctly classify mitochondria poised for either fission or fusion based on a series of morphological and positional features for each organelle. Of the features we evaluated, mitochondrial perimeter positively correlated with mitochondria about to undergo a fission event. Similarly mitochondrial solidity (compact shape) positively correlated with mitochondria about to undergo a fusion event. Our results indicate that fission and fusion are positively correlated with mitochondrial morphological features; and therefore, mitochondrial fission and fusion may be influenced by the mechanical properties of mitochondrial membranes.
🔬 Techniques
🔭 Microscopes
💻 Software
✨ Fluorophores
🧪 Sample Preparation
🔬 Cell Lines
🏭 Microscope Brands
🧪 Reagent Suppliers
💻 Software Details
🏛️ Research Organizations (ROR)
Affiliated research institutions:
📋 Methods
Live Cell Fluorescent Microscopy of Mitochondrial Dynamics
Monoclonal populations of U2OS cells
(ATCC) expressing mito_EYFP were generated following serial dilutions of U2OS cells stably expressing mito_EYFP. McCoy’s 5A media was supplemented with 500 µM G418, 48 hours following transfection, and clonal population were isolated. A medium expressing clone (U2OS_mitoEYFP) was selected for live cell analysis. U2OS_mitoEYFP cells were seeded at a density of 7.5×10 4 cells on number 1.5 coverglass, 35 mm glass bottom culture dishes (MatTek) 72 hours prior to imaging. Mitochondrial morphology was altered through targeted knockdown of mitochondrial fusion regulator OPA1. All movies were started 48 hrs after knockdown. Live cell experiments were performed in a live cell chamber, maintaining a humid environment at 37°C and 5% CO 2 , which surrounded the microscope stage of a Nikon Ti Eclipse fluorescent microscope. Imaging of U2OS_mitoEYFP was performed in the FITC channel (25% lamp power, 100 ms exposure, ND4 and ND8 filters in the light path) using a 60x oil immersion objective. DIC images (40 ms exposure) were taken simultaneously with FITC images when the outline of the cell was required for later imaging processing and quantification. For single cell tracking, NIS Elements software (Nikon) was used to image several positions for each acquisition. Polyclonal populations of U2OS cells expressing mito_PAGFP (U2OS_PAGFP) were generated following selection with 500 µM G418 for 72 hours following transfection. Medium expressing clones were selected for live cell analysis. U2OS_PAGFP cells were seeded at a density of 75,000 cells on umber 1.5 coverglass, 35 mm glass bottom culture dishes (MatTek) 48 hours prior to imaging. Prior to imaging, cells were treated with 15 nM Mitotracker Red CMXRos (Life Technologies) for 20 minutes. Mitotracker containing media was then aspirated and replaced with pre-warmed McCoy’s 5A +10% FBS for at least 1 hour before imaging to reduce background fluorescence. Live cell experiments were performed in a live cell chamber, maintaining a humid environment at 37°C and 5% CO 2 , which sat in the microscope stage of a Nikon A1 confocal microscope. Prior to photoactivation, a single ROI was drawn around mitochondria to be activated. Next, live cell images were captured every 10 seconds for 5 minutes (the length of time it took to capture one frame in both the FITC and TxRED channel) to track dynamics between activated mitochondria and the surrounding non-activated mitochondria.
Show full methods section
Live Cell Fluorescent Microscopy of Mitochondrial Dynamics
Monoclonal populations of U2OS cells
(ATCC) expressing mito_EYFP were generated following serial dilutions of U2OS cells stably expressing mito_EYFP. McCoy’s 5A media was supplemented with 500 µM G418, 48 hours following transfection, and clonal population were isolated. A medium expressing clone (U2OS_mitoEYFP) was selected for live cell analysis. U2OS_mitoEYFP cells were seeded at a density of 7.5×10 4 cells on number 1.5 coverglass, 35 mm glass bottom culture dishes (MatTek) 72 hours prior to imaging. Mitochondrial morphology was altered through targeted knockdown of mitochondrial fusion regulator OPA1. All movies were started 48 hrs after knockdown. Live cell experiments were performed in a live cell chamber, maintaining a humid environment at 37°C and 5% CO 2 , which surrounded the microscope stage of a Nikon Ti Eclipse fluorescent microscope. Imaging of U2OS_mitoEYFP was performed in the FITC channel (25% lamp power, 100 ms exposure, ND4 and ND8 filters in the light path) using a 60x oil immersion objective. DIC images (40 ms exposure) were taken simultaneously with FITC images when the outline of the cell was required for later imaging processing and quantification. For single cell tracking, NIS Elements software (Nikon) was used to image several positions for each acquisition. Polyclonal populations of U2OS cells expressing mito_PAGFP (U2OS_PAGFP) were generated following selection with 500 µM G418 for 72 hours following transfection. Medium expressing clones were selected for live cell analysis. U2OS_PAGFP cells were seeded at a density of 75,000 cells on umber 1.5 coverglass, 35 mm glass bottom culture dishes (MatTek) 48 hours prior to imaging. Prior to imaging, cells were treated with 15 nM Mitotracker Red CMXRos (Life Technologies) for 20 minutes. Mitotracker containing media was then aspirated and replaced with pre-warmed McCoy’s 5A +10% FBS for at least 1 hour before imaging to reduce background fluorescence. Live cell experiments were performed in a live cell chamber, maintaining a humid environment at 37°C and 5% CO 2 , which sat in the microscope stage of a Nikon A1 confocal microscope. Prior to photoactivation, a single ROI was drawn around mitochondria to be activated. Next, live cell images were captured every 10 seconds for 5 minutes (the length of time it took to capture one frame in both the FITC and TxRED channel) to track dynamics between activated mitochondria and the surrounding non-activated mitochondria.
Image Processing and Mitochondrial Quantification
Image processing and quantification was completed with NIS Elements (Nikon). Images were deconvoluted using a 2D Fast Deconvolution function with the following settings; specimen thickness: thick , image noise level: noisy , contrast enhancement: strong . Following deconvolution, a top hat morphological transformation was performed by processing on intensity using a 3×3 pixel matrix (counts: 5). Regions of interest (ROI) were drawn around the mitochondrial containing area of the cell allowing for single cell analysis. The intensity profile for each ROI was imported into the statistical program, R, [32] for determination of intensity threshold limits to be used for detection and measurement of mitochondria. Transformation (square root transformation) of the intensity profile for each ROI revealed an intensity distribution containing a consistent shoulder located on the right-hand side of the distribution ( Figure 2B ). Treating the distribution as one made up of two empirical distributions (labeled Distributions 1 and 2), we calculated the location of the junction between the two distributions to serve as the lower threshold limit for the image. Using R we computed the intensity value at the junction between distributions 1 and 2 by assuming a normal distribution for Distribution 1 [32] . The mean for Distribution 1 was calculated by determining the mode of the entire intensity profile. The lower threshold limit was set to the value 3 standard deviations from the mean thus excluding all pixels of intensities within the “first” distribution. Each ROI was binarized by applying a threshold that recognized all pixels of intensity above the lower threshold limit (located in Distribution 2) calculated by the ROI intensity profile (additional thresholding filters were set as follows: clean: 2x, separate: 3x). Objects selected by the threshold were quantified using an automated object count function that computed the number of objects along with measurements of length, width and circularity for objects identified.
Determination of Fission and Fusion Events
Time series were processed to exclude mitochondria in the perinuclear region by focusing on small snapshots (22 µm×22 µm) of the periphery of five cells. The grayscale fluorescence intensity of mitochondria within these areas was thresholded to define the outline of a mitochondrion used for further analysis. Although certain fission and fusion events are evident by inspection, we designed an automatic procedure to make an unbiased determination of whether a mitochondrion underwent a fission event, fusion event, or neither. A reference image (Frame 1) was chosen and compared with the subsequent image (Frame 2) in time (i.e., the next frame in the time series of images). A relationship between a mitochondrial region in Frame 1 and a mitochondrial region in Frame 2 was recorded if at least one of two conditions was obtained: (1) the number of pixels from a region in Frame 2 contained in a region in Frame 1 was a maximum over all regions in Frame 1, or (2) the number of pixels from a region in Frame 1 contained in a region in Frame 2 was a maximum over all regions in the subsequent image. Drift was minimal and could be neglected. A score for each region j in Frame 2 was given by where is the set of regions in the previous image having a relationship with region j, and indicates the number of regions in the set. A score for each region i in Frame 1 was calculated using Where is the set of regions in Frame 2 that has a relationship with region i. For each region in Frame 1, if , then region i was labeled as a region to undergo a subsequent fusion event, if , then region i was labeled as a region to undergo a subsequent fission event. If , then region i was labeled as stable, meaning that it will undergo no fission or fusion event in the subsequent frame. As a consistency check, we performed the same computation for each region preliminarily labeled to undergo a fission or fusion event in the Frame 1 by comparing it with the image two frames (Frame 3) ahead: If for a given region i in Frame 1, both and , then a fusion event was determined to have taken place following the acquisition of Frame 1, and region i was considered to have undergone a fusion event in Frame 2. Similarly, if both and , then a fission event was determined to have taken place following the acquisition of Frame 1, and region i was considered to have undergone a fission event in Frame 2. This calculation was repeated for each image in the dataset. Morphological Characterization of Mitochondria Each region classified to undergo a fission or fusion event was scored according to six morphological features (area, extent, solidity, perimeter, eccentricity, and Euler number) using the regionprops function in MATLAB (The Mathworks, Natick, MA). Area denotes the 2D area (in µm 2 ) projected to the focal plane of the image. Extent indicates the fraction of pixels in the smallest rectangle completely containing the 2D projection of the mitochondrion which are also contained in the mitochondrion itself. Solidity is a similar measure using instead the fraction of pixels in the smallest convex polygon containing the projection of the mitochondrion. Perimeter indicates the sum of edge pixels of the mitochondrial region multiplied by the length in microns of each pixel. Eccentricity is the eccentricity of the ellipse having the same second moments as the mitochondrial area. Euler number is a topological measure indicating the number of holes in the mitochondrion. We computed two additional morphological features for each region: the number of necks and the width of the smallest neck. This was accomplished by computing the pairwise distance between each pixel in the perimeter of the region, smoothing the resultant matrix with a Gaussian kernel of width 5 pixels, and finding the local minima. The number of unique pixel pairs corresponding to local minima in this matrix was the number of necks, and the value of the global minimum was the width of the smallest neck. We also computed three positional features for each mitochondrion: the distance through cytosol to its nearest neighbor, the length of surface of neighboring mitochondria within 10 µm, and the orientation of the major axis of the mitochondrion relative to the nucleus of the cell. This quantity was included based on the hypothesis that orientation of microtubules relative to mitochondrial orientation may contribute to fission propensity, where the nucleus-to-plasma-membrane radial axis was used as a proxy for microtubule orientation. Predictive Discrimination of Fission and Fusion Events We used a supervised machine learning algorithm to classify the set of mitochondria undergoing fission or fusion events into two classes, based on the 11 quantitative features measured for each mitochondrial region [33] . In other words, these features were used to train a random forest [34] classifier to predict whether a mitochondrion will fuse or fragment given that one event or the other will occur in the subsequent frame (i.e., within 5 s). Using the randomforest-matlab tool [33] , we “grew” 2,000 trees for each forest with the algorithmic parameter entry set to 3. In Figure 6B–E we set decision boundaries for each feature by training a single classification tree (the most basic unit of the random forest algorithm) [35] with only the data for a single morphological feature, fixed to a single bifurcation value. siRNA Transfection U2OS_mitoEYFP cells were seeded into a 6 well plate at a density of 7.5×10 4 cells per well in McCoy’s 5A (Invitrogen) supplemented with 10% FBS (MediaTech) and cultured at 37°C, 5% CO 2 for 24 hours before transfecting with siRNA. At least two siRNA molecules against mitochondrial fusion regulator, OPA1 were obtained from Qiagen (OPA1 1: Hs_OPA1_5, OPA1 2: Hs_OPA1_9). All results were compared to control siRNA (All-star Negative Control, Qiagen). Individual siRNA sequences were transfected per well at a final concentration of 50 nM using 3 µL oligofectamine (Invitrogen) transfection reagent per well. Analysis was performed at 48 hours post knockdown as indicated in the protocol for each specific application. Knockdown of siRNA target was confirmed via western blot using primary antibodies raised against endogenous protein levels of OPA1.
Immunoblotting
U2OS cells were lysed [in 10 mM KPO4, 1 mM EDTA, 10 mM MgCl2, 5 mM EGTA, 50 mM bis-glycerophosphate, 0.5% NP40, 0.1% Brij35, 0.1% sodium deoxycholate, 1 mM NaVO4, 5 mM NaF, 2 mM DTT and protease inhibitors (Sigma-Aldrich)] and proteins separated by SDS-PAGE. Proteins were transferred to nitrocellulose membranes and probed with an OPA1 primary antibody (BD Biosciences) overnight at 4°C followed by incubation with secondary antibodies (1 hr at room temperature, Cell Signaling). Visualization of proteins was accomplished via enhanced chemiluminescence.
Immunofluorescence
For co-localization experiments, U2OS mito_EYFP cells were fixed in 4% methanol free formaldehyde in 1x PBS and were permeabilized with 0.2% triton x-100 in PBS. Following permeabilization, cells were blocked in blocking buffer composed of 3% bovine serum albumin (BSA) +4% goat serum in PBS. AIF, Tom20 and Alexa Fluor 555 conjugated cytochrome c, (Cell Signaling Technology – cat# 4642, BD Biosciences -cat# 612278, BD Biosciences - cat #558700, respectively) were diluted 1∶200 in blocking buffer and incubated overnight at 4°C. Alexa 555 anti-mouse or rabbit was diluted 1∶1000 in PBS for Tom20 and AIF samples respectively and incubated for 1 hour at room temperature. Nuclei were stained with Hoechst 33342 (Live Technologies) diluted in PBS to a final concentration of 2 µg/ml and incubated on cells for 15 minutes, room temperature. Images were acquired immediately afterward (mito_EYFP retention in the mitochondria diminishes overtime following fixation) with a Nikon A1 confocal microscope using a 60x oil-immersion objective (NA 1.45). For membrane potential experiments, U2OS cells were seeded at a density of 15,000 cells per well in McCoy’s 5A media on number 1.5 coverglass in a 24 well tissue culture plate.
Labeling of mitochondria with Mitotracker Red CMXros
(Life technologies) was performed just prior to fixation of cells by incubating cells in 15 nM Mitotracker containing media for 20 minutes, followed by a 60 minute incubation with fresh, pre-warmed McCoy’s 5A. Cells were fixed, permeabilized, and blocked as described above. Coverglass slides were incubated in Oregon green phalloidin (Life Technologies) diluted 1∶200 in blocking buffer for 1 hour at room temperature to stain cellular actin. Nuclei were stained as described above. The coverglass pieces were inverted onto a microscope slide using Fluorogel mounting gel (Electron Microscopy Sciences) and imaged using a 60x oil-immersion objective (NA 1.4) on a Nikon Eclipse Ti fluorescent microscope.
Seahorse Metabolic Analyzer Assays
U2OS cells passaged in McCoy’s 5A medium +10% FBS were transfected were seeded into a 6 well dish at 7.5×10 4 cells/well. RNAi transfections were performed as described previously for 24 hours before transferring cells to a 96 well XF96 plate (Seahorse Biosciences) at a cell density of 5×10 4 cells/well and allowed to incubate for 24 hours (experiment to begin at 48 hours post knockdown). Cartridge plates for metabolic stress injections were hydrated for at least 24 hours at 37°C with no CO 2 prior to the assay with calibrant solution (Seahorse Biosciences). One hour prior to running the seahorse assay, the XF96 plate’s running medium was removed and replaced with Seahorse Assay Medium (final volume 225 µl per well). Measurement of mitochondrial respiration was performed using the Seahorse XF96 analyzer under four different conditions; (1) basal, (2) 1 µM oligomycin, (3) 1 µM FCCP, (4) 1 µM rotenone and antimycin. Assay conditions and set up were performed according to instructions described by Seahorse Biosciences [36] .
Supporting Information Figure S1 Mito_EYFP localizes to mitochondria. Confocal images of U2OS_mitoEYFP cells were taken following dual labeling with fluorescent antibodies against endogenous mitochondrial localized proteins; AIF, Tom20, and Cytochrome C. Pearson’s coefficient was calculated to determine the level of overlap in staining for mito_EYFP and endogenous mitochondrial markers; AIF –0.95, Tom20-0.94, and Cytochrome C –0.92. (TIF) Click here for additional data file. Figure S2 Loss of Membrane Potential Associates with Mitochondrial Fission. Time-lapse images of U2OS_mitoEYGP stained with the membrane potential dependent dye, MitoTracker Red CMXros were used to track mitochondria that have lost membrane potential. The white arrows mark a mitochondrion that loses membrane potential (loss of red intensity) and undergoes subsequent mitochondrial fission. (TIF) Click here for additional data file. Figure S3 Confirmation of fusion events with photoactivatable GFP localized to the mitochondria. (A) Time lapse images of U2OS stably expressing photoactivatable GFP (green) construct (PA_GFP) and stained with MitoTracker Red CMXRos (red) prior to imaging. An image of the mitochondria within the cell was captured (time = 0 sec) just before photoactivation. Mitochondria were tracked for 5 minutes (frames every ten seconds) to track in real time mitochondrial fusion events that were detected first in the red channel and later confirmed in the green. A white arrow marks a fusion event. (B) An additional example of a photoactivated fusion event. (TIF) Click here for additional data file. Figure S4 Mitochondrial dynamics of individual mitochondria prior to fission or fusion event. Mitochondria identified to undergo a 1–2 fission (blue) or 2-1 fusion (red) event were tracked for 8 frames prior to the dynamic event (1 time frame −5 s) to monitor changes in mitochondrial perimeter or solidity. (A) Traces represent the tracked mean change in perimeter normalized to the perimeter of the mitochondria just prior to the fission (blue) or fusion (red) event. Shaded areas represent standard error. Normalized perimeter was calculated by determining the ratio of the perimeter of mitochondria by the perimeter of the mitochondria just prior to the dynamic event (Perimeter 0 ) (B) Traces represent the tracked mean change in solidity normalized to the solidity of the mitochondria just prior to the fission (blue) or fusion (red) event. Shaded areas represent standard error. Normalized solidity was calculated by determining the ratio of the solidity of mitochondria by the solidity of the mitochondria just prior to the dynamic event (Solidity 0 ). (TIF) Click here for additional data file.
📊 Figures
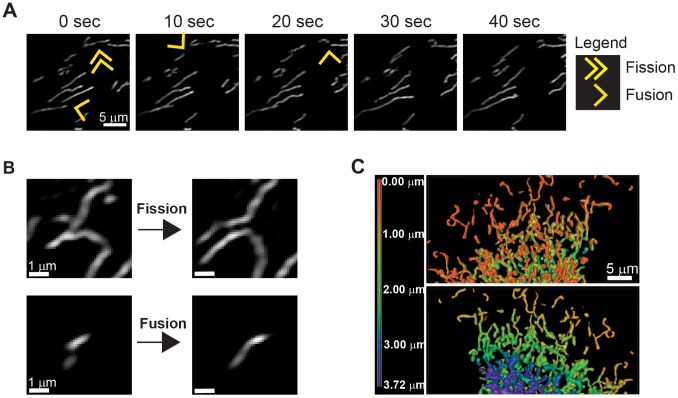
Figure 1
Mitochondrial reticulum undergoes constant morphological remodeling.
(A) Time-lapse images of U2OS cells stably expressing mito_EYFP demonstrate fission and fusion events in real time. Double arrows highlight a mitochondrion about to undergo a mitochondrial fission eve...
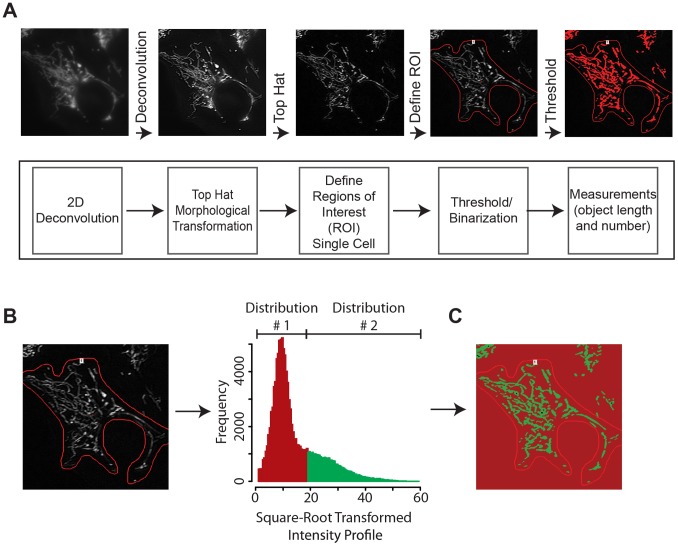
Figure 2
Quantification design for tracking mitochondrial morphology dynamics using mito_EYFP.
(A) Quantification schematic used to process images for analysis. Mitochondria were imaged in U2OS_mitoEYFP cells by fluorescent microscopy and were subjected to image processing that involved 2D deco...
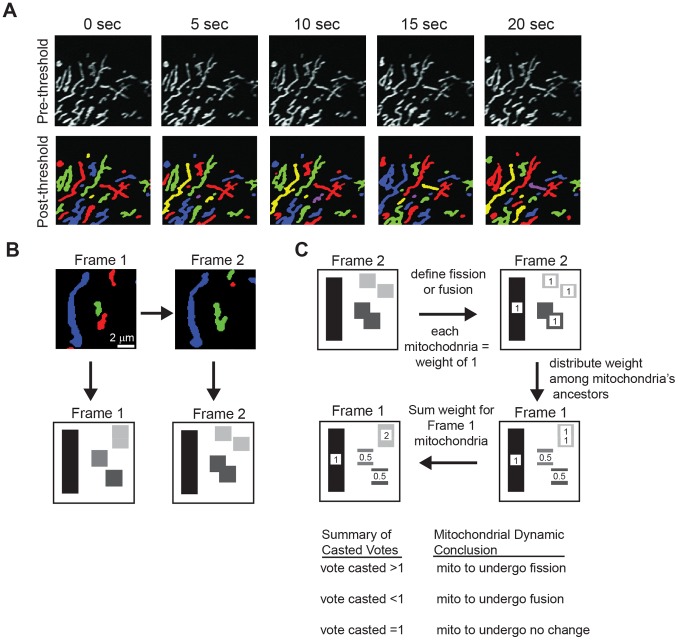
Figure 3
Quantitative characterization of mitochondrial fission and fusion events.
(A) Thresholded images following the schematic described in Figure 2 segregates individual mitochondria to be tracked for identification of fission or fusion events. (B) Mitochondria in Frame 1 and 2 ...
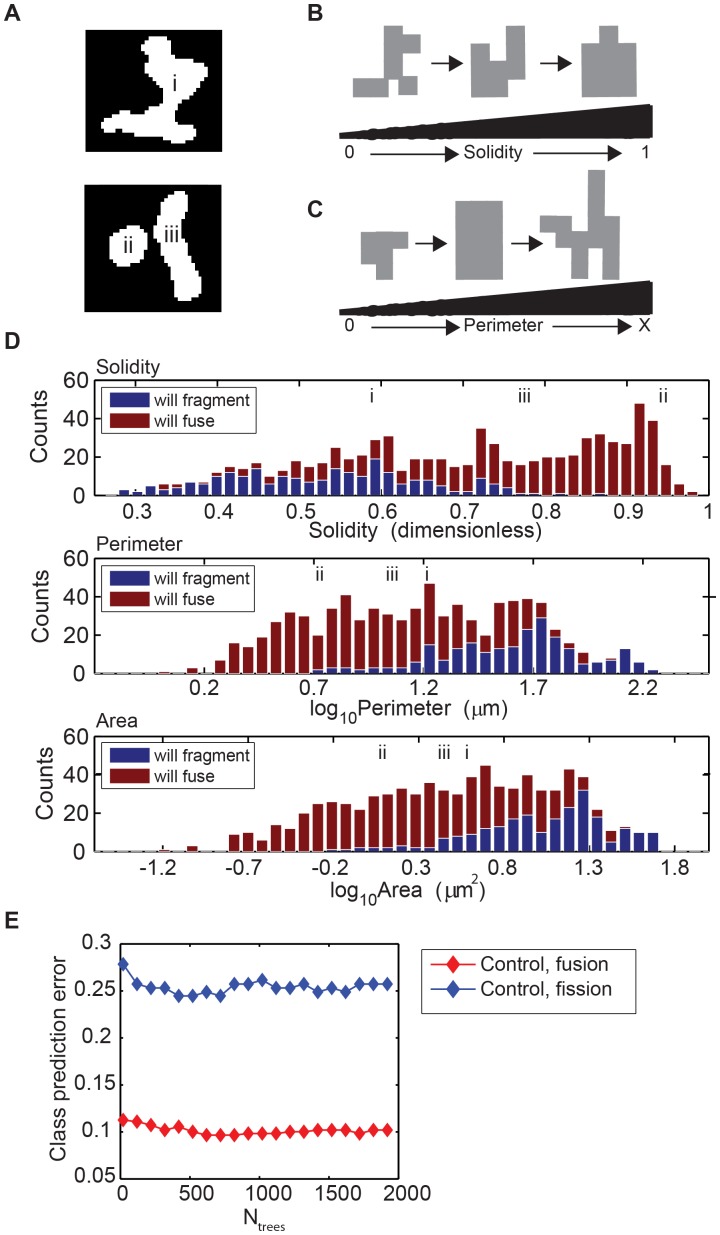
Figure 4
Mitochondrial features, solidity, perimeter, and area, segregate mitochondria classified to fragment or fuse.
(A) Thresholded mitochondria annotated iu2013iii represent three examples of mitochondria identified to undergo a fission or fusion event in the subsequent frame and will be used in panel B to provide...
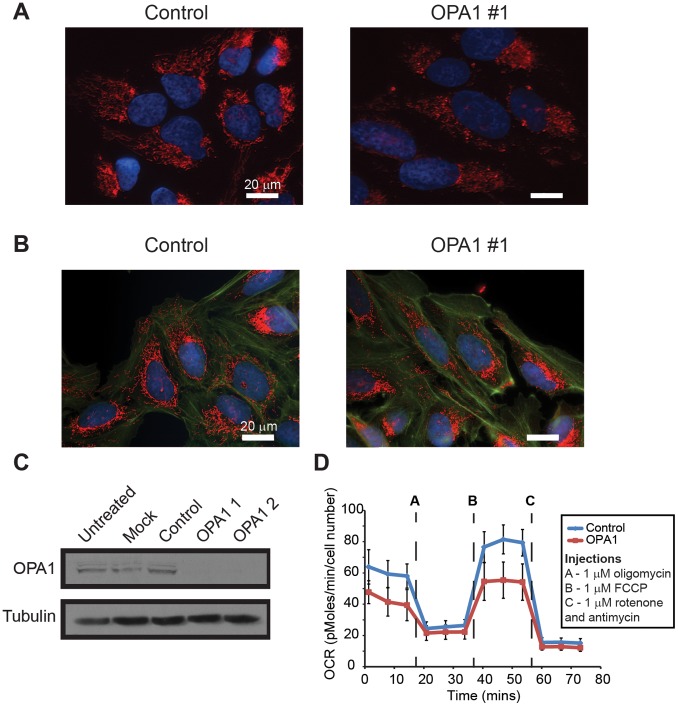
Figure 5
Characterization of mitochondrial health and function.
(A) Immunofluorescent images of U2OS cells following targeted knockdown of OPA1 compared to control for 48 hours. Cells were labeled with MitoTracker Red CMXros (mitochondria, red), Phalloidin (actin,...
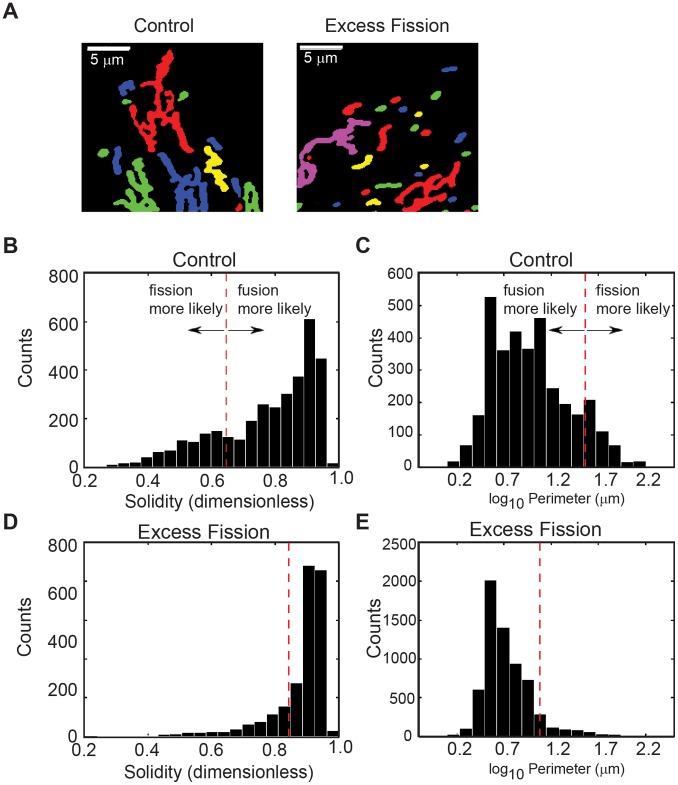
Figure 6
Morphological characterization of mitochondria from fission mutants.
(A) Thresholded mitochondria in U2OS_mitoEYFP cells following 48 hour knockdown with control or OPA1 specific siRNA. (Bu2013E) Probability distribution of solidity and perimeter measurements for all m...
Figure images are served from the NIH/NLM PubMed Central Open Access Subset or Europe PMC; copyright remains with the publishers and authors.
💬 Discussion
0 commentsNo comments yet. Be the first to start a discussion!
Leave a Comment