Abstract
AbstractSuper-resolution microscopy allows biological systems to be studied at the nanoscale, but has been restricted to providing only positional information. Here, we show that it is possible to perform multi-dimensional super-resolution imaging to determine both the position and the environmental properties of single-molecule fluorescent emitters. The method presented here exploits the solvatochromic and fluorogenic properties of nile red to extract both the emission spectrum and the position of each dye molecule simultaneously enabling mapping of the hydrophobicity of biological structures. We validated this by studying synthetic lipid vesicles of known composition. We then applied both to super-resolve the hydrophobicity of amyloid aggregates implicated in neurodegenerative diseases, and the hydrophobic changes in mammalian cell membranes. Our technique is easily implemented by inserting a transmission diffraction grating into the optical path of a localization-based super-resolution microscope, enabling all the information to be extracted simultaneously from a single image plane.
🔬 Techniques
🔭 Microscopes
💻 Software
✨ Fluorophores
🧪 Sample Preparation
🔬 Cell Lines
🏭 Microscope Brands
🧪 Reagent Suppliers
📷 Detectors
🔎 Objectives
🎨 Filters
💻 Software Details
🏛️ Research Organizations (ROR)
Affiliated research institutions:
📋 Methods
Preparation of nile red
Phosphate-buffered saline (PBS, 00-3002, ThermoFisher scientific) was freshly prepared using high-purity Milli-Q water of resistivity 18 MΩ cm and filtered (0.02 μm cut-off, Whatman) and used without further pH adjustment. Nile red (NR) stock solutions were prepared by dissolving NR into dimethyl sulfoxide (DMSO, D2650 >99.7% purity) and then diluted into pre-filtered PBS buffer and used at a final concentration of 0.05 μM unless otherwise specified.
Preparation of coverslips for imaging
Glass coverslips (0.13 mm thickness, 22 × 22 mm, VWR collection, 631-0124) were cleaned using an argon plasma cleaner (PDC-002, Harrick Plasma) for 1 h, then Frame-seal slide chambers (9 × 9 mm, Bio-rad, Hercules, USA) were affixed to the glass coverslips. The chamber was filled with poly-L-lysine solution (0.01% w/v, P4707) to fully coat the cover-glass surface, incubated for at least 30 min and then washed three times with filtered PBS buffer. The slide was transferred to the microscope stage and optically coupled to the objective lens through index-matching immersion oil ( n =1.518, Olympus, UK). Preparation of lipid vesicles Dioleoylphosphatidylcholine (DOPC, Avanti Polar Lipids), dipalmitoylphosphatidylcholine (DPPC, Avanti Polar Lipids), Milk sphingomyelin (SM, Avanti Polar Lipids), Dioleoylphosphatidylserine (DOPS), or cholesterol were used to form large unilamellar vesicles (LUVs) by the extrusion method as previously described 44 . Briefly, a suspension of unilamellar vesicles in PBS (pH 7.4) was extruded (31 passages) by using an Avanti extruder (Avanti Polar Lipids) and a membrane with 0.1 μm pore size (Avanti Polar lipids). This generated monodisperse LUVs with a mean diameter centred at 0.11±0.01 μm as measured with a Malvern Zetamaster 300 (Malvern, UK). LUVs were extruded and imaged immediately. Data are representative of three experiments conducted on separate days.
Show full methods section
Preparation of nile red
Phosphate-buffered saline (PBS, 00-3002, ThermoFisher scientific) was freshly prepared using high-purity Milli-Q water of resistivity 18 MΩ cm and filtered (0.02 μm cut-off, Whatman) and used without further pH adjustment. Nile red (NR) stock solutions were prepared by dissolving NR into dimethyl sulfoxide (DMSO, D2650 >99.7% purity) and then diluted into pre-filtered PBS buffer and used at a final concentration of 0.05 μM unless otherwise specified.
Preparation of coverslips for imaging
Glass coverslips (0.13 mm thickness, 22 × 22 mm, VWR collection, 631-0124) were cleaned using an argon plasma cleaner (PDC-002, Harrick Plasma) for 1 h, then Frame-seal slide chambers (9 × 9 mm, Bio-rad, Hercules, USA) were affixed to the glass coverslips. The chamber was filled with poly-L-lysine solution (0.01% w/v, P4707) to fully coat the cover-glass surface, incubated for at least 30 min and then washed three times with filtered PBS buffer. The slide was transferred to the microscope stage and optically coupled to the objective lens through index-matching immersion oil ( n =1.518, Olympus, UK). Preparation of lipid vesicles Dioleoylphosphatidylcholine (DOPC, Avanti Polar Lipids), dipalmitoylphosphatidylcholine (DPPC, Avanti Polar Lipids), Milk sphingomyelin (SM, Avanti Polar Lipids), Dioleoylphosphatidylserine (DOPS), or cholesterol were used to form large unilamellar vesicles (LUVs) by the extrusion method as previously described 44 . Briefly, a suspension of unilamellar vesicles in PBS (pH 7.4) was extruded (31 passages) by using an Avanti extruder (Avanti Polar Lipids) and a membrane with 0.1 μm pore size (Avanti Polar lipids). This generated monodisperse LUVs with a mean diameter centred at 0.11±0.01 μm as measured with a Malvern Zetamaster 300 (Malvern, UK). LUVs were extruded and imaged immediately. Data are representative of three experiments conducted on separate days.
Protein expression and purification
For the αS protein, BL21(DE3) Gold cells (Stratagene) were transformed with wild-type (WT) human αS. Starters were diluted into Overnight Express Instant TB Medium (Novagen) supplemented with 1% glycerol and left to grow for 16–18 h at 30 °C. Cells were then harvested and the protein was purified as previously published 45 . Human amyloid-β 1–42 protein (aβ 1-42 ) was purchased from Anaspec (USA). The protein was re-suspended in 10 mM NaOH in MQ water and purified by high-performance-liquid-chromatography (Agilent) using a BIoSep_SEC-s2000 column (OOH-214-K0) 300 × 7.80 mm. The protein was eluted using PBS and peak fractions were collected, frozen immediately in liquid nitrogen and stored at –80 °C until use.
Preparation of protein aggregates
WT αS was prepared from gel-filtration purified monomer fractions flash frozen in liquid nitrogen. Monomer was ultracentrifuge before aggregate formation for 1 h, 90000 r.p.m. at 4 °C using a TLA100 rota. Experiments were conducted in triplicate. For each experiment, 600 μL of 70 μM protein in 25 mM Tris-HCl pH 7.4 and 100 mM NaCl was incubated at 37 °C with 200 r.p.m. orbital shaking. Each reaction was supplemented with 0.01% NaN 3 to prevent bacterial growth. At 8 h (for early aggregates/oligomers) or 20–24 h incubation (fibrils or small fibrils), 10 μl of aggregation mixture was collected and stored at 4 °C. The aβ 42 protein solutions were prepared from monomeric solutions of human aβ 42 (Anaspec, San Jose, CA) and prepared by dissolving the lyophilized peptides in SSPE buffer (150 mM NaCl, 10 mM Na 2 H 2 PO 4 × H 2 O, and 10 mM Na 2 EDTA, adjusted to pH 12 using NaOH), followed by sonication over ice for 30 min, and subsequently flash freezing into 5 μL aliquots. Before each of the incubations, aliquots of each peptide were diluted into SSPE buffer (pH adjusted to 7.4 using HCl) to 500 nM (monomer concentration) and placed under conditions for aggregation (37 °C, agitation). Samples were collected after 5 h incubation (for early aggregates/oligomers) or at 20–24 h incubation (for fibrils and small fibrils). The samples were stored on ice and imaged immediately. Data are representative of two aggregation experiments conducted on separate days.
Cell culture
All culture reagents were purchased from Invitrogen (UK) unless otherwise specified. Human SH-SY5Y epithelial cells (ATCC CRL-2266) were cultured in Dulbecco's Modified Eagle's Medium (DMEM), F-12 Ham with 25 mM HEPES and NaHCO 3 (1:1). Human HEK 293 epithelial cells (ATCC CRL-1573) were cultured in low-glucose DMEM. The base cell culture medium was supplemented with 10% (v/v) fetal bovine serum, 50 units ml −1 penicillin, 50 mg ml −1 streptomycin and 2 mM L-glutamine. Cells were cultured in tissue culture flasks (Greiner Bio-One, USA) at 37 °C in 5% CO 2 and 95% relative humidity. Cultures were routinely split (1:3) at ∼80% confluency and released for sub-cultivation using 0.25% (v/v) trypsin-EDTA.
Preparation of cells for imaging
Sterilized glass coverslips (No. 1 25 mm round, VWR international, Germany) were placed in 6-well tissue culture plastic plates (Greiner Bio-one, USA) and seeded with SH-SY5Y cells or HEK 293 cells at a density of 2 × 10 6 cells per well. Cells were cultured overnight and then either imaged live or fixed using 4% paraformaldehyde (Thermo scientific, USA) and 0.2% glutaraldehyde (G6257) in phosphate buffered saline buffer (PBS, Invitrogen) for 30 min before imaging. The coverslip was placed in a holder (Invitrogen), transferred to the microscope stage and imaged at room temperature in an imaging buffer of DMEM without fetal bovine serum, supplemented with 0.05 μM of NR. For SH-SY5Y imaging, at least 20 different cells were imaged on 6 different days. The cholesterol content of HEK 293 cells was altered as previously described 31 . Briefly, the cholesterol content of cells was increased or decreased by supplementing the serum-free culture media with methyl-β-cyclodextrin−cholesterol complex at 0.5 mg ml −1 for 3.0 h or with methyl-β-cyclodextrin at 2.0 mM for 30 min at 37 °C, respectively. The cholesterol manipulation was confirmed using a cholesterol assay kit (ab133116, abcam, UK). Cells were rinsed twice with warmed PBS and imaged immediately using imaging buffer. Data are representative of at least two experiments conducted on separate days.
Instrumentation
Fluorescence imaging was performed using a home-built, bespoke inverted optical microscope (Olympus, IX73) coupled to an electron multiplied charged coupled device (EMCCD) camera (Evolve II 512, Photometrics, Tuscon, AZ). The microscope was configured to operate in objective-type total internal reflection fluorescence (TIRF) mode (for LUVs and protein aggregates) or using highly inclined and laminated optical sheet (HILO) microscopy 46 (for the cell membrane experiments), with the circularly polarized beam of either: 1.) a 100 mW 532 nm continuous wavelength diode-pumped solid-state laser (LASOS Lasertechnik GmbH, Germany) or 2.) a 100 mW 405 nm CW diode laser (Cobolt, MLD 0405-06-01-0100-100) used as light sources. The lasers were directed off a dichroic mirror Di02-R532-25x36 for 532 nm illumination (Semrock, USA) or Di02-R405-25x36 (Semrock, USA) for 405 nm illumination through a high numerical aperture, oil-immersion objective lens (Plan Apochromat 60 × NA 1.49, Olympus APON 60XOTIRF, Japan) to the sample coverslip. Total internal reflection was achieved by focusing the laser at the back focal plane of the objective, off axis, such that the emergent beam at the sample interface was near-collimated and incident at an angle greater than the critical angle θ c ∼ 67 ° for a glass/water interface for TIRF imaging and slightly less than θ c for HILO. This generated a ∼50 μm diameter excitation footprint with power densities in the range ∼0.5 kW cm −2 at the coverslip. The emitted fluorescence was collected through the same objective and further filtered using a longpass filter BLP01-532R-25 (Semrock, USA) and a bandpass filter FF01-650/200-25 (Semrock, USA) for 532 nm illumination or a longpass filter (FF02-409/LP-25, Semrock, USA) for 405 nm illumination before being expanded by a 2.5 × relay lens (Olympus PE 2.5 × 125). Finally, a physical aperture (VA100/M, Thorlabs) and a transmission diffraction grating (300 Grooves/mm 8.6° Blaze Angle - GT13-03, Thorlabs) were mounted on the camera port path before the detector. The camera-to-grating distance was optimized using TetraSpeck beads (0.1 μm, T7297, Invitrogen) such that undiffracted (zeroth) and first order diffraction was visible on the same image frame in accordance with equation 1 . Where the fluorescence image was finally projected onto the EMCCD running in frame transfer mode with at 20 Hz, with an electron multiplication gain of 250, operating at −70 °C with a pixel size of 16 μm and automated using the open source microscopy platform Micromanager. Transmission Diffraction grating equations were used to estimate the spectral dispersion from the zeroth order at a given distance 47 . where d is the grating line spacing, θ m is the diffraction angle at order m , m is the order of diffraction and λ is the wavelength. where γ is the blaze angle or the angle between the surface structure and the surface parallel. sPAINT Guide We detail below the three steps required to generate md-SR sPAINT images: Step 1 calibrates for instrument variation, Step 2 explains how to acquire optimal data, and Step 3 describes how to reconstruct and render the final sPAINT images. For each of these steps, accompanying sample code and data are provided in Supplementary Data 1-5 (see below) and 48 ref. 48. Step 1. Spectral calibration, Aberration Correction and Absolute Wavelength Calibration The location of the spectral domain on the EMCCD chip is strongly dependent on the orientation and position of the diffraction grating, and so to ensure that the wavelengths determined were correct and therefore comparable, the instrument was calibrated before imaging each day, and following re-alignment. To calibrate the instrument, TetraSpeck beads were imaged by exciting at 405 nm and the emission collected from 480 to 760 nm ( Supplementary Fig. 1a , Supplementary Data 1 ) (100 frames were collected with a frame rate of 35 ms). The positions of the beads within the spatial domain of the image were determined using the PeakFit plugin (an imageJ/Fiji plugin of the GDSC Single Molecule Light Microscopy (SMLM) package ( http://www.sussex.ac.uk/gdsc/intranet/microscopy/imagej/gdsc_plugins ) for imageJ (ref. 49 ) using a typical ‘signal strength' threshold of ∼30. The fit results values are then saved as a text file in the directory containing the image for use the subsequent spectral analysis below. The spectral component of the image ( Supplementary Fig. 1b ) was analysed using a custom written macros. For non-linear least-squares data fitting the analysis was performed in either; (A) Igor Pro (Wavemetrics) using the Levenberg-Marquardt algorithm to search for the minimum value of chi-square or (B) In the case of the included ImageJ Plugin using the inbuilt fit (Fit.doFit) function (see Supplementary Data 2 ). With the filter set allowing collection of wavelengths between 480 and 760 nm, there are three clear peaks in the spectral region of the image for each bead ( Supplementary Fig. 1a ). The position of these three peaks allows both for the aberration correction (due to the relationship between these and the spatial positions of the beads), and for the pixel-to-wavelength ratio to be determined. The approximate distance between the bead position and each one of the three peaks (Z 0 Z 1 distance) is be estimated, by the user, and input as the parameters for the imageJ plugin (examples of the three distances are indicated by the green, orange and red arrows in Supplementary Fig. 1a ). For each localization (with co-ordinates x , y , frame number), the spectrum for each of the three peaks was plotted by using the estimated distance and extracting an intensity profile 15 pixels either side of it (in the y -direction), and averaging this over a width of 3 pixels in the x -direction (to account for the spectra being wider than one pixel). Each intensity profile was fit to a Gaussian distribution to determine the center positions of the peaks ( Supplementary Fig. 2 ). Fits that gave negative amplitudes, centers outside of the range, widths 20 pixels were discarded. The output data were then clustered using R ( https://cran.r-project.org ). Emission wavelengths at peak maximum ( λ ) were set as 512.7, 581.5 and 676.5 nm ( Supplementary fig. 3a ). Z 0 Z 1 distances were fitted to a multiple linear regression model: where y is the Z 0 Z 1 distance (in pixels), β 0 is the intercept and β 1 to β 3 are the regression parameters associated to λ, x and y dimensions, respectively. These parameters are required for the spectral analysis of datasets. The corrected wavelength can finally be calculated from Z 0 Z 1 distance according to: R code is available as a script in Supplementary Data 3 . Step 2. Image acquisition, processing and spectral analysis Images were acquired at a frame rate typically
📊 Figures
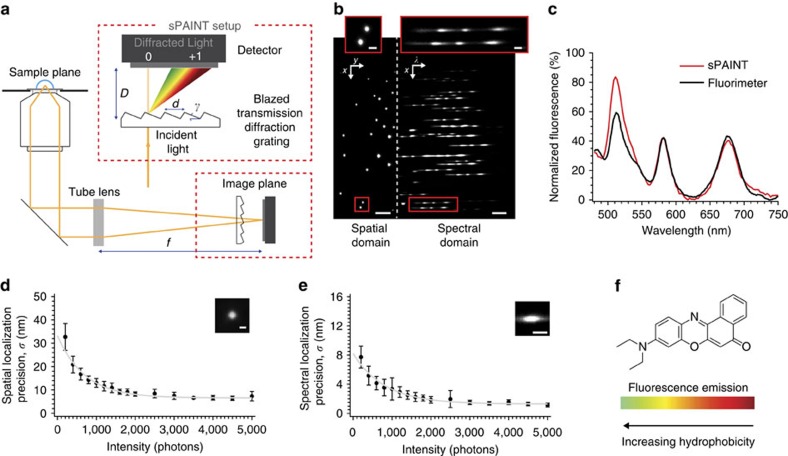
Figure 1
sPAINT instrumental setup.
( a ) Scheme of the sPAINT setup; single-molecule fluorescence is collected by a high NA objective lens and focused by the tube lens before passing through a blazed transmission diffraction grating. H...
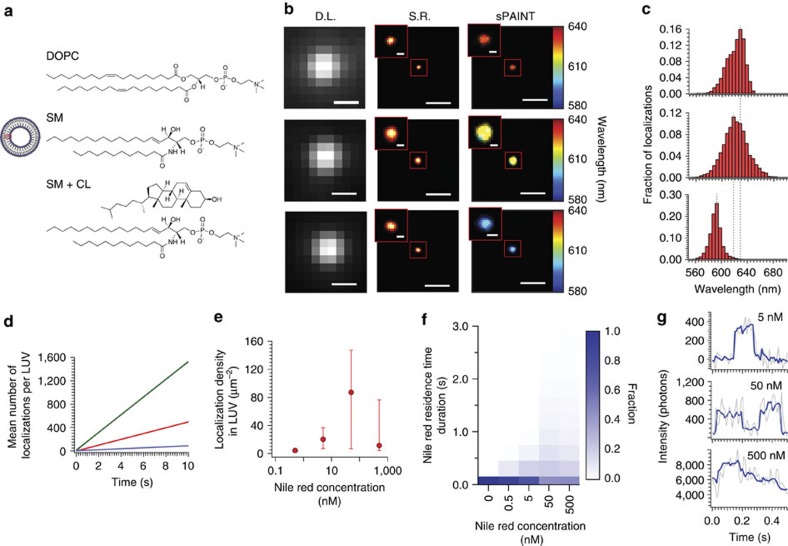
Figure 2
Nile Red sPAINT calibrated on synthetic 100u2009nm unilamellar vesicles (LUVs).
( a ) Scheme of the LUV and rows from top-to-bottom; LUVs composed of DOPC lipid, SM lipid or SM/cholesterol lipid. ( b ) Columns from left-to-right; diffraction-limited image (D.L.), super-resolution...
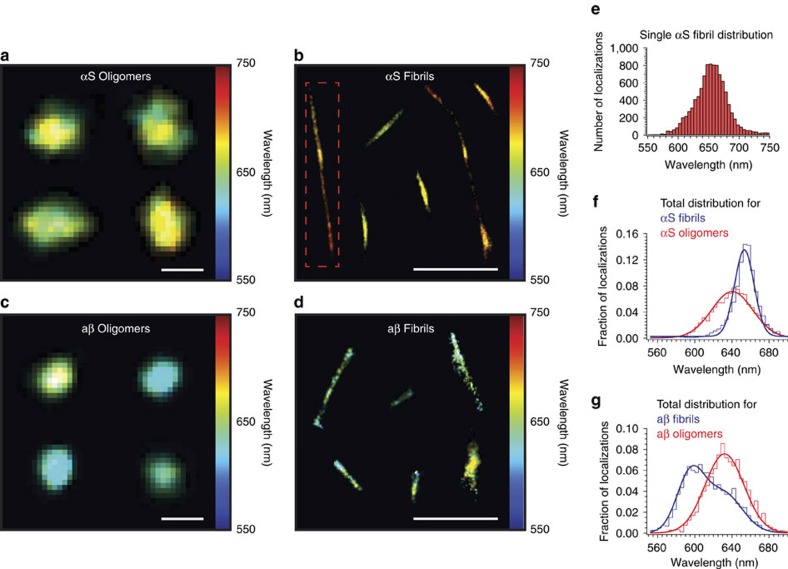
Figure 3
sPAINT imaging of protein aggregates associated to disease.
( a ) Representative sPAINT hydrophobicity image of single u03b1S oligomers. Scale bar is 100u2009nm. ( b ) Representative sPAINT hydrophobicity image of individual u03b1S fibrils. By examining aggreg...
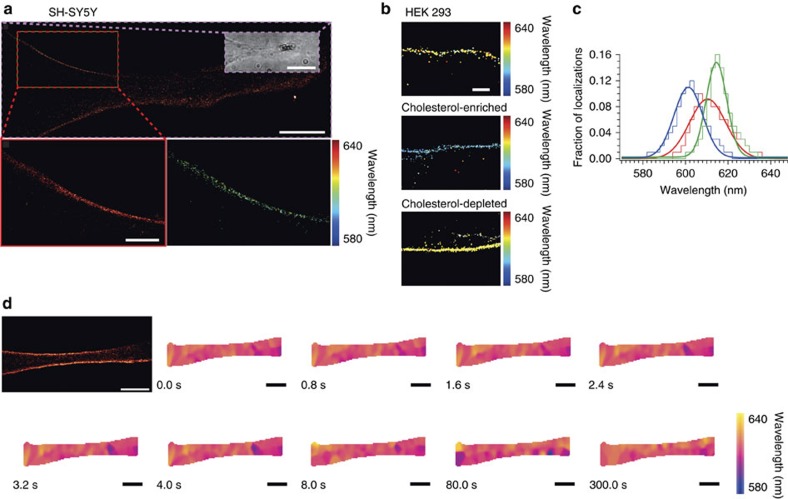
Figure 4
sPAINT imaging along the length of the cell plasma membrane.
( a ) Representative SR image of a live neuron-like SH-SY5Y cell (inset: white-light image). Scale bar is 5u2009u03bcm ( n =31,744 localizations peak photon values above background u223c543) and corre...
Figure images are served from the NIH/NLM PubMed Central Open Access Subset or Europe PMC; copyright remains with the publishers and authors.
💬 Discussion
0 commentsNo comments yet. Be the first to start a discussion!
Leave a Comment