Abstract
AbstractSingle-molecule localization techniques are restricted by long acquisition and computational times, or the need of special fluorophores or biologically toxic photochemical environments. Here we propose a statistical super-resolution technique of wide-field fluorescence microscopy we call the multiple signal classification algorithm which has several advantages. It provides resolution down to at least 50 nm, requires fewer frames and lower excitation power and works even at high fluorophore concentrations. Further, it works with any fluorophore that exhibits blinking on the timescale of the recording. The multiple signal classification algorithm shows comparable or better performance in comparison with single-molecule localization techniques and four contemporary statistical super-resolution methods for experiments of in vitro actin filaments and other independently acquired experimental data sets. We also demonstrate super-resolution at timescales of 245 ms (using 49 frames acquired at 200 frames per second) in samples of live-cell microtubules and live-cell actin filaments imaged without imaging buffers.
🔬 Techniques
🔭 Microscopes
💻 Software
✨ Fluorophores
🧪 Sample Preparation
🏭 Microscope Brands
🧪 Reagent Suppliers
📷 Detectors
🎨 Filters
💻 Software Details
🏛️ Research Organizations (ROR)
Affiliated research institutions:
📋 Methods
In vitro actin sample preparation We used the protocol suggested in ref. 26 for forming the in vitro actin samples. Preformed actin filaments from Cytoskeleton Inc., extracted from rabbit skeletal muscle, were used for forming the sample. In one chamber of an 8-chambered cover glass of ∼750 μl volume, 200 μl of 0.01% poly- L -lysine solution was incubated for 10 min. Remaining liquid was drained out using a pipette. A total of 90 μl of general actin buffer (reconstituted as suggested by Cytoskeleton's product datasheet of general actin buffer) was introduced in the chamber. This was followed by adding 10 μl of 10 μM preformed actin filaments and 10 μl of Phalloidin Atto-565 solution (stock solution prepared as recommended by the manufacturer, Sigma-Aldrich). The contents of chamber were mixed by gently pipetting up and down. An incubation time of ∼45 min was allowed. Then the liquid in the chamber was removed by pipetting. For sample 1, the contents of the chamber were washed 3 times using Buffer B (see details of imaging buffer below) by a two pipette system, where 1 pipette let in the buffer and the other pipette sucked out the solution. Sample 2 was washed five times. Sample 3, with results in Supplementary Fig. 13 , was not washed at all. In sample 2, we introduced tetraspeck beads in the imaging solution and allowed the solution to settle for 3 hours. In samples 2 and 3, where the same samples are imaged with different excitation powers, the image stacks have been appropriately shifted to compensate for the drift of sample between different acquisitions. See Supplementary Table 2 for an overview of the in vitro samples.
Show full methods section
In vitro actin sample preparation We used the protocol suggested in ref. 26 for forming the in vitro actin samples. Preformed actin filaments from Cytoskeleton Inc., extracted from rabbit skeletal muscle, were used for forming the sample. In one chamber of an 8-chambered cover glass of ∼750 μl volume, 200 μl of 0.01% poly- L -lysine solution was incubated for 10 min. Remaining liquid was drained out using a pipette. A total of 90 μl of general actin buffer (reconstituted as suggested by Cytoskeleton's product datasheet of general actin buffer) was introduced in the chamber. This was followed by adding 10 μl of 10 μM preformed actin filaments and 10 μl of Phalloidin Atto-565 solution (stock solution prepared as recommended by the manufacturer, Sigma-Aldrich). The contents of chamber were mixed by gently pipetting up and down. An incubation time of ∼45 min was allowed. Then the liquid in the chamber was removed by pipetting. For sample 1, the contents of the chamber were washed 3 times using Buffer B (see details of imaging buffer below) by a two pipette system, where 1 pipette let in the buffer and the other pipette sucked out the solution. Sample 2 was washed five times. Sample 3, with results in Supplementary Fig. 13 , was not washed at all. In sample 2, we introduced tetraspeck beads in the imaging solution and allowed the solution to settle for 3 hours. In samples 2 and 3, where the same samples are imaged with different excitation powers, the image stacks have been appropriately shifted to compensate for the drift of sample between different acquisitions. See Supplementary Table 2 for an overview of the in vitro samples.
Preparation and introduction of imaging buffer
We used the imaging buffer composition suggested in ref. 27 . Buffer A composed of 10 mM of TRIS (pH 8.0) and 50 mM NaCl. Buffer B composed of 50 mM TRIS (pH 8.0), 10 mM NaCl and 10% Glucose (weight per volume). GLOX solution (1 ml) was formed by vortex mixing a solution of 56 mg of Glucose oxidase, 200 μl of Catalase (17 mg ml −1 ) and 800 μl of Buffer A. MEA solution (1 M, 1 ml) was prepared using 77 mg of MEA and 1 ml of 0.25 N HCl. For one chamber of an eight-chambered cover glass of about 750 μl volume, 700 μl of imaging buffer was prepared by mixing 7 μl of GLOX solution, 70 μl of MEA solution and 620 μl of Buffer B on ice. This imaging buffer was used as the medium for in vitro actin samples. The chamber was filled completely and covered immediately to avoid replenishing of oxygen in solution.
Live-cell sample preparation
CHO-K1 cells were obtained from ATCC (Manassas, VA).
Lifeact cells
(CHO-K1 cells stably expressing Lifeact-GFP) were provided by Prof. Rachel S. Kraut (NTU, Singapore). CHO-K1 and Lifeact cells were cultivated in DMEM medium (Dulbecco's Modified Eagle Medium, Invitrogen; Singapore) supplemented with 1% penicillin G and streptomycin (PS, PAA, Austria), and 10% fetal bovine serum (Invitrogen; Singapore) at 37 °C in 5% (v/v) CO 2 environment. GFP-tubulin plasmid was a gift from Dr Pakorn T. Kanchanawong (MBI, NUS, Singapore). Electroporation was used for transfection of the cells, during which, 90% confluent cells in a 75 cm 2 flask were washed twice with 1 × PBS, trypsinized with 0.25% trypsin-0.03% EDTA solution for ∼1 min at 37 °C, and then re-suspended in culture medium. Cells were precipitated by centrifugation and re-suspended in small amount of resuspension R buffer (NeonTM Transfection System, Life Technologies, Singapore) and transferred half into one electroporation cuvette (2 mm wide, Bio-Rad; Hercules, CA) for one transfection. Between 300 and 500 ng ml −1 of the plasmid were added. After electroporation pulse, cells were seeded back to prewashed cover glass (30 mm in diameter; Lakeside, Monee, IL) in a 35 mm culture dish. Transfected cells grew in the culture medium for 24–36 h before measurement. All cells were imaged in Phenol red free DMEM medium containing 10% fetal bovine serum. See Supplementary Table 2 for an overview of the live-cell samples.
Imaging system and image acquisition
The setup consisted of an inverted epifluorescence microscope (IX83, Olympus, Japan) equipped with a motorized TIRF illumination combiner (IX3-MITICO, Olympus, Japan) and a scientific complementary metal oxide (sCMOS) camera with 6.5 μm pixels (Orca-Flash4.0, Hamamtsu Photonics, Japan). A 488 nm laser (LAS/488/100/D) or 561 nm laser (LAS/561/100, Olympus, Germany) was connected to the TIRF illumination combiner in which the incidence angle was adjusted to give 110 nm penetration depth of the evanescent field. The 488 and 561 nm lasers were used for imaging live-cell samples or in vitro actin filaments, respectively. A × 100, numerical aperture 1.49 oil immersion objective (UAPON, Olympus, Japan) was used to illuminate the sample and collect the fluorescence image. The fluorescence light then passed through a major dichroic (ZT405/488/561/647rpc, Chroma Technology, Bellows Falls, VT) and a band-pass filter (ZET405/488/561/647m, Chroma Technology, Bellows Falls, VT). The intensity of the excitation light was determined as the power of the laser light exiting the objective divided by the illuminated area; the power of the laser light was regulated by the proprietary laser control software and by an additional OD 1 neutral density filter. The camera was controlled by Micro-Manager 1.4 (ref. 28 ). For multiple power measurements, the first measurement is done using the lowest power and the power is subsequently increased. The optical PSF computed as an airy disk has FWHM of ∼198 nm for these parameters and emission wavelength 593 nm of the phalloidin Atto-565 dye and about 176 nm for emission wavelength 512 nm of the lifeact-GFP. For in vitro samples 1 and 2, 10,000 frames were acquired with exposure time of 5 ms (200 frames per second) For in vitro sample 3, 20,000 frames were acquired with exposure time of 10 ms (100 frames per second). For live-cell microtubule sample 1, 1,000 frames were acquired with exposure time of 5 ms (200 frames per second). For live-cell microtubule sample 2, 49 frames were acquired with exposure time of 1 ms (1,000 frames per second). For live-cell F-actin sample, 100 frames were acquired with exposure time of 1 ms (1,000 frames per second).
Data availability
The data that support the findings of this study and the source codes of MUSICAL are available at https://sites.google.com/site/uthkrishth/musical .
Supplementary Material Supplementary Information Supplementary Figures, Supplementary Tables, Supplementary Notes, Supplementary Methods and Supplementary References. Peer Review File
📊 Figures
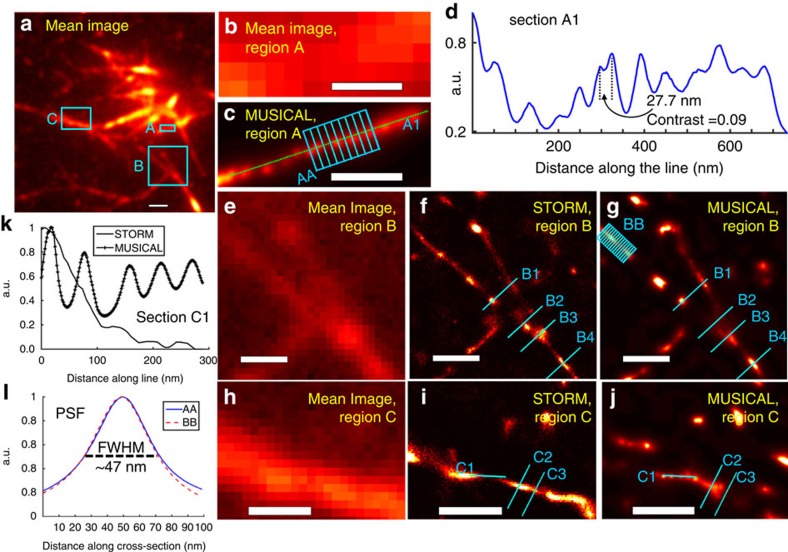
Figure 1
Results for regions Au2013C of in vitro sample 1.
The mean image of 10,000 frames is shown in a . ( b , c ) The mean image and MUSICAL image for region A. ( d ) Shows the profile of section A1 shown in c . ( e u2013 g ) The mean image, STORM image, a...
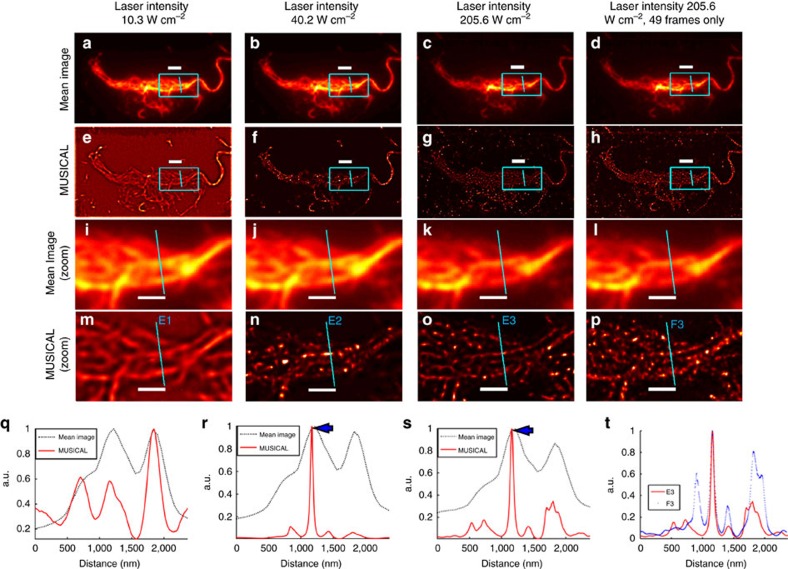
Figure 2
MUSICAL results for in vitro sample 2.
The first, second and third columns correspond to the image stacks acquired using laser powers 10.3u2009Wu2009cm u22122 ( a , e , i , m , q ), 40.2u2009Wu2009cm u22122 ( b , f , j , n , r ) and 205.6u...
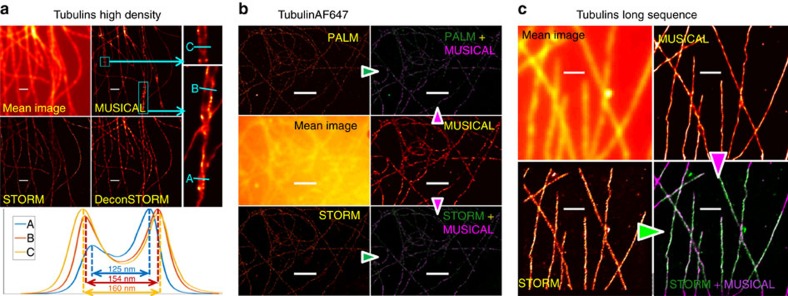
Figure 3
Results on Data-SMLM data sets and synthetic example SynSTORM for comparison of MUSICAL with SMLM techniques.
( a ) Tubulins high density (500 frames), ( b ) tubulins long sequence (15,000 frames) and ( c ) TubulinAF647 (9,990 frames). PALM and STORM results in b are taken from 11 . In b , MUSICAL image (in g...
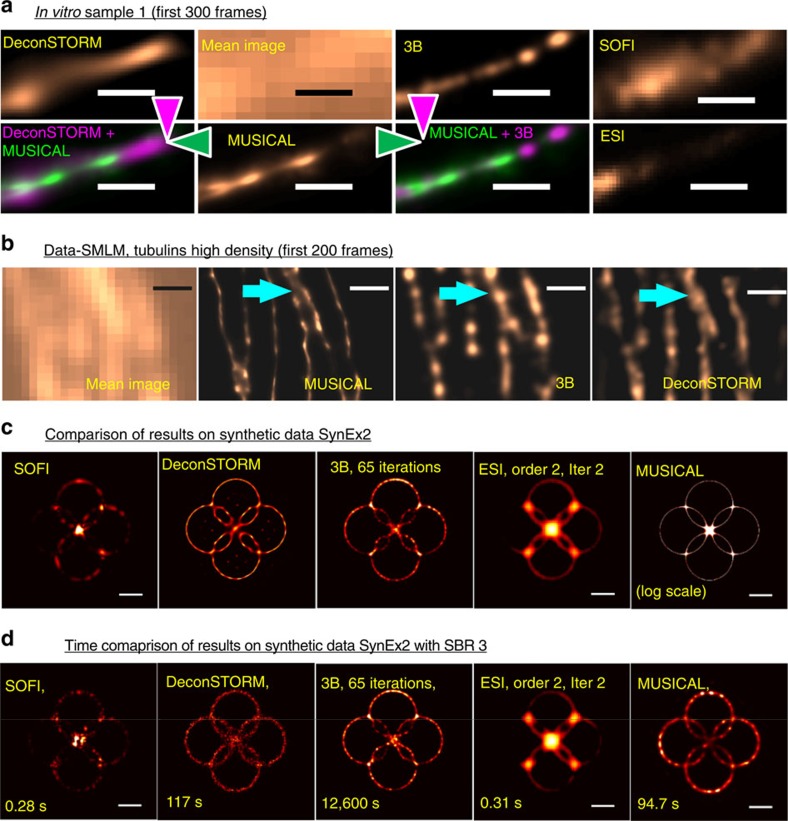
Figure 4
Comparison of MUSICAL with other super-resolution methods that perform statistical analysis of blinking statistics rather than SMLM.
( a ) shows comparison for region A of in vitro sample 1. Overlay of MUSICAL image with 3B and deconSTORM is given for comparison in addition to their individual results. ( b ) Comparison of MUSICAL r...
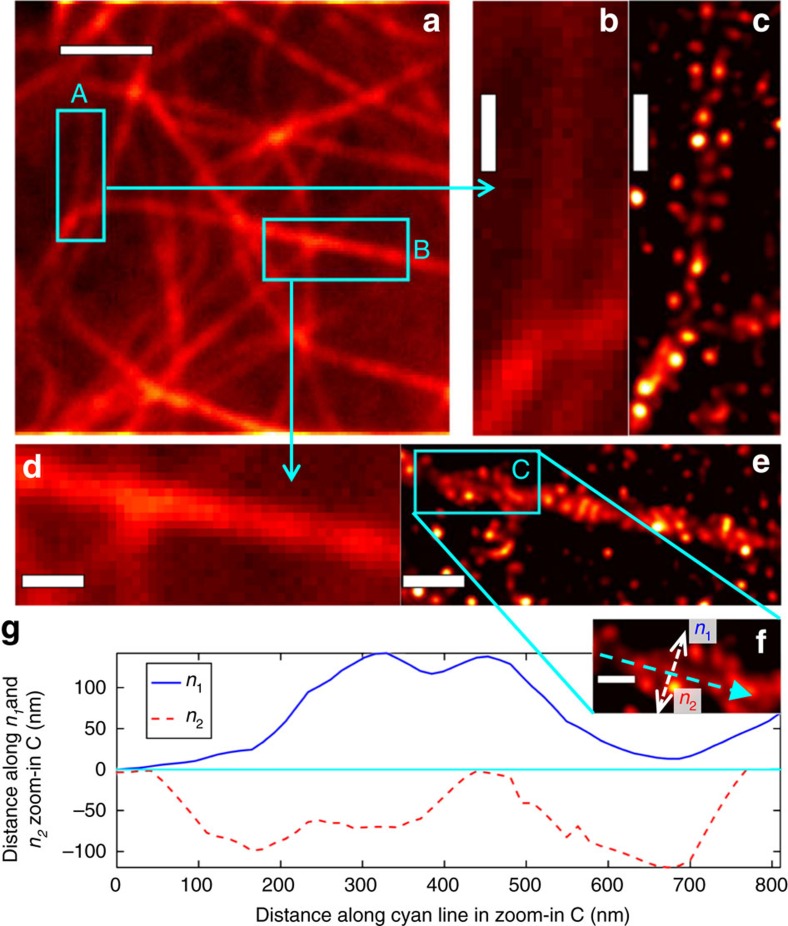
Figure 5
Result of MUSICAL for live-cell microtubules sample 1.
Mean image of 49 frames is shown in a . Mean image and MUSICAL result for region A identified in a are shown in b , c . Mean image and MUSICAL result for region B identified in a are shown in d , e . ...
Figure images are served from the NIH/NLM PubMed Central Open Access Subset or Europe PMC; copyright remains with the publishers and authors.
💬 Discussion
0 commentsNo comments yet. Be the first to start a discussion!
Leave a Comment