Abstract
Extending across multiple length scales, dynamic chromatin structure is linked to transcription through the regulation of genome organization. However, no individual technique can fully elucidate this structure and its relation to molecular function at all length and time scales at both a single-cell level and a population level. Here, we present a multitechnique nanoscale chromatin imaging and analysis (nano-ChIA) platform that consolidates electron tomography of the primary chromatin fiber, optical super-resolution imaging of transcription processes, and label-free nano-sensing of chromatin packing and its dynamics in live cells. Using nano-ChIA, we observed that chromatin is localized into spatially separable packing domains, with an average diameter of around 200 nanometers, sub-megabase genomic size, and an internal fractal structure. The chromatin packing behavior of these domains exhibits a complex bidirectional relationship with active gene transcription. Furthermore, we found that properties of PDs are correlated among progenitor and progeny cells across cell division.
🔬 Techniques
✨ Fluorophores
🧪 Sample Preparation
🔬 Cell Lines
🏭 Microscope Brands
🧪 Reagent Suppliers
📷 Detectors
💻 Software Details
💾 Data Repositories
🏛️ Research Organizations (ROR)
Affiliated research institutions:
📋 Methods
Cell culture
A549 cells were cultured in Dulbecco’s modified Eagle’s medium (Thermo Fisher Scientific, Waltham, MA; #11965092). BJ cells were cultured in minimum essential media (Thermo Fisher Scientific, Waltham, MA; #11095080). HeLa and M248 cells were cultured in RPMI 1640 medium (Thermo Fisher Scientific, Waltham, MA; #11875127). HCT116 cells were cultured in McCoy’s 5a modified medium (Thermo Fisher Scientific, Waltham, MA; #16600082). All culture media were supplemented with 10% fetal bovine serum (Thermo Fisher Scientific, Waltham, MA; #16000044) and penicillin-streptomycin (100 μg/ml; Thermo Fisher Scientific, Waltham, MA; #15140122). All cells were maintained and imaged under physiological conditions (5% CO 2 and 37°C) for the duration of the experiment. Experiments were performed on cells from passages 5 to 20. ChromEM sample preparation, imaging, and tomography reconstruction All cells were prepared by previously published chromEM staining protocol ( 8 ) and described in detail in section S2. Two kinds of sections were made using an ultramicrotome (UC7, Leica). For the tomography, 100- to 200-nm-thick resin sections were cut and deposited onto a copper slot grid with carbon/formvar film (EMS). For investigating the chromatin structure difference with and without DXM treatment, 50-nm-thick resin sections were made and deposited onto copper 200-mesh grid with carbon/formvar film (EMS). The grids were plasma-cleaned by a plasma cleaner (easiGlow, TED PELLA) before use. No poststaining was performed, but 10-nm colloidal gold particles were added to the tomography samples on both sides as fiducial markers. A 200-kV STEM (HD2300, HITACHI) was used for tomography data collection. HAADF imaging contrast was used in the tilt series. To reduce the missing wedge, tilting series from −60° to 60° on two perpendicular axes were recorded manually, with 2° step size. The pixel dwell time was kept small (~5 μs) to prevent severe beam damage during imaging. For the thin sections, a TEM (HT7700, HITACHI) was operated at 80 kV in the bright field to capture high-contrast chromatin data. For tomography, a combination of methods was used to achieve high-quality reconstruction (section S2). A nominal voxel size of 2 to 2.9 nm was used in the tomography to resolve individual nucleosomes. The DNA density was used to generate color-coded nucleosome configurations, with green color dictating the lowest density, and red dictates the highest density. The chromatin binary masks were used to generate the surface of supranuclesomal structures. The videos of example tomography and volume rendering can be found in movies S4 and S5.
Show full methods section
Cell culture
A549 cells were cultured in Dulbecco’s modified Eagle’s medium (Thermo Fisher Scientific, Waltham, MA; #11965092). BJ cells were cultured in minimum essential media (Thermo Fisher Scientific, Waltham, MA; #11095080). HeLa and M248 cells were cultured in RPMI 1640 medium (Thermo Fisher Scientific, Waltham, MA; #11875127). HCT116 cells were cultured in McCoy’s 5a modified medium (Thermo Fisher Scientific, Waltham, MA; #16600082). All culture media were supplemented with 10% fetal bovine serum (Thermo Fisher Scientific, Waltham, MA; #16000044) and penicillin-streptomycin (100 μg/ml; Thermo Fisher Scientific, Waltham, MA; #15140122). All cells were maintained and imaged under physiological conditions (5% CO 2 and 37°C) for the duration of the experiment. Experiments were performed on cells from passages 5 to 20. ChromEM sample preparation, imaging, and tomography reconstruction All cells were prepared by previously published chromEM staining protocol ( 8 ) and described in detail in section S2. Two kinds of sections were made using an ultramicrotome (UC7, Leica). For the tomography, 100- to 200-nm-thick resin sections were cut and deposited onto a copper slot grid with carbon/formvar film (EMS). For investigating the chromatin structure difference with and without DXM treatment, 50-nm-thick resin sections were made and deposited onto copper 200-mesh grid with carbon/formvar film (EMS). The grids were plasma-cleaned by a plasma cleaner (easiGlow, TED PELLA) before use. No poststaining was performed, but 10-nm colloidal gold particles were added to the tomography samples on both sides as fiducial markers. A 200-kV STEM (HD2300, HITACHI) was used for tomography data collection. HAADF imaging contrast was used in the tilt series. To reduce the missing wedge, tilting series from −60° to 60° on two perpendicular axes were recorded manually, with 2° step size. The pixel dwell time was kept small (~5 μs) to prevent severe beam damage during imaging. For the thin sections, a TEM (HT7700, HITACHI) was operated at 80 kV in the bright field to capture high-contrast chromatin data. For tomography, a combination of methods was used to achieve high-quality reconstruction (section S2). A nominal voxel size of 2 to 2.9 nm was used in the tomography to resolve individual nucleosomes. The DNA density was used to generate color-coded nucleosome configurations, with green color dictating the lowest density, and red dictates the highest density. The chromatin binary masks were used to generate the surface of supranuclesomal structures. The videos of example tomography and volume rendering can be found in movies S4 and S5.
Self-attracting polymer simulations
Coarse-grained polymer simulations were performed using LAMMPS molecular dynamics software. Chains of identical monomers were simulated using BD with a Langevin thermostat. Each monomer represents a nucleosome core and has mass m = 1. Polymers up to ~150 kbp (1000 monomers) were simulated. Intermonomer bonds were formed between successive monomers using the finitely extensible nonlinear elastic potential E = − 0.5 KR 0 2 ln [ 1 − ( r − Δ R 0 ) 2 ] + 4 ε [ ( σ r − Δ ) 12 − ( σ r − Δ ) 6 ] + ε (1) for K = 30.0, R 0 = 1.5, ε = 1.0, σ = 1.0, and Δ = 4.0. An LJ potential was used to model pairwise interactions between all monomers and reinforce excluded volume effects E = 4 ε [ ( σ r − Δ ) 12 − ( σ r − Δ ) 6 ] r < r c + Δ (2) for σ = 1.0, Δ = 4.0, and r c = σ + 1.12246. D and s were modulated by tuning ε LJ , the depth of the attractive LJ well potential, between 0 and 2.5. All simulations were first equilibrated, and all mass scaling and contact probability scaling calculations were performed on trajectory files generated by subsequent production runs. Mass scaling was calculated by first counting the number of monomers within a sphere of increasing radius with an origin at the center of mass of the polymer chain and then fitting the resulting relationship between the radius of sphere and mass using linear regression. Two beads were in contact if their coordinates were within a critical distance r crit of each other in 3D space. Contact probability was calculated by summing up all observed contacts between monomers of a certain distance apart in the 1D linear chain overall 4D trajectories. A linear regression fit to the contact probability decay curve plotted against genomic distance was used to calculate contact probability scaling. SRRW simulations The SRRW model was used to describe chromatin folding in a coarse-grained manner. The SRRW model uses steps with a continuous spectrum of step sizes. Each of these steps corresponds to about 2 kb of DNA (about 10 nucleosomes) that represent the conformational freedom of a 10-nm chromatin fiber, i.e., how densely or loosely packed each coarse-grained unit is. Stochastic, self-returning events are implemented through the return probability, which decays with the length of the current step size and is controlled by a chromatin folding parameter, α. We investigated the relation between contact scaling and mass scaling at varying folding states. We used the genomic range of 20 to 200 kb to probe the scaling behaviors within typical PDs. While the contact probability as a function of genomic distance can be analyzed within such a specific window of genomic length, the mass scaling as a function of the physical radius cannot be directly mapped into the genomic window of interest. Moreover, the genomic mass that falls into a spherical probe tends to be discontinuous on the genomic sequence as the radius of the probe increases. To circumvent these problems, we used the inverse of the end-to-end distance scaling factor as an effective mass scaling factor. For a perfect mass-fractal, the end-to-end distance scaling factor is rigorously inverse to the mass scaling factor. One thousand independent conformations were generated to calculate the ensemble-averaged scaling curves. Linear regressions were used to obtain the scaling factors. Hi-C analysis The Juicer analysis tool was used to perform read alignment and read pairing and deduplication for each Hi-C replicates ( 48 ). Reads with a low mapping quality score (
📊 Figures
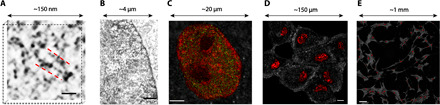
Fig. 1
nano-ChIA platform.
( A ) ChromSTEM HAADF tomography characterizes the 3D chromatin structure of an A549 cell (contrast inverted). The inverted image contrast is inversely proportional to the local DNA density: As the el...
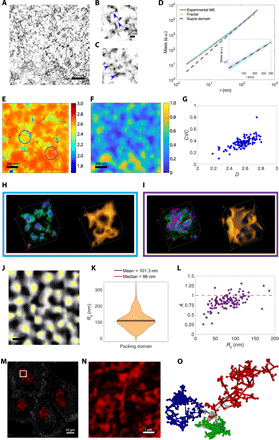
Fig. 2
nano-ChIA identifies fractal PDs.
( A ) Virtual 2D slice from ChromSTEM HAADF tomography reconstruction of chromatin from an A549 cell nucleus (contrast inverted). ( B and C ) High-resolution tomography reveals fine chromatin structur...
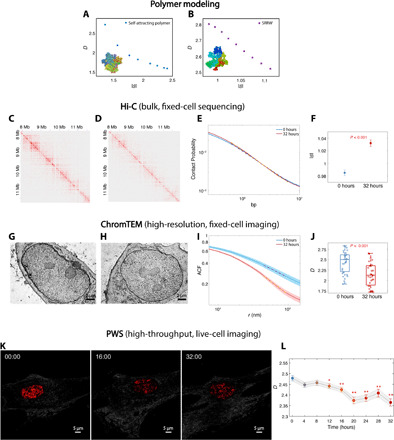
Fig. 3
Relationship between s and D .
( A and B ) A general inverse relationship between s and D is demonstrated using (A) self-attracting polymer and (B) SRRW simulations. ( C and D ) Hi-C contact maps for BJ cells treated with DXM treat...
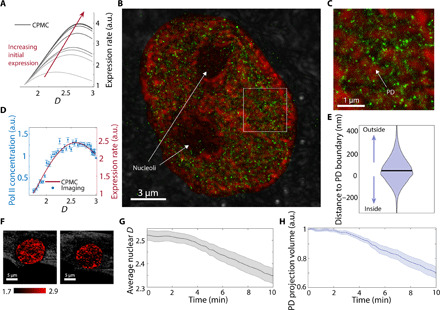
Fig. 4
nano-ChIA platform investigates the relationship between chromatin structure and transcription.
( A ) Multiple realizations of the CPMC model with varying molecular conditions for low- and high-expression genes show that in all cases, the surrounding chromatin packing scaling has a nonmonotonic ...
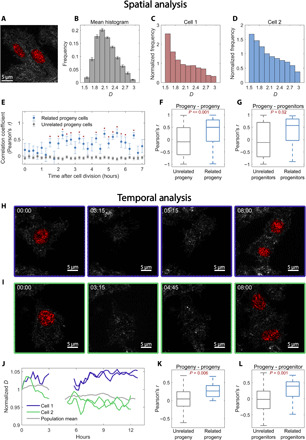
Fig. 5
Time-resolved PWS imaging of HCT116 cells determines heritability of chromatin packing scaling for N = 10 progenitor cells and N = 20 progeny cells.
( A ) PWS D map of two progeny cells originating from the same progenitor. ( B ) Average spatial D distribution of all cells imaged 5 hours after cell division. ( C and D ) Histogram ratio of the spat...
Figure images are served from the NIH/NLM PubMed Central Open Access Subset or Europe PMC; copyright remains with the publishers and authors.
💬 Discussion
0 commentsNo comments yet. Be the first to start a discussion!
Leave a Comment