Abstract
AbstractNeural activity relies on molecular diffusion within nanoscopic spaces outside and inside nerve cells, such as synaptic clefts or dendritic spines. Measuring diffusion on this small scale in situ has not hitherto been possible, yet this knowledge is critical for understanding the dynamics of molecular events and electric currents that shape physiological signals throughout the brain. Here we advance time-resolved fluorescence anisotropy imaging combined with two-photon excitation microscopy to map nanoscale diffusivity in ex vivo brain slices. We find that in the brain interstitial gaps small molecules move on average ~30% slower than in a free medium whereas inside neuronal dendrites this retardation is ~70%. In the synaptic cleft free nanodiffusion is decelerated by ~46%. These quantities provide previously unattainable basic constrains for the receptor actions of released neurotransmitters, the electrical conductance of the brain interstitial space and the limiting rate of molecular interactions or conformational changes in the synaptic microenvironment.
🔬 Techniques
💻 Software
✨ Fluorophores
🧪 Sample Preparation
🔬 Cell Lines
🏭 Microscope Brands
🧪 Reagent Suppliers
🔴 Lasers
💻 Software Details
🏛️ Research Organizations (ROR)
Affiliated research institutions:
📋 Methods
Two-photon TR-FAIM: imaging system Two-photon excitation by short infrared laser pulses was used to restrict emission collection to a thin focal excitation plane ~100 μm deep into the slice. We thus ensured that no contaminating fluorescence was collected from damaged tissue near the slice surface (no detectable autofluorescence from the slices was recorded before applying AF350). The imaging system was based on Biorad Radiance 2000 (Zeiss) microscope, integrated with a SPC-830 TCSPC Becker & Hickl imaging module and a SpectraPhysics MaiTai laser, pulsing at 80 Mhz with a pulse width of
📊 Figures
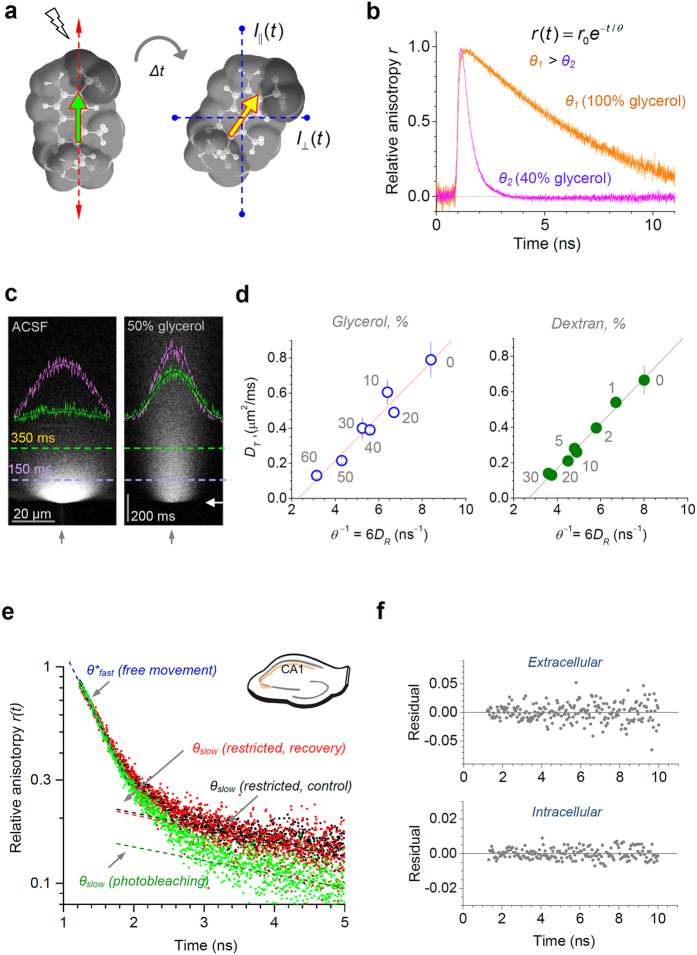
Figure 1
TR-FAIM readout to gauge molecular diffusion on the nanoscale.
( a ) Alexa Fluor 350 (AF350, 3D-diagram with Chem3D-Ultra) excited with polarised light (left: red arrows, polarisation plane; green arrow, excitation plane) moving and rotating over time u0394t befo...
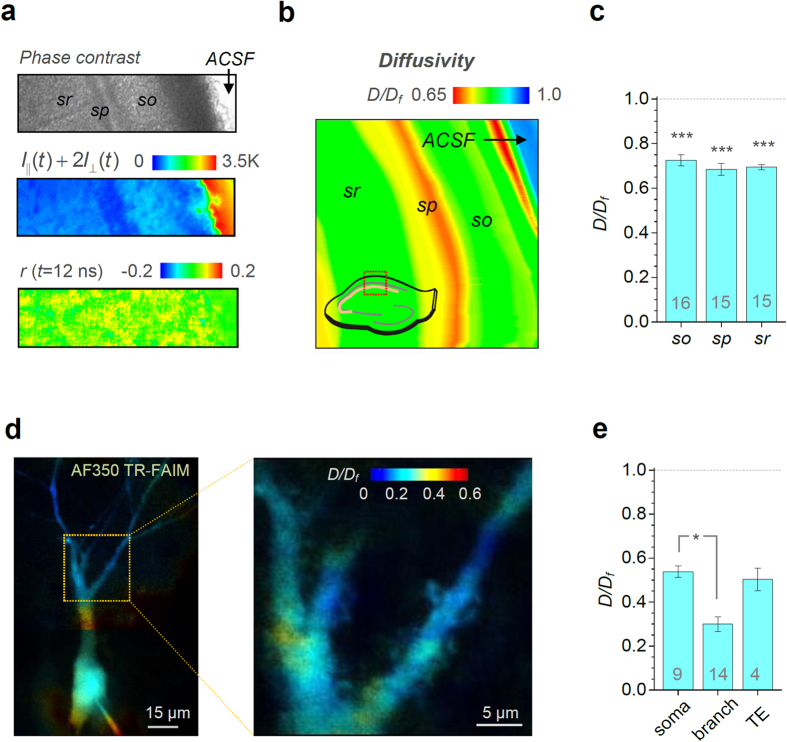
Figure 2
Mapping extracellular and intracellular molecular mobility in a hippocampal slice with TR-FAIM.
( a ) A fragment of hippocampal slice ( sr, s. radiatum ; sp, s. pyrmidale ; so, s. oriens ; ACSF , free medium area) depicted using phase contract (top, grey scale), total fluorescence intensity (mid...
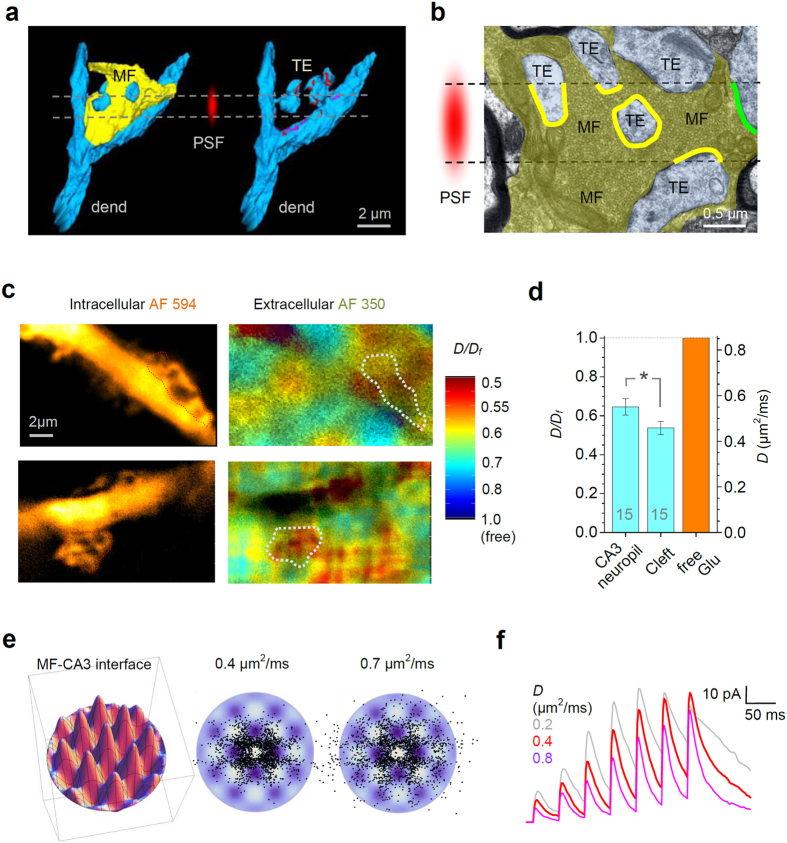
Figure 3
Molecular diffusivity inside and outside the synaptic cleft.
( a ) EM-based 3D reconstruction of the characteristic MF-CA3 synapse (modified from ref. 29 ) depicting a giant presynaptic bouton (yellow) and multiple postsynaptic dendritic spines (thorny excresce...
Figure images are served from the NIH/NLM PubMed Central Open Access Subset or Europe PMC; copyright remains with the publishers and authors.
💬 Discussion
0 commentsNo comments yet. Be the first to start a discussion!
Leave a Comment