Abstract
Experience-induced expression of immediate-early gene Arc (also known as Arg3.1) is known to be important for consolidation of memory. Using in vivo longitudinal multiphoton imaging, we found orchestrated activity-dependent expression of Arc in the mouse extrastriate visual cortex in response to a structured visual stimulation. In wild-type mice, the amplitude of the Arc response in individual neurons strongly predicted the probability of reactivation by a subsequent presentation of the same stimulus. In a mouse model of Alzheimer's disease, this association was markedly disrupted in the cortex, specifically near senile plaques. Neurons in the vicinity of plaques were less likely to respond, but, paradoxically, there were stronger responses in those few neurons around plaques that did respond. To the extent that the orchestrated pattern of Arc expression reflects nervous system responses to and physiological consolidation of behavioral experience, the disruption in Arc patterns reveals plaque-associated interference with neural network integration.
🔬 Techniques
🔭 Microscopes
💻 Software
✨ Fluorophores
🧪 Sample Preparation
🔬 Cell Lines
🏭 Microscope Brands
🧪 Reagent Suppliers
🔴 Lasers
💻 Software Details
🏛️ Research Organizations (ROR)
Affiliated research institutions:
📋 Methods
Mice and surgery
Arc::dVenus mice overexpressing destabilized Venus under 7.1 kb mouse Arc promoter 10 (C57BL/6J background) were crossed with APP SWE; PS1dE9 mice 14 ( APP/PS1 in the text). Arc::dVenus -positive non-carriers of APP/PS1 transgene were used as controls for this study. Mice had cranial windows implanted as described previously 21 over the right visual cortical area at least 3 weeks before imaging to allow for recovery from surgical trauma. Anesthesia used for cranial window implantation was induced with 4% isoflurane in balanced oxygen and maintained at the level of 1.2–1.6% during the surgery. Body temperature was maintained at 37°C. Brain tissue from Thy1::YFP × APP/PS1 mice was acquired from a previous study 22 . Briefly, Thy1::YFP × APP/PS1 mice were perfused with 4% paraformaldehyde and 0.1% glutaraldehyde fixative and coronal sections of 50 μm obtained through the brain. All mice used in the study were 6–7 months old, except for the pre-plaque Arc::dVenus × APP/PS1 cohort and their control littermates, which were 3–3.5 months old. All animal experimentation was performed in conformance with institutional and NIH guidelines and approved by the MGH Institutional Animal Care and Use Committee. To express GFP in the layer II/III neurons of the visual cortex, APP/PS1 mice were stereotaxically injected with AAV2/1-CBA::GFP virus (MassGeneral Vector core) during window implantation. 3 weeks were allowed for the transgene expression and recovery from the surgical trauma prior to imaging.
Show full methods section
Mice and surgery
Arc::dVenus mice overexpressing destabilized Venus under 7.1 kb mouse Arc promoter 10 (C57BL/6J background) were crossed with APP SWE; PS1dE9 mice 14 ( APP/PS1 in the text). Arc::dVenus -positive non-carriers of APP/PS1 transgene were used as controls for this study. Mice had cranial windows implanted as described previously 21 over the right visual cortical area at least 3 weeks before imaging to allow for recovery from surgical trauma. Anesthesia used for cranial window implantation was induced with 4% isoflurane in balanced oxygen and maintained at the level of 1.2–1.6% during the surgery. Body temperature was maintained at 37°C. Brain tissue from Thy1::YFP × APP/PS1 mice was acquired from a previous study 22 . Briefly, Thy1::YFP × APP/PS1 mice were perfused with 4% paraformaldehyde and 0.1% glutaraldehyde fixative and coronal sections of 50 μm obtained through the brain. All mice used in the study were 6–7 months old, except for the pre-plaque Arc::dVenus × APP/PS1 cohort and their control littermates, which were 3–3.5 months old. All animal experimentation was performed in conformance with institutional and NIH guidelines and approved by the MGH Institutional Animal Care and Use Committee. To express GFP in the layer II/III neurons of the visual cortex, APP/PS1 mice were stereotaxically injected with AAV2/1-CBA::GFP virus (MassGeneral Vector core) during window implantation. 3 weeks were allowed for the transgene expression and recovery from the surgical trauma prior to imaging.
Visual stimulation and in vivo multiphoton imaging
Prior to each visual stimulation mice were given an IP injection of amyloid-plaque labeling agent methoxy-XO4 (5 mg/kg) 20 and placed for 60 hours in their home cages into the dark light-proof ventilated cardboard enclosures accommodating one cage each. After the end of light deprivation period mice were transferred to a glass cylinder (30 cm tall, 20 cm wide) with alternating vertical black and white stripes (2 cm wide) applied to the wall. The cylinder was illuminated from the outside, yielding illuminance of approximately 200 lux inside of the cylinder. Following visual stimulation mice were transferred back to their home cages and placed into dark, light-proof enclosures for 6 hours until imaging. Anesthesia was induced inside the light-proof enclosure with 4% isoflurane, mice were transferred to custom-made imaging stage and anesthesia maintained at the level of ~ 1.5%. Texas Red-conjugated dextran (MW 70,000Da, 12.5mg/mL in sterile PBS, Molecular Probes) was injected IV to provide fluorescent angiogram used to locate the same brain region in consecutive imaging sessions and to be used as a reference fluorophore for the control of cranial window quality. Imaging was performed on Olympus Fluoview 1000 MPE system coupled with Olympus BX61WI upright microscope with XLPLN 25x water-immersion objective (NA = 1.05). Excitation light was produced by a mode-locked titanium/sapphire MaiTai laser (Spectra-Physics) tuned to 860 mm with the output power set to 100 mW. Emitted light was collected in three channels: 460–500 nm (amyloid-bound methoxy-X04), 530–560 nm (dVenus fluorescence) and 575–630 nm (Texas Red dextran angiogram). Z-stacks were acquired with the resolution of 1 μm/pixel in X-Y dimension with the Z-step of 3 μm. For each mouse imaged site consisted of 2×4 512×512×240 μm stacks acquired with 10% overlap in X–Y dimensions resulting in an imaged field in visual cortex spanning roughly 1×2×0.24 mm 3 ((m−l)×(r−c)×(d−v)),. Imaging settings were kept constant in all imaging sessions. For time course imaging ( Supplementary Fig. 2 ) mice where anesthetized for the duration of imaging (~ 20 min) at each given time point after the end of visual stimulation and returned into the light deprivation box until the next time point. Mice with visible bleeding or infection under cranial window were excluded from the study, as well as the mice with vascularized tissue overgrowth (visualized with Texas Red dextran angiogram) under cranial window (approx. 40% of total mice). For the remaining mice, quality and stability of the cranial windows were assessed after each imaging session by (a) examining z-profile of Texas Red dextran fluorescent signal and (b) examining neuronal Arc::dVenus expression level distributions (see Fig. 2b, 2c ), since any changes in window clarity would significantly shift modal values and interquartile ranges of these distributions.
Mice with abnormally low absolute Texas
Red signal levels were excluded from the study (approx. 10% of the remaining mice). Postmortem examination of mice with windows deemed stable revealed no tissue growth between the cranial window and the brain surface, and no overt cortical inflammatory response was detected (see Supplementary Fig. 4 ). Additionally, z-profiles of Texas Red dextran-filled blood vessels from consecutive imaging sessions of the same mice were compared to each other to exclude possible window clouding between the sessions. No mice were disqualified from the study based on this examination. For the illustration of response “before” and “after” stimulation in Fig. 1c and Fig. 2a , mice were first placed into 60-hour light deprivation, stimulated in a striped cylinder as described above and imaged (time point “after” stimulation). Then they were allowed to recover from anesthesia, returned to the dark light-proof enclosure for another 60 hours and imaged again (time point “before” stimulation). Overview in vivo images for Supplementary Fig. 1 were obtained on an upright Olympus BX50WI microscope fitted with XLFluor 2x/340 objective with NA=0.14, YFP filter cube (ex/em: 500/545 nm), and using short arc mercury lamp as the excitation light source.
Image processing
All image processing was performed using Fiji package of NIH ImageJ software (fiji.sc; rsbweb.nih.gov/ij). Overlapping 3-D-stacks were stitched based on the angiogram channel using “3D Stitching” plug-in 51 . Background was subtracted and median filter applied. For quantification of Arc::dVenus expression levels, stitched stacks were z-projected and mean fluorescent signal in each individually detected cell body was measured. To determine 3d coordinates of amyloid plaques and neuronal cell bodies 3d stacks were segmented using “3D Object Counter” plug-in. When counting number of Arc::dVenus -positive neurons at different distances from plaques, we excluded from analysis real and virtual plaques that had no neurons in 100 μm radius (this criterion eliminated from the analysis roughly 40% of real and virtual plaques) since the Arc::dVenus -positive neurons are not distributed evenly across each dataset unlike the methoxy-X04-positive amyloid plaques.
Post-mortem tissue analysis
To obtain tissue for immunohistochemistry animals were transcardially perfused with ice-cold phosphate-buffered saline (PBS) followed by 4% paraformaldehyde in PBS. Brains were incubated in fixative at 4°C for additional 48 hours. 50 μm free-floating sections were cut on a Microm HM400 microtome. Following primary antibodies were used: chicken anti-GFP (1:500, Cat. No GFP-1020, Aves Labs); mouse SMI-312 (1:500, Cat. No SMI-312R, Covance); mouse SMI-32 (1:500, Cat. No SMI-32R, Covance, NJ); mouse NeuN (1:500, Cat. No MAB377, Millipore); mouse anti-Arc (1:1000, Cat. No sc-17839, Santa Cruz); rabbit Iba1 (1:500, Wako, Cat. No 019-19741). Secondary antibodies used were: goat-anti-chicken AlexaFluor488 (1:500, Cat. No A-11039, Molecular Probes); goat-anti-mouse Cy3 (1:500, Cat. No 115-165-166, Jackson ImmunoResearch); goat-anti-rabbit (1:500, Cat. No 111-165-144, Jackson ImmunoResearch). High resolution images for Figure 4 were acquired on a Zeiss LSM 510 META confocal microscope equipped with two-photon Coherent Chameleon laser and presented here as Z-projections. Overview low resolution images for Figure 1 were acquired on Zeiss Axio Observer.Z1 fluorescent microscope and aligned to Allen Brain reference atlas (brain-map.org). IHC images for Supplementary Fig. 1 and 4 were acquired on Zeiss Axio Observer.Z1. Stereological counting of Arc::dVenus -and NeuN-positive neurons was performed on Olympus CAST system in neuronal layer II/III of medial extrastriate visual cortex of mice that had not undergone window implantation and in vivo imaging. To define a region “near plaque” the edge of stereological counting frame (65×65 μm) was placed at a distance of 10 μm from a plaque’s center. Regions “far from plaque” were selected randomly with the condition that no plaque was present within at least 50 μm from the edge of the counting frame.
Statistical analysis
The normality of all datasets was tested using Kolmogorov-Smirnov method. Multiple comparisons of non-normal data was performed using Kruskal-Wallis method with Dunn’s post-test for pair-wise comparison. Multiple comparisons of normal data was performed using one-way or repeated measures two-way (when indicated) ANOVA with Bonferroni post-test for pair-wise comparison of mean values across mice. Simple comparison of two sets of normal data across mice was performed using unpaired Student’s t-test. Mann-Whitney test was used to compare two sets of non-normal data. Non-normal distributions of fluorescence intensity levels in Arc::dVenus neurons were compared using Wilcoxon rank-sum test with correction for clustering of values within individual mice. The association of Arc::dVenus intensity with reactivation probability ( Fig. 6d ) was tested by fitting a Generalized Estimating Equations logistic regression model using an independent working correlation matrix (accounting for the data clustering within mouse), implemented in SAS Version 9.3. All reported p-values are two-tailed.
Supplementary Material 1 Supplementary Figure 1 . Arc protein co-localizes with dVenus. Immunohistochemical staining for Arc and dVenus in different brain regions of Arc::dVenus mice sacrificed two hours after the end of visual stimulation. Time point of two hours was chosen as having sufficient levels of both Arc and dVenus proteins (Supplementary Fig. 4, 10 ). Green–dVenus, red–Arc. ( a ) Dentate gyrus region of hippocampal formation. Scale bar = 500 μm. ( b ) Neuronal layer II/III of medial extrastriate cortex. Scale bar = 200 μm. Occasional lack of colocalization of Arc::dVenus with endogenous Arc protein is expected due to different dynamics of Arc::dVenus and Arc mRNA expression in response to a stimulus as reported in 10 . Supplementary Figure 2 . Time course of Arc::dVenus expression in the visual cortex following 1-hour structured visual stimulation in the cylinder with vertical stripes. ( a ) Maximum intensity projections of in vivo image stacks of the same region of medial extrastriate visual cortex imaged at several time points after the end of stimulation. Scale bar = 100 μm. ( b ) Dynamics of Arc::dVenus fluorescence intensity in individual neurons over time. Data presented as medians with interquartile ranges. N= 4 mice, 2060 neurons. Supplementary Figure 3 . Low-resolution in vivo overview image of Arc::dVenus fluorescence in mouse right visual cortex. Arc::dVenus fluorescence was imaged 6 hours after standard 1-hour visual stimulation in an illuminated cylinder with vertical stripes ( a ) and after 7 hours of continuous visual stimulation with white light ( b ). In ( a ) Arc::dVenus signal is localized to the medial aspect of visual cortex, while in ( b ) it is concentrated more laterally. ( c ) Superimposed outlines of bright areas from ( b ) and ( c ). Scale bar = 1000 μm. Supplementary Figure 4 . Cranial window implantation causes no overt inflammatory response in the cortex of Arc::dVenus and Arc::dVenus × APP/PS1 mice. ( a – b ) Immunohistochemical staining for microglia marker Iba1( a )and activated astrocytes marker GFAP ( b ) of medial extrastriate visual cortex (layer II/III) of Arc::dVenus × APP/PS1 mouse and Arc::dVenus control littermate sacrificed 3 weeks after implantation of a cranial window. Left panels–right medial extrastriate visual area (covered by cranial window); right panels–left medial extrastriate visual area (contralateral to cranial window). Red–Iba1 ( a ) / GFAP ( b ); white–amyloid plaques stained with methoxy-X04. Scale bar = 300 μm. Supplementary Table 1. Summary of effects of AD-related pathologies on activity-induced or basal Arc expression reported in the literature. Green entry–reported overall increase of Arc protein or RNA linked to AD; red–decrease; blue–no change or both directions. Ms, mouse; hu, human; DG, dentate gyrus of hippocampus; MFC, medial frontal cortex; NFT, neurofibrillary tangles; LPS, lipopolysaccharides.
📊 Figures
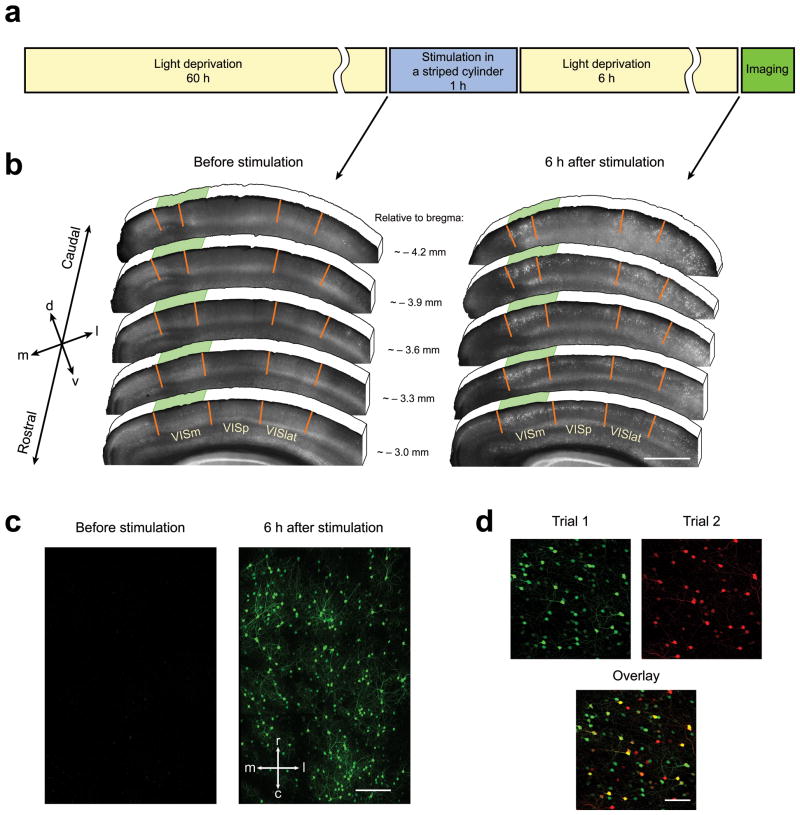
Figure 1
Arc::dVenus expression pattern in the visual cortex following structured light stimulation. ( a ) Visual stimulation paradigm. Prior to stimulation mice were single-housed in their home cages in the d...
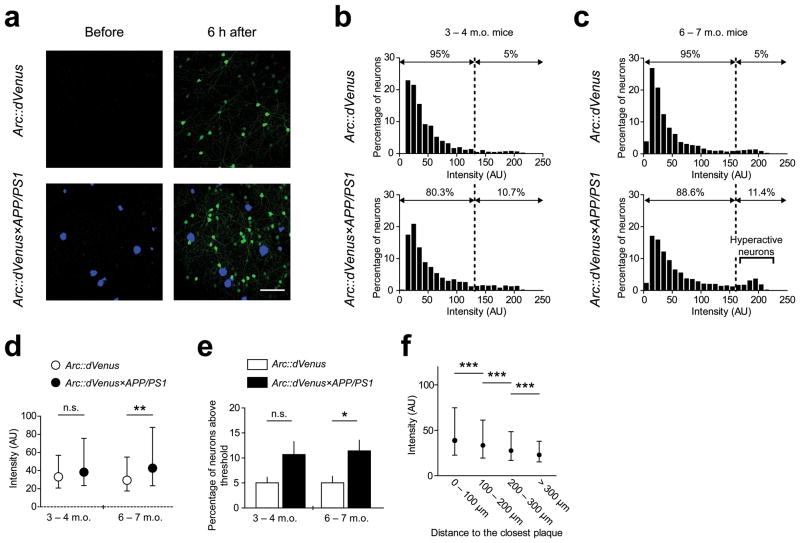
Figure 2
Effect of amyloid plaques on stimulus-induced Arc::dVenus expression levels ( a ) Example of maximum intensity projection of in vivo imaging dataset used for quantification. Blueu2013amyloid plaques v...
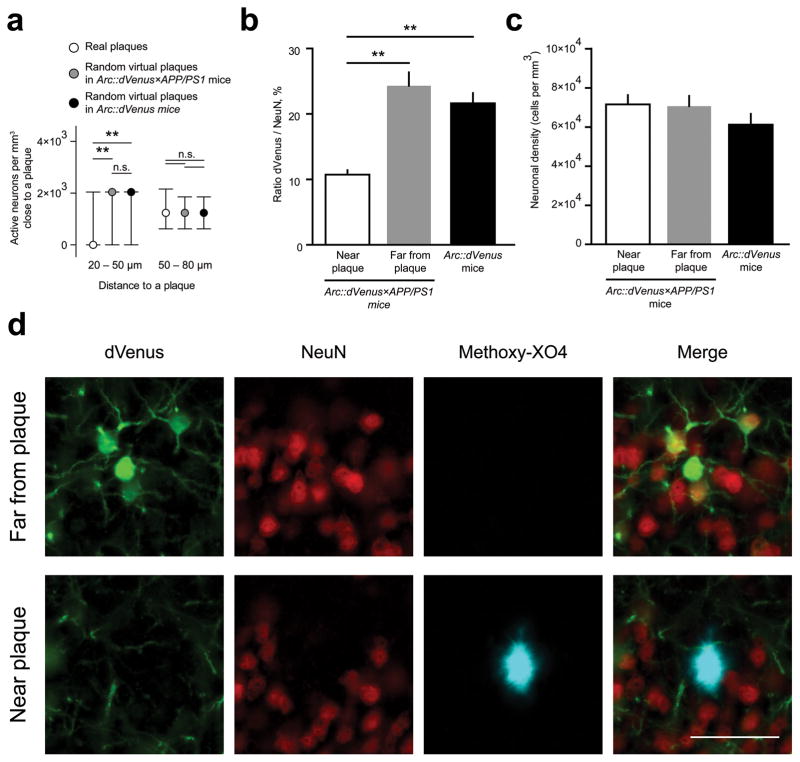
Figure 3
Local effect of amyloid plaques on spatial distribution of Arc::dVenus-positive neurons ( a ) Number of detectable neurons following stimulation is decreased in 20u201350 u03bcm range from the plaque ...
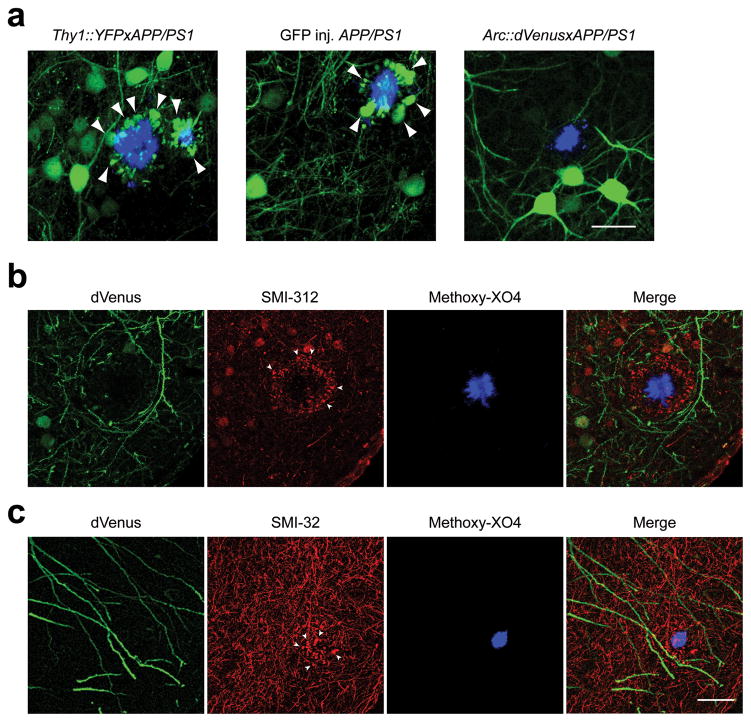
Figure 4
Neurons with dystrophic neurites do not express Arc::dVenus in response to a stimulus. ( a ) Maximum intensity projections of in vivo image stack of Thy1::YFP u00d7 APP/PS1 transgenic mouse, APP/PS1 m...
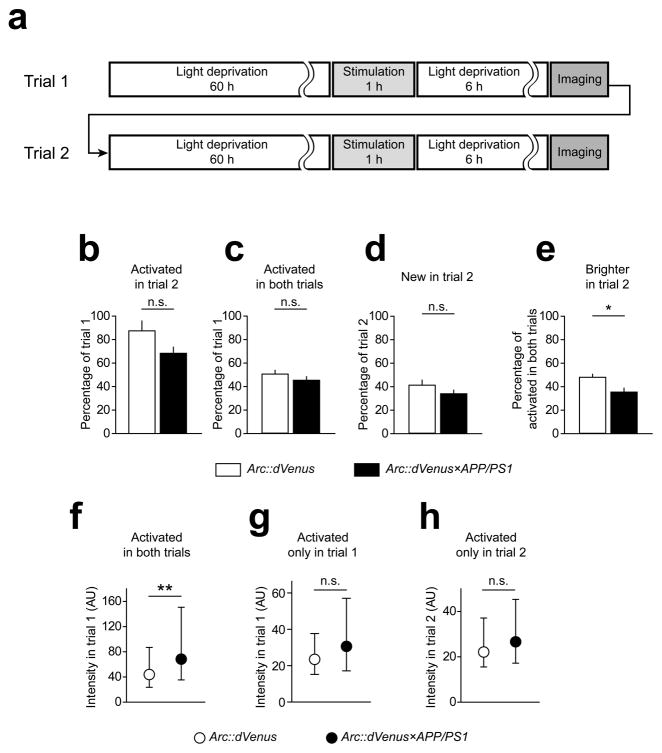
Figure 5
Arc::dVenus expression in repetitive stimulation paradigm ( a ) Repeated visual stimulation paradigm. Upon the completion of the first imaging session(trial 1), mice were returned to the light-proof d...
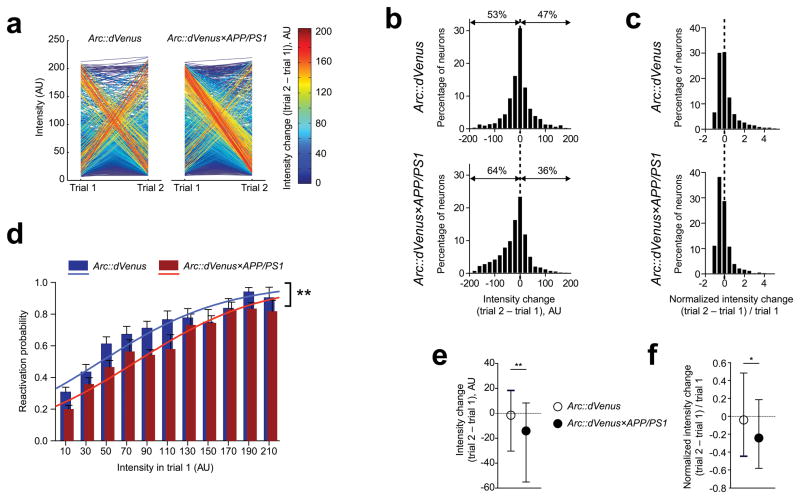
Figure 6
Stimulus-specific Arc::dVenus expression is affected by amyloid plaque pathology ( a ) Change of levels of visual stimulus-induced Arc::dVenus expression in two consecutive trials. Each line connects ...
Figure images are served from the NIH/NLM PubMed Central Open Access Subset or Europe PMC; copyright remains with the publishers and authors.
💬 Discussion
0 commentsNo comments yet. Be the first to start a discussion!
Leave a Comment