Abstract
Organelle interactions play a significant role in compartmentalizing metabolism and signaling. Lipid droplets (LDs) interact with numerous organelles, including mitochondria, which is largely assumed to facilitate lipid transfer and catabolism. However, quantitative proteomics of hepatic peridroplet mitochondria (PDM) and cytosolic mitochondria (CM) reveals that CM are enriched in proteins comprising various oxidative metabolism pathways, whereas PDM are enriched in proteins involved in lipid anabolism. Isotope tracing and super-resolution imaging confirms that fatty acids (FAs) are selectively trafficked to and oxidized in CM during fasting. In contrast, PDM facilitate FA esterification and LD expansion in nutrient-replete medium. Additionally, mitochondrion-associated membranes (MAM) around PDM and CM differ in their proteomes and ability to support distinct lipid metabolic pathways. We conclude that CM and CM-MAM support lipid catabolic pathways, whereas PDM and PDM-MAM allow hepatocytes to efficiently store excess lipids in LDs to prevent lipotoxicity.
🔬 Techniques
💻 Software
✨ Fluorophores
🧪 Sample Preparation
🔬 Cell Lines
🏭 Microscope Brands
🧪 Reagent Suppliers
📷 Detectors
🔎 Objectives
🎨 Filters
💻 Software Details
💻 Code & Software
💾 Data Repositories
🏛️ Research Organizations (ROR)
Affiliated research institutions:
📋 Methods
RESOURCE AVAILABILITY
Lead contact Further information and requests for resources and reagents should be directed to and will be fulfilled by the lead contact, Douglas Mashek ( dmashek@umn.edu ).
Materials availability
All unique/stable reagents generated in this study are available from the lead contact with a completed Materials Transfer Agreement.
Data and code availability
The two-color single molecule cross-correlation-colocalization filtering code has been up loaded to GitHub (PuchnerLab GitHub). The proteomics raw data and datasets have been deposited on Massive: https://massive.ucsd.edu/ProteoSAFe/static/massive.jsp Any additional information required to reanalyze the data reported in this paper is available from the lead contact upon request.
EXPERIMENTAL MODEL AND SUBJECT DETAILS Animal experimentation
Mice and anti-sense oligonucleotide administration
All animal protocols were approved by the University of Minnesota Institutional Animal Care and Use Committee. Male 8–12-week-old C57BL6/J mice were obtained from Harlan Laboratories and housed under controlled temperature and lighting (20–22°C; 14:10-h light-dark cycle). The mice were fed a purified control diet (TD 94045; Harlan Teklad Premier Laboratory) and acclimatized for 1 week before any experimental procedure. Control and Plin5 antisense oligonucleotides (ASOs; Ionis Pharmaceuticals) were given via intraperitoneal injection twice per week at a dose of 40 mg/kg. ASO injections were carried out for three weeks, all mice were euthanized for liver tissue and serum collection. Knockdown was confirmed through protein (Western blot) analysis.
METHOD DETAILS Peridroplet and cytosolic mitochondrial isolation
All procedures were performed using pre-chilled equipment and solutions. The following method was adapted from Benador et al. 11 Livers from 12–16-week-old mice were harvested, rinsed in PBS, minced, and suspended in 6 mL Sucrose-HEPES-EGTA supplemented with FA-free BSA (SHE+BSA; 250 mM sucrose, 5 mM HEPES, 2 mM EGTA, 2% FA-free BSA, pH 7.4). The resuspended hepatic tissue was mechanically disrupted with 15 strokes in a glass Teflon Dounce homogenizer. The homogenate was then transferred to a 50 mL falcon tube and diluted up to 10 mL in ice-cold SHE+BSA. The lysates were centrifuged in an Avanti J-15R (Beckman Coulter) swinging bucket rotor at 900×g for 10 min at 4°C. The resulting sample was examined to ensure that a fat cake (containing PDM and LD) was floating on the top of the supernatant (containing CM) and cell debris was pelleted. Using a glass pasture pipette, the fat cake was removed from the supernatant. The fat cake was resuspended in SHE+BSA. The supernatant was transferred to a fresh pre-chilled 50 mL falcon tube and both the fat cake and supernatant were re-centrifuged at 900×g 10 min 4°C. Post centrifugation, the original fat cake and the remaining fat cake on the supernatant were combined and transferred into 2 mL Eppendorf tubes, being careful to remove only the fat cake and as little of the supernatant as possible. The supernatant containing the CM was also transferred to 2 mL Eppendorf tubes and the two fractions were centrifuged at 9,000×g for 10 min at 4°C. The mitochondrial pellets were re-suspended in SHE+BSA and centrifuged with the same settings twice more. Mitochondria were then re-suspended in SHE without BSA and protein concertation was determined by BCA (Thermo Scientific). In experimental designs where LDs were also needed, the residual fat cake stripped of PDM was kept. The fat cake was further purified to obtain LDs by transferring the fat cake to a 2mL Eppendorf tube, suspending them in SHE+BSA, and then centrifuged at 21,000×g for 20 min. Buoyant LDs were removed and placed into a fresh 2 mL tube using a glass pasture pipette and suspended in SHE without BSA. The LDs were again centrifuged at 21,000×g for 20 min before protein concentration was determined with BCA.
Show full methods section
RESOURCE AVAILABILITY
Lead contact Further information and requests for resources and reagents should be directed to and will be fulfilled by the lead contact, Douglas Mashek ( dmashek@umn.edu ).
Materials availability
All unique/stable reagents generated in this study are available from the lead contact with a completed Materials Transfer Agreement.
Data and code availability
The two-color single molecule cross-correlation-colocalization filtering code has been up loaded to GitHub (PuchnerLab GitHub). The proteomics raw data and datasets have been deposited on Massive: https://massive.ucsd.edu/ProteoSAFe/static/massive.jsp Any additional information required to reanalyze the data reported in this paper is available from the lead contact upon request.
EXPERIMENTAL MODEL AND SUBJECT DETAILS Animal experimentation
Mice and anti-sense oligonucleotide administration
All animal protocols were approved by the University of Minnesota Institutional Animal Care and Use Committee. Male 8–12-week-old C57BL6/J mice were obtained from Harlan Laboratories and housed under controlled temperature and lighting (20–22°C; 14:10-h light-dark cycle). The mice were fed a purified control diet (TD 94045; Harlan Teklad Premier Laboratory) and acclimatized for 1 week before any experimental procedure. Control and Plin5 antisense oligonucleotides (ASOs; Ionis Pharmaceuticals) were given via intraperitoneal injection twice per week at a dose of 40 mg/kg. ASO injections were carried out for three weeks, all mice were euthanized for liver tissue and serum collection. Knockdown was confirmed through protein (Western blot) analysis.
METHOD DETAILS Peridroplet and cytosolic mitochondrial isolation
All procedures were performed using pre-chilled equipment and solutions. The following method was adapted from Benador et al. 11 Livers from 12–16-week-old mice were harvested, rinsed in PBS, minced, and suspended in 6 mL Sucrose-HEPES-EGTA supplemented with FA-free BSA (SHE+BSA; 250 mM sucrose, 5 mM HEPES, 2 mM EGTA, 2% FA-free BSA, pH 7.4). The resuspended hepatic tissue was mechanically disrupted with 15 strokes in a glass Teflon Dounce homogenizer. The homogenate was then transferred to a 50 mL falcon tube and diluted up to 10 mL in ice-cold SHE+BSA. The lysates were centrifuged in an Avanti J-15R (Beckman Coulter) swinging bucket rotor at 900×g for 10 min at 4°C. The resulting sample was examined to ensure that a fat cake (containing PDM and LD) was floating on the top of the supernatant (containing CM) and cell debris was pelleted. Using a glass pasture pipette, the fat cake was removed from the supernatant. The fat cake was resuspended in SHE+BSA. The supernatant was transferred to a fresh pre-chilled 50 mL falcon tube and both the fat cake and supernatant were re-centrifuged at 900×g 10 min 4°C. Post centrifugation, the original fat cake and the remaining fat cake on the supernatant were combined and transferred into 2 mL Eppendorf tubes, being careful to remove only the fat cake and as little of the supernatant as possible. The supernatant containing the CM was also transferred to 2 mL Eppendorf tubes and the two fractions were centrifuged at 9,000×g for 10 min at 4°C. The mitochondrial pellets were re-suspended in SHE+BSA and centrifuged with the same settings twice more. Mitochondria were then re-suspended in SHE without BSA and protein concertation was determined by BCA (Thermo Scientific). In experimental designs where LDs were also needed, the residual fat cake stripped of PDM was kept. The fat cake was further purified to obtain LDs by transferring the fat cake to a 2mL Eppendorf tube, suspending them in SHE+BSA, and then centrifuged at 21,000×g for 20 min. Buoyant LDs were removed and placed into a fresh 2 mL tube using a glass pasture pipette and suspended in SHE without BSA. The LDs were again centrifuged at 21,000×g for 20 min before protein concentration was determined with BCA.
Purification of CM and PDM for quantitative proteomics
Samples for quantitative proteomic analysis were collected from four-control ASO and four PLIN5 ASO-treated mice. CM and PDM from these mice were harvested as described above. After the final pelleting of CM and PDM, mitochondrial fractions were resuspended in homogenate buffer [10 mM Tris-base pH 7.0 with protease (Complete protease inhibitor cocktail, Roche, Basel Switzerland), phosphatase (PhosSTOP, Sigma-Aldrich, St. Louis, MO), and deacetylase inhibitors (De-acetylase Cocktail, MedChem Express, Monmouth Junction, NJ)], in place of the SHE without BSA. The resuspended mitochondrial pellets were loaded onto a sucrose step gradient (4 mL 35% sucrose, 4 mL 25% sucrose) and centrifuged at 36,000 rpm in a Beckman SW41 swinging bucket rotor for 4 h. The mitochondria from the CM and PDM fractions appeared as a dark-brown pellet at the bottom of the tube. At this stage, the samples can be snap-frozen. This method is adapted from the full cellular fractionation described in. 73 For proteomic analysis, mitochondria samples were extracted with proteomic lysis buffer [PLB1; 7 M urea, 2 M thiourea, 0.4 triethylammonium bicarbonate, pH 8.5, 20% acetonitrile, 10 mM tris (2-carboxyethyl) phosphine (TCEP), 40 mM chloroacetamide]. The samples were pipetted up and down several times and transferred to a PCT tube for the Barocycler NEP2320 (Pressure Biosciences, Inc., South Easton, MA) and cycled between 35 kPSI for 20 s and 0 kPSI for 10 s for 60 cycles at 37°C. Samples were centrifuged at 13000×g for 10 min. The supernatants were transferred to new 1.5 mL microfuge Eppendorf Protein LoBind tubes. Aliquots for each sample were taken for protein concentration determination by Bradford assay. A 25 μg aliquot of each sample was transferred to a new 1.5 mL Eppendorf Protein LoBind tube and brought to the same volume with PLB1. In addition, a pooled sample was created by combining equal amounts of each sample to use as a bridge sample across multiple TMT experiments. All samples were diluted five-fold with water, and then trypsin (Promega, Madison, WI) was added in a 1:40 ratio of trypsin to total protein. Samples were incubated overnight for 16 h at 37°C. After incubation, the samples were frozen at −80°C and dried in a vacuum concentrator. Each sample was cleaned with a 1 CC Waters Oasis MCX cartridge (Waters Corporation, Milford, MA), and eluates were vacuum dried and resuspended in 100 mM triethylammonium bicarbonate, pH 8.5 to a final concentration of 1 μg/μL. For each channel within the TMT10plex a 20 μg aliquot of the appropriate sample was made, and the samples were labeled with the corresponding TMT10plex Isobaric Label Reagent (Thermo Scientific, Waltham, MA) per the manufacturer’s protocol. After TMT labeling, all the samples were multiplexed together into a new 1.5 mL microfuge tube. The TMT sample was dried down in vacuo . The sample was cleaned with a 1 CC Waters Oasis MCX solid phase extraction cartridge (Waters Corporation, Milford, MA), and the eluate was dried in vacuo . The samples were offline fractionated as described previously. 74 Each fraction was desalted on a C18 stage tip 75 and reconstituted for analysis. Samples were separated on an Easy nLC-1000 UHPLC and analyzed by tandem mass spectra in a data-dependent manner with a Thermo Fisher Orbitrap Fusion mass spectrometer. In brief, we processed the MS peptide spectra using Sequest (Thermo Fisher Scientific, San Jose, CA, in Proteome Discoverer 2.2). The mouse (taxonID 10090) Universal Proteome (UP000000589) target protein sequence database was downloaded from UniProt ( www.uniprot.org/ ) on Nov 19, 2019, and was merged with a common lab contaminant protein database ( http://www.thegpm.org/cRAP/index.html ); the number of protein sequences was 55,180. The digestion enzyme was trypsin, the fragment ion mass tolerance was 0.08 Da and the precursor tolerance was 15 ppm. We set the variable modifications for oxidation of methionine (+15.9949), pyroglutamic acid conversion from glutamine (−17.0265), deamidation of asparagine (+0.9840), protein N-terminal acetylation (+42.0106) and TMT 10plex (+229.1629) modification of lysine and peptide N-terminus. We specified carbamidomethyl of cysteine as a fixed modification. We used Scaffold Q+ (version 4.8.9, Proteome Software Inc., Portland, OR) for validation of tandem MS-based peptide and protein identifications. Peptide identifications were accepted if they could be established at greater than 94.0% probability to achieve an FDR less than 1.0% [mitochondrial proteomics] and greater than 91.0% probability to achieve an FDR less than 1.0% [MAM proteomics] by the Percolator posterior error probability calculation. 76 Protein identifications were accepted if they could be established at greater than 5.0% probability to achieve an FDR less than 1.0% and contained at least 2 identified peptides. Protein probabilities were assigned by the Protein Prophet algorithm. 77 Proteins that contained similar peptides and could not be differentiated based on MS/MS analysis alone were grouped to satisfy the principles of parsimony. Proteins sharing significant peptide evidence were grouped into clusters. We used Scaffold Q+ (version 5.0.1, Proteome Software Inc., Portland, OR) for TMT-based peptide and protein quantification. Reporter ion intensities were adjusted by correction factors in all samples according to the algorithm described in i-Tracker 78 according to the TMTpro 16plex Lot Number WF324548 product data sheet from ThermoFisher Scientific. Normalization was performed iteratively (across samples and spectra) on intensities, as described in statistical analysis of Relative Labeled Mass Spectrometry Data from Complex Samples Using ANOVA. 79 Pooled protein samples from all samples in the two TMT experiments were used for normalization, using two TMT channels for each experiment. Medians were used for averaging. Spectra data were log-transformed, pruned of those matched to multiple proteins, and weighted by an adaptive intensity weighting algorithm. Differentially expressed proteins were determined by applying a permutation test with an unadjusted significance level p < 0.05 corrected by Benjamini-Hochberg. 80 Heatmap and pathway analysis of proteomics data Pathway analysis, hierarchical clustering, and heatmap production were carried out as previously described. 81 – 87 The hierarchical clustering and heat maps were generated using Cluster 2.0 from the Eisen Laboratory modified by Michiel de Hoon ( http://bonsai.hgc.jp/~mdehoon/software/cluster/ ). Java Tree Viewer was used to view and color the heatmap. Isolated mitochondria respirometry using seahorse The protein content of CM and PDM fractions were measured using BCA reagent, diluted to 0.1–0.4 μg/μL protein, and 2.5–10 μg protein (25–50 μL suspension) was added to each well in the Seahorse plate. The plate was immediately spun at 2,000×g for 20 min at 4°C to pellet mitochondria. Next, 130–150 μL of the appropriate mitochondrial assay buffer was added to the wells to bring up the volume to 180 μL before running the Seahorse assay. Complex I mediated respiration was measured by adding mito assay buffer containing 500 μm malate 5 mM pyruvate to the mitochondria which were followed by the sequential injections of 1) ADP (2 mM), 2) oligomycin (1.5 μM), 3) FCCP (1 μM), and 4) rotenone (0.5 μM)/antimycin A (0.5 μM). Complex II mediated respiration was measured by adding mito assay buffer containing 10 mM succinate and 5 μM rotenone to the mitochondria which was followed by the sequential additions of 1) ADP (2 mM), 2) oligomycin (1.5 μM), 3) FCCP (1 μM), and 4) malonate (mM). Complex III mediated respiration was measured by adding mito assay buffer without and substrates to the mitochondria which was followed by the sequential additions of 1) rotenone (5 μM)/malonate (5 mM), 2) duroquinol (2 μM), and 3) antimycin A (0.5 μM). Complex IV mediated respiration was measured by adding mito assay buffer without substrates to the mitochondria followed by the sequential additions of 1) rotenone (0.5 μM), malonate (5 mM), antimycin A (0.5 μM), 2) TMPD (1 mM), ascorbate (20 mM), and 3) sodium azide (20 mM). Isolated mitochondria FA oxidation assay using [ 14 C]oleate Methods for measuring FA oxidation were adapted from Huynh et al. 88 , 89 In brief, mitochondria pellets are resuspended in base mitochondria respiration buffer (MRB; 100 mM Sucrose, 10 mM Tris-HCL pH 7.4, 5 mM potassium phosphate, 0.2 mM EDTA, pH 8.0, 80 mM potassium chloride, 1 mM magnesium chloride, 2 mM carnitine, 0.1 mM malate, 0.05 mM coenzyme A, 2 mM ATP, 1 mM DTT pH 8.0). To ensure that the isolated mitochondria contents could be normalized and maintained respiratory function, we plated 50 μg total mitochondria in a 96-well plate, stained the mitochondria with MitoTracker Deep Red, and determined fluorescent intensity of mitochondria in CM and PDM ( Figure 2A ). We also plated 50 μg total mitochondria and stained them with the membrane potential sensitive dye TMRE (Abcam). The MitoTracker staining confirmed that protein abundance correlated with total mitochondrial content, and the TMRE indicated that both CM and PDM maintained mitochondrial membrane potential through the isolation procedures. The protein content of CM and PDM mitochondrial fractions were then measured using BCA reagent, diluted to 2 μg/μL protein, and 100 μg protein (50 μL suspension) was added to 350 μL MRB supplemented with 0.7% FA free BSA/500 μM oleate/0.5 μCi [ 14 C]oleate. Samples were then incubated at 37°C for 1 h and quenched by the addition of 200 μL 1M perchloric acid, vortexed, and then centrifuged at >14,000×g for 15 min at room temperature. 400 μL of the supernatant was transferred to a scintillation vial and the radioactive acid-soluble products were counted on a scintillation counter. For maximal respiration measures, 2 mM ADP was introduced to the reaction mixture. Inhibitors, 60 μM etomoxir, 100 μM 2-APB, and 25 μM clotrimazole were also introduced to inhibit FA uptake into the mitochondria, and MAM, respectively. Isolated mitochondria TCA metabolite measurements using [ 13 C]palmitate Similar to [ 14 C]oleate studies, CM and PDM were resuspended in MRB and normalized to 10 μg/μL protein, and 500 μg protein (50 μL suspension) was added to 350 μL MRB supplemented with 0.7% FA free BSA/250 μM oleate/50 μM [U 13 C]palmitate. Samples were then incubated at 37°C for 1.5 h and quenched by snap freezing the samples in liquid N 2 and lyophilized. For sample processing, 400 μL of ice-cold 2:2:1 acetonitrile:methanol:water containing the internal standard D8-valine was added to the lyophilized samples, and these mixtures were vortexed for 10 min, rotated at −20°C for 1 h, and centrifuged at 21,000×g at 4°C for 10 min. The supernatants were transferred to new microcentrifuge tubes and dried to completeness using a SpeedVac vacuum concentrator. Dried samples were resuspended in 30 μL of 1:1 acetonitrile:water, vortexed for 10 min, and stored at −20°C overnight. Resuspended samples were centrifuged at 21,000×g at 4°C for 10 min and supernatants were transferred to autosampler vials for analysis. 2 μL of the prepared samples were separated using a Thermo Vanquish Flex UHPLC and data were acquired using a Thermo Q Exactive MS as previously described. 90 LC–MS data were processed using the Thermo Scientific TraceFinder (5.1) software. Targeted metabolites were identified using the University of Iowa Metabolomics Core facility standard-confirmed, in-house library defining accurate mass, retention time, and MS/MS fragmentation pattern when available.
Western blotting
Cell lysates (30–50 μg protein) were separated on 10–12% tricine gels using a Mini-Protean II cell (Bio-Rad lab, Hercules, CA) system at constant amperage (30 mA per gel) for about 3 h. Proteins were then transferred onto PVDF membranes at constant voltage (90 V) for 2 h. Blots were stained with Ponceau S to confirm uniform protein loading 91 , 92 before blocking in 5% BSA or 7% non-fat milk in TBST (10 mM Tris-HCl, pH 8, 100 mM NaCl, 0.05% Tween 20) for 1 h. Blots were incubated with specific poly- or monoclonal antibodies overnight and were developed with IRDye 800CW (LI-COR) or IRDye 680RD (LI-COR) secondary antibodies. To visualize the bands of interest, blots were scanned using the LI-COR Odyssey imaging system (Lincoln, NE). Protein bands were quantitated by densitometric analysis after image acquisition using NIH Scion Image to obtain relative protein levels expressed as integrated density. All values were normalized to Ponceau S staining. 93 – 96 Antibodies were purchased or obtained from the following sources; Total-Plin5 (Progen; Heudelberg, Germany), OXPHOS ACADVL, ACADM, ACAA2, CS, ACO1, IDH3, SUCLG1, FH, MDH2, Catalase, COXIV, Calreticulin, VAP-B, MIGA2, VAPB, SLC25a1, FAS, ACSL1, ACSL3, ACSL 5, SCD1, FADS6, AGPAT2, CPT1α, BIP, Calreticulin, and PLIN2 [Barbara Atshaves developed in 72 ].
Cell culture
All cells were maintained in a humidified incubator at 37°C under 5% CO 2 . AML12 cells were obtained from the ATCC (Manassas, VA). Cells were grown in DMEM:F12 (1:1) supplemented with 10% FBS, ITS (10 mg/mL insulin, 5.5 mg/mL transferrin, 5 ng/mL selenium), and 40 ng/mL dexamethasone. For imaging experiments, cells were treated under one of the following conditions: fed media [DMEM:F12 (1:1) supplemented with 10% FBS, ITS (10 mg/mL insulin, 5.5 mg/mL transferrin, 5 ng/mL selenium, and 40 ng/mL dexamethasone], fasting media (DMEM phenol free basic media supplemented with 0.5 g/L D-glucose, 5.5 g/L HEPES, 2.2 g/L Sodium bicarbonate, pH 7.4), and either fed or fasting media +250 μM oleate complexed to FA-free BSA at a 3:1 ratio (FA:BSA). For experiments with the MAM sensor SPLICSs (SPLICS short measuring 10.4 nm mitochondria-ER interactions), AML12 cells were transduced with pLV-Bsd-TRE-SplitGFP (SPLICSs-MT-ER)-CMV-rtTA and screened for clones using blasticidin. The SPLICSs construct was induced with 500 nM tetracycline the night before. Cells were countered stained for mitochondria using MitoTracker Deep Red (Thermo) and AutoDOT neutral lipid stain (mondansylpentane [MDH] Lipid Droplet Staining Tool; Absepta) 20 min prior to imaging. For the SMLM studies, AML12 cells were transfected with pSEMS-TOM20-HaloTag (Addgene#111135) using Qiagen’s Effectine transfection reagent. Two types of experiments were carried out, one where BODIPY-C 12 FL (BODIPY-C 12 488nm) was added exogenously while the cells were in fed or fasting media and the second where cells were loaded overnight with BODIPY-C 12 FL and non-fluorescent oleate so that the FA was in endogenous lipid stores. In both experimental set-ups, 150 nM BODIPY-C 12 FL was complexed to FA-free BSA. For the overnight loading cells were treated with 150 nM BODIPY-C 12 FL/250 μM oleate complexed to FA-free BSA. Cells were placed in the corresponding fed or fasting media for 4 hrs, stained with AutoDOT LD stain and HaloTag reagent JF646 for 30 min, washed, then placed in phenol-free media for imaging. Microscope setup and imaging for SMLM studies A Nikon inverted microscope (Eclipse Ti-E) equipped with a perfect focus system and a motorized sample stage (Pecon) maintained at 37°C and 5% CO 2 was used for all experiments. All movies were recorded on an Andor iXon 897 Ultra DU-897U electron-multiplying charge-coupled detector (EMCCD) camera, which was cooled to −70°C and set to a prem-amp gain of 5.1 and an EMCCD gain of 30. The camera was calibrated as described in our previous paper with camera calibration 35 and the calculation of photons/count. 35 – 37 The 3 excitation lasers (405 nm, 561 nm, 640 nm OBIS-CW, Coherent Optics) were aligned, expanded, and focused into the back focal plane of the objective (Nikon CFI 100× 1.49 NA oil immersion) using a variety of dichroic mirrors, beam expanders, and lenses. The laser intensity was controlled digitally by a computer. A quad band dichoric mirror (ZT405/488/561/640rpc; Chroma) was used to separate fluorescence emission from excitation light. The fluorescence emission was further split into red and far-red channels by a dichroic longpass beamsplitter (FF652-Di01; Semrock) and further filtered by bandpass filters: ET610/75 (Chroma) in the red and FF731/137 (Semrock) in the far-red channel. Programmable shutter sequences were loaded on an NI-DAQ board to synchronize the laser outputs with camera frame duration. The HAL4000 software (Zhuang lab Github: https://github.com/ZhuangLab/storm-control ) was used for adjusting laser powers, programmable shutter sequence output, programming camera settings, and image acquisition as described. 35 – 37 In brief, for three-color imaging of AutoDOT, BODIPY-C 12, and Tom20-Haloag (JF646), an 11-frame shutter sequence at 20 Hz was employed with one 405 nm excitation frame (~0.5 W/cm 2 ) for conventional imaging of LDs followed by five frames of 561 nm excitation (~1 kW/cm 2 ) for D ∥ states imaging of BODIPY-C 12 and five frames of 640 nm excitation (~2 kW/cm 2 ) for JF646 imaging. Single-molecule signals of D ∥ states of BODIPY-C 12 dyes and JF646 dyes were detected in the red and far-red channels, respectively. Emission of the AutoDOT dye localized to LDs was detected in the red channel with 405 nm excitation due to its broad emission spectrum and was used to identify individual LDs ( Figure 3 ). The shutter sequence was repeated for ~7000 frames to collect enough BODIPY-C 12 and Tom20-HaloTag-JF646 localizations to reconstruct a well-sampled two color SMLM image. Bead calibration for two-channel alignment of single molecule localizations for SMLM co-localization quantification To accurately superimpose localizations from the far-red and to the red microscope channel, a bead calibration experiment was performed on each imaging day with fluorescent microsphere beads (TetraSpeck microspheres, Invitrogen T7279) that were excited at 561 nm and 640 nm and detected in both channels. Fluorescence puncta of individual beads were sparsely distributed throughout the field of view in each channel and fitted with Gaussians as in SMLM experiments. From the coordinates of each bead in far-red and red channels, a third-degree polynomial transformation was determined that maps an arbitrary coordinate from the far red to the red channel. This transformation was verified by transforming the localizations from the different sets of beads to have a mean accuracy of 18.23 nm. 97 The obtained transformation was used to superimpose the Tom20-HaloTag-JF646 localizations from the far-red channel on the BODIPY-C 12 localizations and LD signal in the red channel for further co-localization analysis.
Single-molecule localization analysis The Insight3 software from Xiaowei
Zhuang’s group ( https://doi.org/10.5281/zenodo.3528331 ) was used to identify single molecules and to fit them with 2D Gaussians with the following parameters: 7 × 7 pixel ROI, widths between 250 and 700 nm, and a minimum of 100 photons. The x- and y coordinates of the localizations, along with the intensity, width, background, frame number, and other parameters were saved in a single molecule localization list. Three-color images are obtained by transforming the JF646 localizations from the far-red channel to the red channel and by rendering JF646 and BODIPY-C 12 localizations as 2D-Gaussians on the top of averaged conventional fluorescence image of LDs. Co-localization analysis to determine the density of BODIPY-C 12 in PDM and CM To measure the degree of co-localization of BODIPY-C 12 in PDM and CM under each condition, we assigned BODIPY-C 12 and JF646 localizations to each mitochondrial fraction in the following way. First, the conventional fluorescence image of LDs was averaged and thresholded using a locally low-rank soft thresholding approach to remove background fluorescence and identify individual LDs. Thresholded images were then converted into a binary mask using the imbinarize function in MATLAB to identify boundaries of LDs. Next, a contour was drawn around identified LDs using the bwboundaries function in MATLAB and scaled by a factor of 1.2 to include mitochondria that are wrapped around or in contact with LDs. This scaling was confirmed to include PDM fractions across all datasets. TOM-20-HaloTag JF646 localizations within the scaled contour but outside the LD boundaries were considered PDM and all other localizations outside the scaled contour were considered CM. BODIPY-C 12 localizations, within a 120 nm distance from a PDM JF646 localization were considered to be associated with PDMs and BODIPY-C 12 localizations within a 120 nm from a CM JF646 localization were considered to be associated with CMs. This distance threshold, determined by cross-correlation analysis accounts for the localization precision, limited sampling of the mitochondrial surface and potential motion of mitochondria during the data acquisition time. Details for this analysis can be found in ref. 38 Using the area of the PDM contour surrounding the LDs and the number of co-localized BODIPY-C 12 localizations, the density of BODIPY-C 12 in PDM was determined. For estimating the CM density of BODIPY-C 12 , the number of co-localized BODIPY-C 12 outside the scaled contour around LDs is divided by the cytoplasmic area (cell area minus the area of the nucleus and scaled LD area). The density of BODIPY-C 12 across different movies was normalized by the number of data acquisition frames for accurate comparison (see 37 ). To account for any bias and systemic error in determining BODIPY-C 12 densities in the PDM and CM areas, the ratio of the CM and PDM BODIPY-C 12 density was calculated for the relative measure of FA redistribution under different imaging conditions. CM and PDM lipid incorporation assays using [ 14 C]oleate and [ 14 C]acetate Lipid incorporation assays were adapted from. 98 In summary, PDM and CM isolated as described above were normalized to 2 μg/μL in MRB. LDs kept from the isolation and purified as described above were also suspended in MRB at 5 μg/μL. PDM and CM were combined with the purified LDs in a 1:1 ratio (25 μL mitochondria/25 μL LDs; 50 μg/250 μg). Mitochondria and LDs were allowed to incubate together for 20 min before the addition of 350 μL lipid incorporation buffer (LIB; 100 mM Sucrose, 10 mM Tris-HCL pH 7.4, 5 mM potassium phosphate, 0.2 mM EDTA pH 8.0, 80 mM potassium chloride, 1 mM magnesium chloride, 2 mM carnitine, 0.1 mM malate, 0.05 mM coenzyme A, 1 mM ATP, 1 mM ADP, 1 mM DTT, 0.7% FA free BSA/500 μM oleate/1 μCi [ 14 C]oleate, pH 8.0). Mitochondria-LDs were incubated at 37°C for 90 min in the reaction mixture. Chloroform-methanol (400 μL; 1:2 v/v) was added to terminate the reaction. Samples were vortexed and allowed to extract at −20°C for 1 h. An additional 700 μL chloroform was added to the reaction mixture, vortexed again, then centrifuged at 1,500×g for 10 min. The hydrophobic-chloroform phase was transferred to a glass tube and dried under nitrogen. The dried lipid extracts are then resuspended in 30 μL chloroform and 15 μL were then spotted on Analtech Preadsorbent Silica gel HL thin-layer chromatography (TLC) plates and 5 μL of the resuspension was added to scintillation fluid and counted. TLC plates were run to separate major lipid species PL, cholesterol, DAG, FFA, TAG, and CE using hexane, diethyl ether, and acetic acid (4/1/0.1 v/v/v) mobile phase. Radioactivity of the TLC plates was counted on a Bioscan AR-2000 TLC plate scanner and analyzed using WinScanV3 software ( Figure 4B ). Experiments were repeated using LIB with 5 μCi [ 14 C]acetate in place of oleate to determine de novo lipogenesis in place of FA esterification. Incubations for the [ 14 C]acetate de novo lipogenesis were still carried out at 37°C however the time was extended to 2 hrs to allow for greater acetate incorporation into complex lipid species.
Serial block-face electron microscopy
Methods were adapted from 99 and were performed in collaboration with the Mayo Clinic Microscopy and Cell Analysis Core (MACA) and the University of Minnesota Imaging Center (UMIC). Fixation of 1 mm by 1 mm sections of hepatic tissue was achieved by SBFSEM fixative (2% glutaraldehyde, 2% formaldehyde, in 0.15 M cacodylate buffer with 2 mM calcium chloride). Submerged tissues in fixative were stored in glass vials at 4°C for a minimum of 1 h. The tissue was rinsed with 0.15 M cacodylate buffer containing 2 mM calcium chloride for 3 min while rotating. The wash step was repeated a minimum of four times. The samples were then incubated in fresh 2% osmium tetroxide in 0.15 M cacodylate buffer, pH 7.4 for 1.5 h at room temperature with rotation. Rinsed in ultra-pure water for 3 min a minimum of four times. Tissues were again incubated in 2% osmium tetroxide without cacodylate for 1.5 h at room temperature followed by an additional four washes in ultra-pure water. After the last water wash, tissue samples were incubated in 1% aqueous uranyl acetate at 4°C overnight. The following day, samples were baked at 50°C for 1 h, rinsed in ultra-pure water, and incubated in Walton’s Lead aspartate for 1 h at 50°C. A final four water rinses were carried out before dehydrating the samples and infiltrating them in 812 resin. The mounting, trimming, and imaging was performed by the Mayo Clinic Microscopy and Cell Analysis Core Facility.
Three-dimensional reconstruction & analysis
For each electron tomography analysis, serial tomograms were compiled as a single TIFF file and analyzed using Avizo 3D Software (v. 2021.1.; Thermo Fisher Scientific). The structure of interest (e.g., LD, mitochondria, ER.) was carefully manually traced on each virtual slice using a Wacom graphic tablet and then reconstructed in three dimensions, with rendering generated using unconstrained smoothing parameters. The surfaces of adhesion/contact sites and mitochondria were measured using the Surface Area Volume module. Movies were generated using Avizo 3D Software (v. 2021.3, Thermo Fisher Scientific) and then edited with the Microsoft Photos application (v. 2022.30060.30007.0; Microsoft).
Live cell imaging
Fluorescence imaging experiments were performed with cells seeded at a density of 50,000 cells/plate on Mat-Tek cover-glass plates (Ashland, MA). The plasmid expressing SPLICSs (10.4 nm) was purchased from Addgene (#164108) and cloned into the tetracyclin inducible lentivirus system pLV-Bsd-TRE-CMV-rtTA. AML12 cells were transduced and put under blasticidin selection before being screened for positive clones. Digital images were acquired using a Nikon A1Rsi Laser Scanning Confocal Imaging System (LSCIS; Nikon, Melville, NY) equipped with 405 nm, 488 nm, 561 nm, and 640 nm laser, four-channel GaSP detectors, and a 60x water immersion objective. To determine the subcellular localization of LDs, MAM, and mitochondria under fed and fasted conditions, cells were treated with AutoDOT neutral lipid stand and MitoTracker Deep Red. Media conditions are described above for fed and fasting media. For probe excitation, the A1Rsi LSCIS utilized the 640 nm diode laser (MitoTracker Deep Red), the 405 nm laser line (AutDOT Neutral lipid stain), and the 488 nm laser line (SPLICSs) to acquire images of the cells by sequential excitation. Image files were analyzed using NIS-Elements software or FIJI-Image software. z-stack or multiple focal planes were imaged to ensure compartmentalization and localization. Diana surface contact analysis Mitochondria-LD, LD-MAM, and MAM-mitochondria interactions were characterized using the DiAna ImageJ tool. 43 In brief, images were individually segmented and analyzed using the DiAna plugin in FIJI. Lipid droplets were segmented using the iterative segmentation method with a minimum volume of 3 pixels, maximum volume of 2000 pixels, minimum threshold of 100, and STEP value of 100. The mitochondria and MAM (SPLICS) were segmented using the classic segmentation method, with either no filter (mitochondria) or a Gaussian filter (MAM) applied during thresholding, an XY radius of 0.5, minimum object size of 3 pixels, and maximum object size of 20,000 or 50,000 pixels. The maximum object size was determined based on thresholding for each image. DiAna colocalization analysis was performed to calculate the surface in contact length between lipid droplets and mitochondria, lipid droplets and MAM (SPLICS), and mitochondria and MAM (SPLICS) for each image. The maximum distance to establish contact between objects was set at 50 nm.
Isolation of MAM from CM and PDM
Isolation of MAM from CM and PDM was achieved by adapting the following protocol 46 ( Figure S5A ). In brief, CM and PDM were isolated as described above and in Figure S1 . CM and PDM pellets were resuspended in mitochondria resuspending buffer (MRSB; 250 mM mannitol, 5 mM HEPES, 0.5 mM EGTA, pH 7.4) and layered on a Percoll medium separation gradient (PM; 225 mM mannitol, 25 mM HEPES, 1 mM EGTA, 30% Percoll (v/v), pH 7.4) in a Polyallomer ultracentrifuge tube. The remainder of the tube volume above the sample was topped off with MRSB. Samples were then centrifuged at 95,000×g for 30 min at 4°C in an SW-41Ti swing bucket rotor. The MAM appeared as an off-white band in the middle of the ultracentrifuge tube while the mitochondria were a dark brown band at the bottom just above the Percoll pellet ( Figure S5B ). Using a glass pasture pipette both the MAM and mitochondrial fractions were collected. MAM and mitochondria were transferred to a clean falcon tube and diluted ten times with MRSB then centrifuged at 6,300×g for 10 min at 4°C. The MAM supernatant was transferred to a polycarbonate tube with cap assembly (the mitochondrial pellet was discarded) and centrifuged at 100,000×g for 1 h in a 70-Ti rotor at 4°C. The mitochondrial supernatant was discarded from the pure mitochondrial fraction. The pelleted mitochondria were again resuspended in MRSB and centrifuged a second time at 6,300×g for 10 min at 4°C. The supernatant was discarded, and mitochondria were resuspended in a small volume of MRSB and flash frozen. The MAM samples post 100,000×g spin are pelleted at the bottom of the ultracentrifuge tube. The MAM supernatant was discarded and the pelleted MAM was resuspended in a small volume of MRSB and snap-frozen for later analysis. The purity of the fractions was determined via immunoblotting ( Figure S5C ).
Proteomic analysis of MAM from CM and PDM
For proteomic analysis of CM-MAM, PDM-MAM isolated from control and PLIN5 knockdown samples, mitochondria samples were extracted with proteomic lysis buffer [PLB2; 7 M urea, 2 M thiourea, 0.4 M tris pH 8, 20% acetonitrile, 10 mM tris (2-carboxyethyl) phosphine (TCEP), and 40 mM chloroacetamide]. The samples were pipetted up and down several times and transferred to a PCT tube for the Barocycler NEP2320 (Pressure Biosciences, Inc., South Easton, MA) and cycled between 35 kPSI for 20 s and 0 kPSI for 10 s for 60 cycles at 37°C. Samples were centrifuged at 13000×g for 10 min. The supernatants were transferred to new 1.5 mL microfuge Eppendorf Protein LoBind tubes. Aliquots for each sample were taken for protein concentration determination by Bradford assay. A 25 μg aliquot of each sample was transferred to a new 1.5 mL Eppendorf Protein LoBind tube and brought to the same volume with PLB2. In addition, a pooled sample was created by combining equal amounts of each sample to use as a bridge sample across multiple TMT experiments. All samples were diluted fivefold with water, and then trypsin (Promega, Madison, WI) was added in a 1:40 ratio. Samples were incubated overnight for 16 h at 37°C. After incubation, the samples were frozen at −80°C and dried in a vacuum concentrator. Each sample was cleaned with a 1 CC Waters Oasis MCX cartridge (Waters Corporation, Milford, MA), and eluates were vacuum dried and resuspended in 100 mM triethylammonium bicarbonate, pH 8.5 to a final concentration of 1 μg/μL. For each channel within the TMT10plex a 20 μg aliquot of the appropriate sample was made, and the samples were labeled with the corresponding TMT10plex Isobaric Label Reagent (Thermo Scientific, Waltham, MA) per the manufacturer’s protocol. After TMT labeling, all the samples were multiplexed together into a new 1.5 mL microfuge tube. The TMT sample was dried down in vacuo . The sample was cleaned with a 1 CC Waters Oasis MCX solid phase extraction cartridge (Waters Corporation, Milford, MA), and the eluate was dried in vacuo . The samples were offline fractionated as described previously. 74 Each fraction was desalted on a C18 stage tip 75 and reconstituted for analysis. Samples were separated on a Thermo Fisher Scientific, Inc (Waltham, MA) Dionex UltiMate 3000 RSLCnano system and analyzed by tandem mass spectra in data-dependent acquisition (DDA) mode on a Thermo Fisher Orbitrap Fusion mass spectrometer. Analysis of peptides was monitored according to previously established methods 74 with the following modifications: peptides were separated on a 40 cm column with the following elution profile: 5–35% B solvent from 0 to 70 min, 35–90% B solvent from 70 to 80 min and held at 90% B from 80 to 86 min at a flowrate of 325 nL/min, where solvent A was 0.1% formic acid in water and solvent B was 0.1% formic acid in ACN; the Orbitrap MS1 injection time was 100 msec with 4 × 10 5 AGC (100%); DDA was performed on the top 12 most intense ions; HCD (higher energy collision dissociation) energy was 40%; MS2 injection time was 150 msec with 4 × 10 5 AGC (200%).
Statistical analysis
Values were expressed as the means ± SEM. In comparisons made between two groups, such as CM versus PDM, Student t -tests were performed using GraphPad Prism (San Diego, CA). When more than two groups were compared, such as in our analysis across control and PLIN5 knockdown samples, analysis of variance (ANOVA) with a Newman Keuls posthoc test was performed. Values with p < 0.05 were considered statistically significant. For proteomics quantification, we used Scaffold 5 Label Based Quantitation plug in to determine significant changes. Statistical significance between samples and groups was determined using a Permutation Test with a Benjamini-Hochberg posthoc test (Proteome Software: https://www.proteomesoftware.com/products/scaffold-5 ).
Materials availability
All unique/stable reagents generated in this study are available from the lead contact with a completed Materials Transfer Agreement.
EXPERIMENTAL MODEL AND SUBJECT DETAILS Animal experimentation
Mice and anti-sense oligonucleotide administration
All animal protocols were approved by the University of Minnesota Institutional Animal Care and Use Committee. Male 8–12-week-old C57BL6/J mice were obtained from Harlan Laboratories and housed under controlled temperature and lighting (20–22°C; 14:10-h light-dark cycle). The mice were fed a purified control diet (TD 94045; Harlan Teklad Premier Laboratory) and acclimatized for 1 week before any experimental procedure. Control and Plin5 antisense oligonucleotides (ASOs; Ionis Pharmaceuticals) were given via intraperitoneal injection twice per week at a dose of 40 mg/kg. ASO injections were carried out for three weeks, all mice were euthanized for liver tissue and serum collection. Knockdown was confirmed through protein (Western blot) analysis.
METHOD DETAILS Peridroplet and cytosolic mitochondrial isolation
All procedures were performed using pre-chilled equipment and solutions. The following method was adapted from Benador et al. 11 Livers from 12–16-week-old mice were harvested, rinsed in PBS, minced, and suspended in 6 mL Sucrose-HEPES-EGTA supplemented with FA-free BSA (SHE+BSA; 250 mM sucrose, 5 mM HEPES, 2 mM EGTA, 2% FA-free BSA, pH 7.4). The resuspended hepatic tissue was mechanically disrupted with 15 strokes in a glass Teflon Dounce homogenizer. The homogenate was then transferred to a 50 mL falcon tube and diluted up to 10 mL in ice-cold SHE+BSA. The lysates were centrifuged in an Avanti J-15R (Beckman Coulter) swinging bucket rotor at 900×g for 10 min at 4°C. The resulting sample was examined to ensure that a fat cake (containing PDM and LD) was floating on the top of the supernatant (containing CM) and cell debris was pelleted. Using a glass pasture pipette, the fat cake was removed from the supernatant. The fat cake was resuspended in SHE+BSA. The supernatant was transferred to a fresh pre-chilled 50 mL falcon tube and both the fat cake and supernatant were re-centrifuged at 900×g 10 min 4°C. Post centrifugation, the original fat cake and the remaining fat cake on the supernatant were combined and transferred into 2 mL Eppendorf tubes, being careful to remove only the fat cake and as little of the supernatant as possible. The supernatant containing the CM was also transferred to 2 mL Eppendorf tubes and the two fractions were centrifuged at 9,000×g for 10 min at 4°C. The mitochondrial pellets were re-suspended in SHE+BSA and centrifuged with the same settings twice more. Mitochondria were then re-suspended in SHE without BSA and protein concertation was determined by BCA (Thermo Scientific). In experimental designs where LDs were also needed, the residual fat cake stripped of PDM was kept. The fat cake was further purified to obtain LDs by transferring the fat cake to a 2mL Eppendorf tube, suspending them in SHE+BSA, and then centrifuged at 21,000×g for 20 min. Buoyant LDs were removed and placed into a fresh 2 mL tube using a glass pasture pipette and suspended in SHE without BSA. The LDs were again centrifuged at 21,000×g for 20 min before protein concentration was determined with BCA.
Purification of CM and PDM for quantitative proteomics
Samples for quantitative proteomic analysis were collected from four-control ASO and four PLIN5 ASO-treated mice. CM and PDM from these mice were harvested as described above. After the final pelleting of CM and PDM, mitochondrial fractions were resuspended in homogenate buffer [10 mM Tris-base pH 7.0 with protease (Complete protease inhibitor cocktail, Roche, Basel Switzerland), phosphatase (PhosSTOP, Sigma-Aldrich, St. Louis, MO), and deacetylase inhibitors (De-acetylase Cocktail, MedChem Express, Monmouth Junction, NJ)], in place of the SHE without BSA. The resuspended mitochondrial pellets were loaded onto a sucrose step gradient (4 mL 35% sucrose, 4 mL 25% sucrose) and centrifuged at 36,000 rpm in a Beckman SW41 swinging bucket rotor for 4 h. The mitochondria from the CM and PDM fractions appeared as a dark-brown pellet at the bottom of the tube. At this stage, the samples can be snap-frozen. This method is adapted from the full cellular fractionation described in. 73 For proteomic analysis, mitochondria samples were extracted with proteomic lysis buffer [PLB1; 7 M urea, 2 M thiourea, 0.4 triethylammonium bicarbonate, pH 8.5, 20% acetonitrile, 10 mM tris (2-carboxyethyl) phosphine (TCEP), 40 mM chloroacetamide]. The samples were pipetted up and down several times and transferred to a PCT tube for the Barocycler NEP2320 (Pressure Biosciences, Inc., South Easton, MA) and cycled between 35 kPSI for 20 s and 0 kPSI for 10 s for 60 cycles at 37°C. Samples were centrifuged at 13000×g for 10 min. The supernatants were transferred to new 1.5 mL microfuge Eppendorf Protein LoBind tubes. Aliquots for each sample were taken for protein concentration determination by Bradford assay. A 25 μg aliquot of each sample was transferred to a new 1.5 mL Eppendorf Protein LoBind tube and brought to the same volume with PLB1. In addition, a pooled sample was created by combining equal amounts of each sample to use as a bridge sample across multiple TMT experiments. All samples were diluted five-fold with water, and then trypsin (Promega, Madison, WI) was added in a 1:40 ratio of trypsin to total protein. Samples were incubated overnight for 16 h at 37°C. After incubation, the samples were frozen at −80°C and dried in a vacuum concentrator. Each sample was cleaned with a 1 CC Waters Oasis MCX cartridge (Waters Corporation, Milford, MA), and eluates were vacuum dried and resuspended in 100 mM triethylammonium bicarbonate, pH 8.5 to a final concentration of 1 μg/μL. For each channel within the TMT10plex a 20 μg aliquot of the appropriate sample was made, and the samples were labeled with the corresponding TMT10plex Isobaric Label Reagent (Thermo Scientific, Waltham, MA) per the manufacturer’s protocol. After TMT labeling, all the samples were multiplexed together into a new 1.5 mL microfuge tube. The TMT sample was dried down in vacuo . The sample was cleaned with a 1 CC Waters Oasis MCX solid phase extraction cartridge (Waters Corporation, Milford, MA), and the eluate was dried in vacuo . The samples were offline fractionated as described previously. 74 Each fraction was desalted on a C18 stage tip 75 and reconstituted for analysis. Samples were separated on an Easy nLC-1000 UHPLC and analyzed by tandem mass spectra in a data-dependent manner with a Thermo Fisher Orbitrap Fusion mass spectrometer. In brief, we processed the MS peptide spectra using Sequest (Thermo Fisher Scientific, San Jose, CA, in Proteome Discoverer 2.2). The mouse (taxonID 10090) Universal Proteome (UP000000589) target protein sequence database was downloaded from UniProt ( www.uniprot.org/ ) on Nov 19, 2019, and was merged with a common lab contaminant protein database ( http://www.thegpm.org/cRAP/index.html ); the number of protein sequences was 55,180. The digestion enzyme was trypsin, the fragment ion mass tolerance was 0.08 Da and the precursor tolerance was 15 ppm. We set the variable modifications for oxidation of methionine (+15.9949), pyroglutamic acid conversion from glutamine (−17.0265), deamidation of asparagine (+0.9840), protein N-terminal acetylation (+42.0106) and TMT 10plex (+229.1629) modification of lysine and peptide N-terminus. We specified carbamidomethyl of cysteine as a fixed modification. We used Scaffold Q+ (version 4.8.9, Proteome Software Inc., Portland, OR) for validation of tandem MS-based peptide and protein identifications. Peptide identifications were accepted if they could be established at greater than 94.0% probability to achieve an FDR less than 1.0% [mitochondrial proteomics] and greater than 91.0% probability to achieve an FDR less than 1.0% [MAM proteomics] by the Percolator posterior error probability calculation. 76 Protein identifications were accepted if they could be established at greater than 5.0% probability to achieve an FDR less than 1.0% and contained at least 2 identified peptides. Protein probabilities were assigned by the Protein Prophet algorithm. 77 Proteins that contained similar peptides and could not be differentiated based on MS/MS analysis alone were grouped to satisfy the principles of parsimony. Proteins sharing significant peptide evidence were grouped into clusters. We used Scaffold Q+ (version 5.0.1, Proteome Software Inc., Portland, OR) for TMT-based peptide and protein quantification. Reporter ion intensities were adjusted by correction factors in all samples according to the algorithm described in i-Tracker 78 according to the TMTpro 16plex Lot Number WF324548 product data sheet from ThermoFisher Scientific. Normalization was performed iteratively (across samples and spectra) on intensities, as described in statistical analysis of Relative Labeled Mass Spectrometry Data from Complex Samples Using ANOVA. 79 Pooled protein samples from all samples in the two TMT experiments were used for normalization, using two TMT channels for each experiment. Medians were used for averaging. Spectra data were log-transformed, pruned of those matched to multiple proteins, and weighted by an adaptive intensity weighting algorithm. Differentially expressed proteins were determined by applying a permutation test with an unadjusted significance level p < 0.05 corrected by Benjamini-Hochberg. 80
Supplementary Material 1 2
📊 Figures
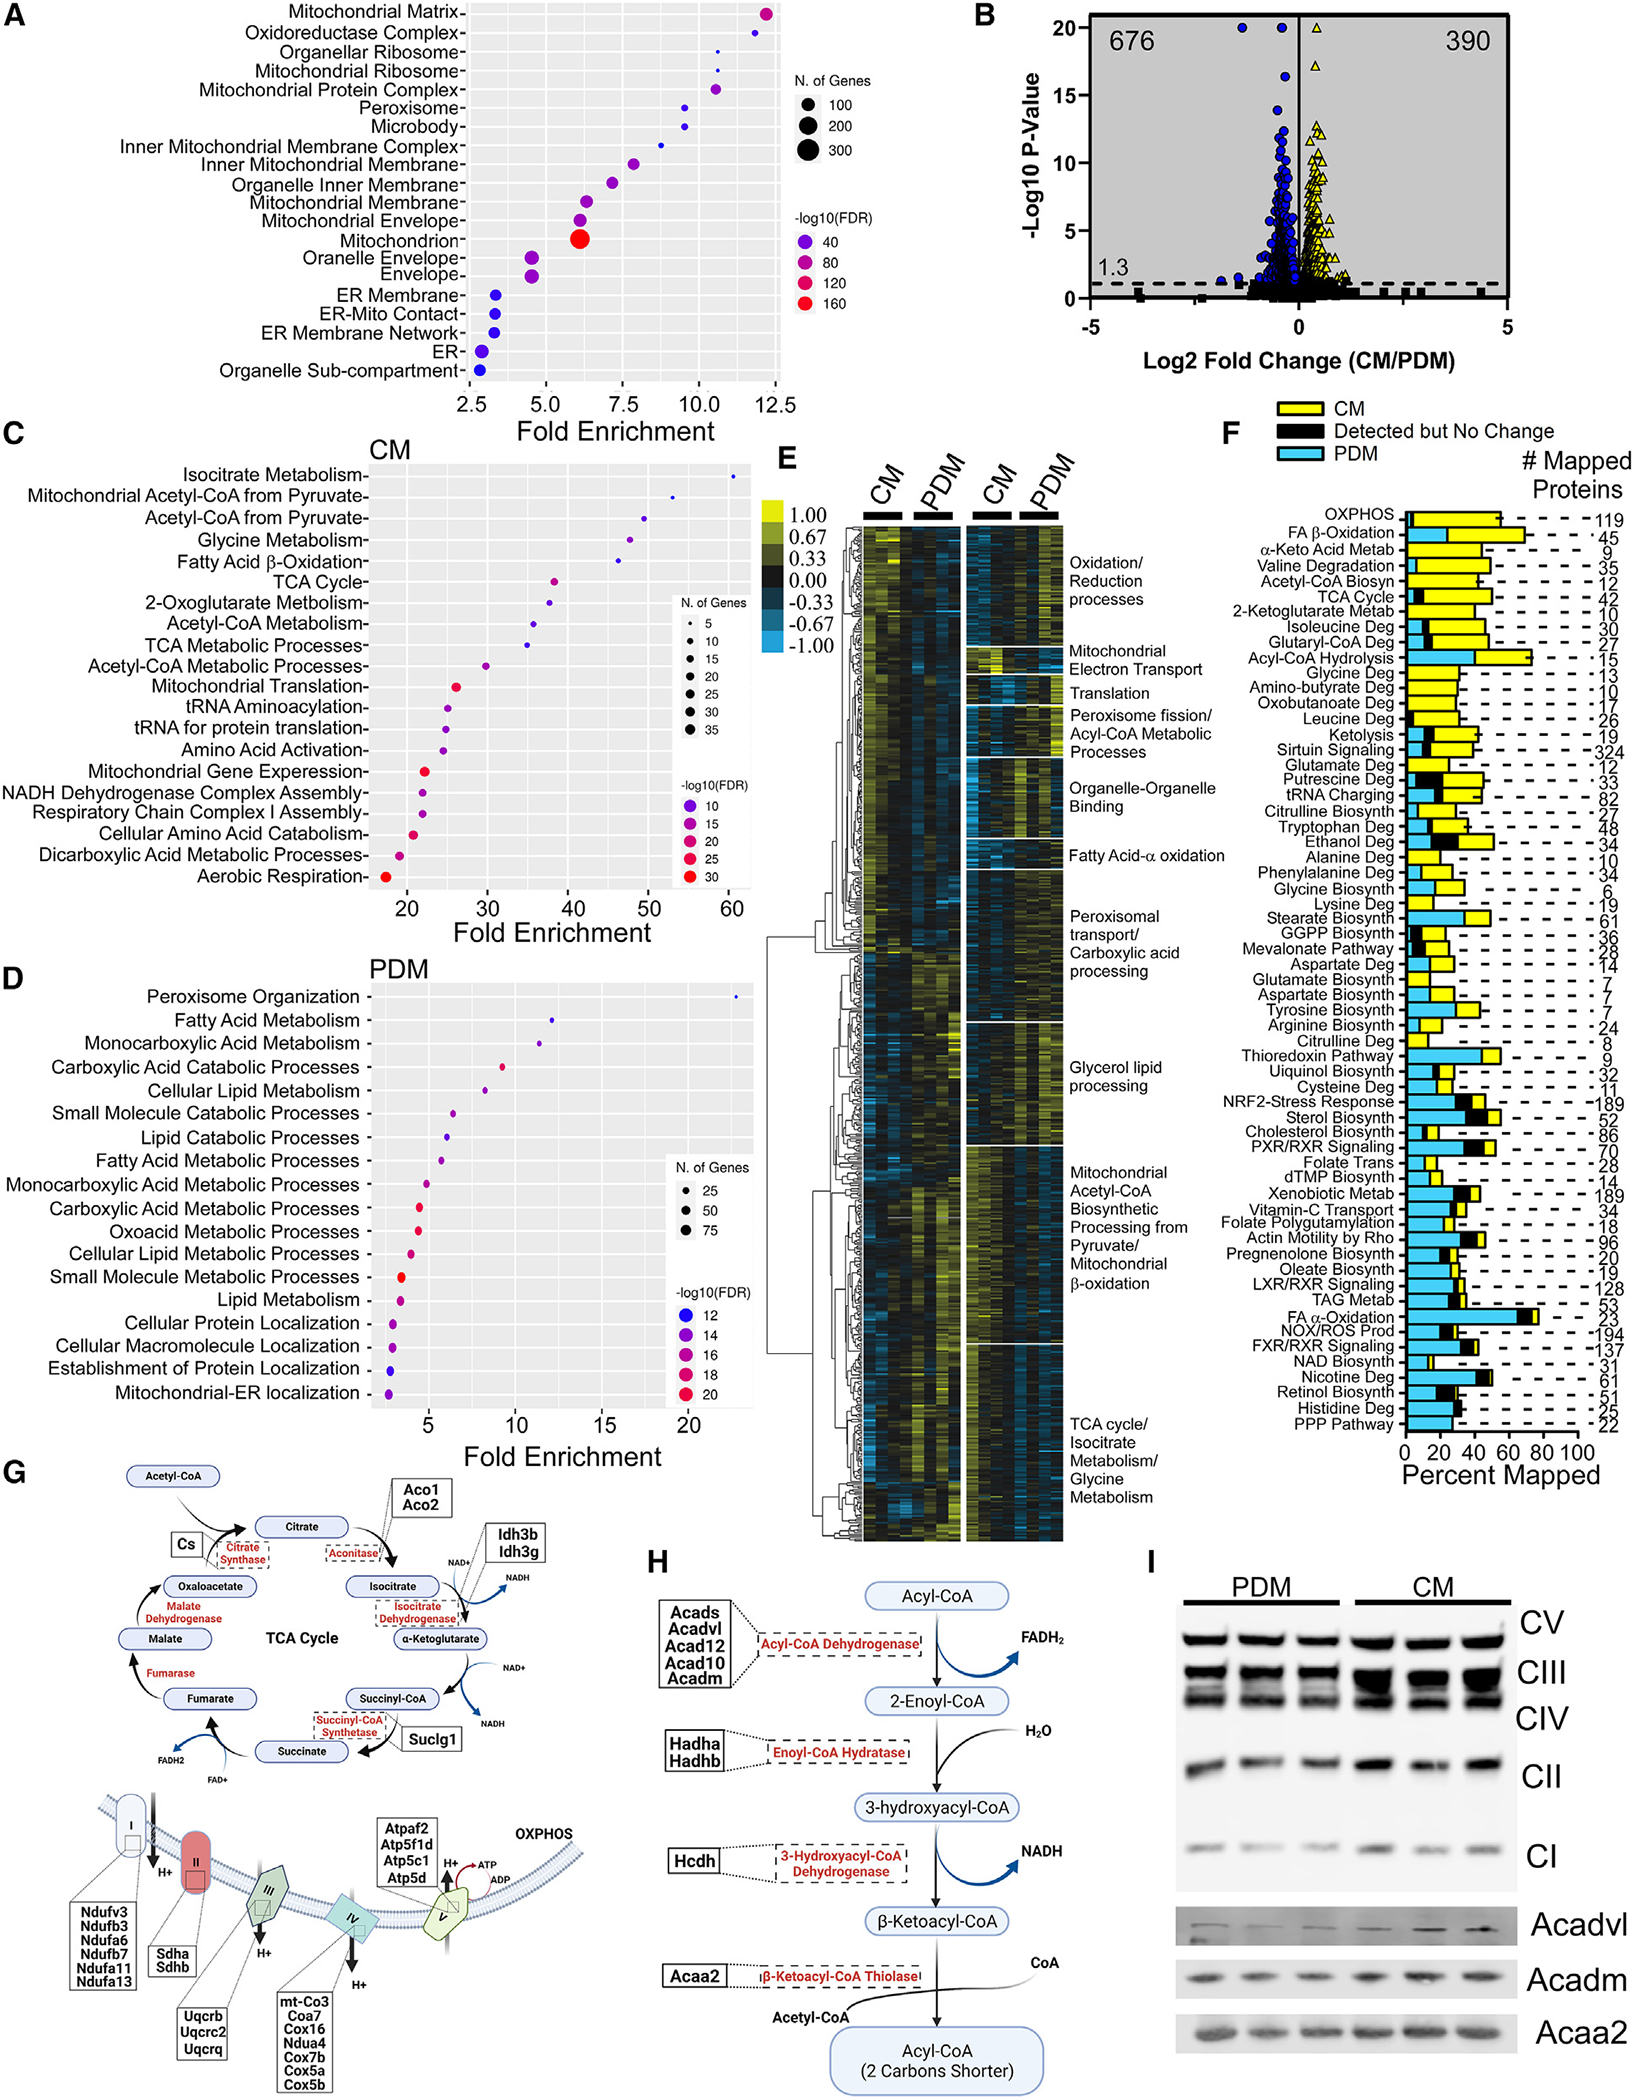
Figure 1.
CM and PDM have unique proteomes
(A) Cellular compartment annotation of the entire proteomics dataset as determined by Gene Ontology (GO) analysis: cellular component. (B) Volcano plot summarizing the changes in the proteomes of CM a...
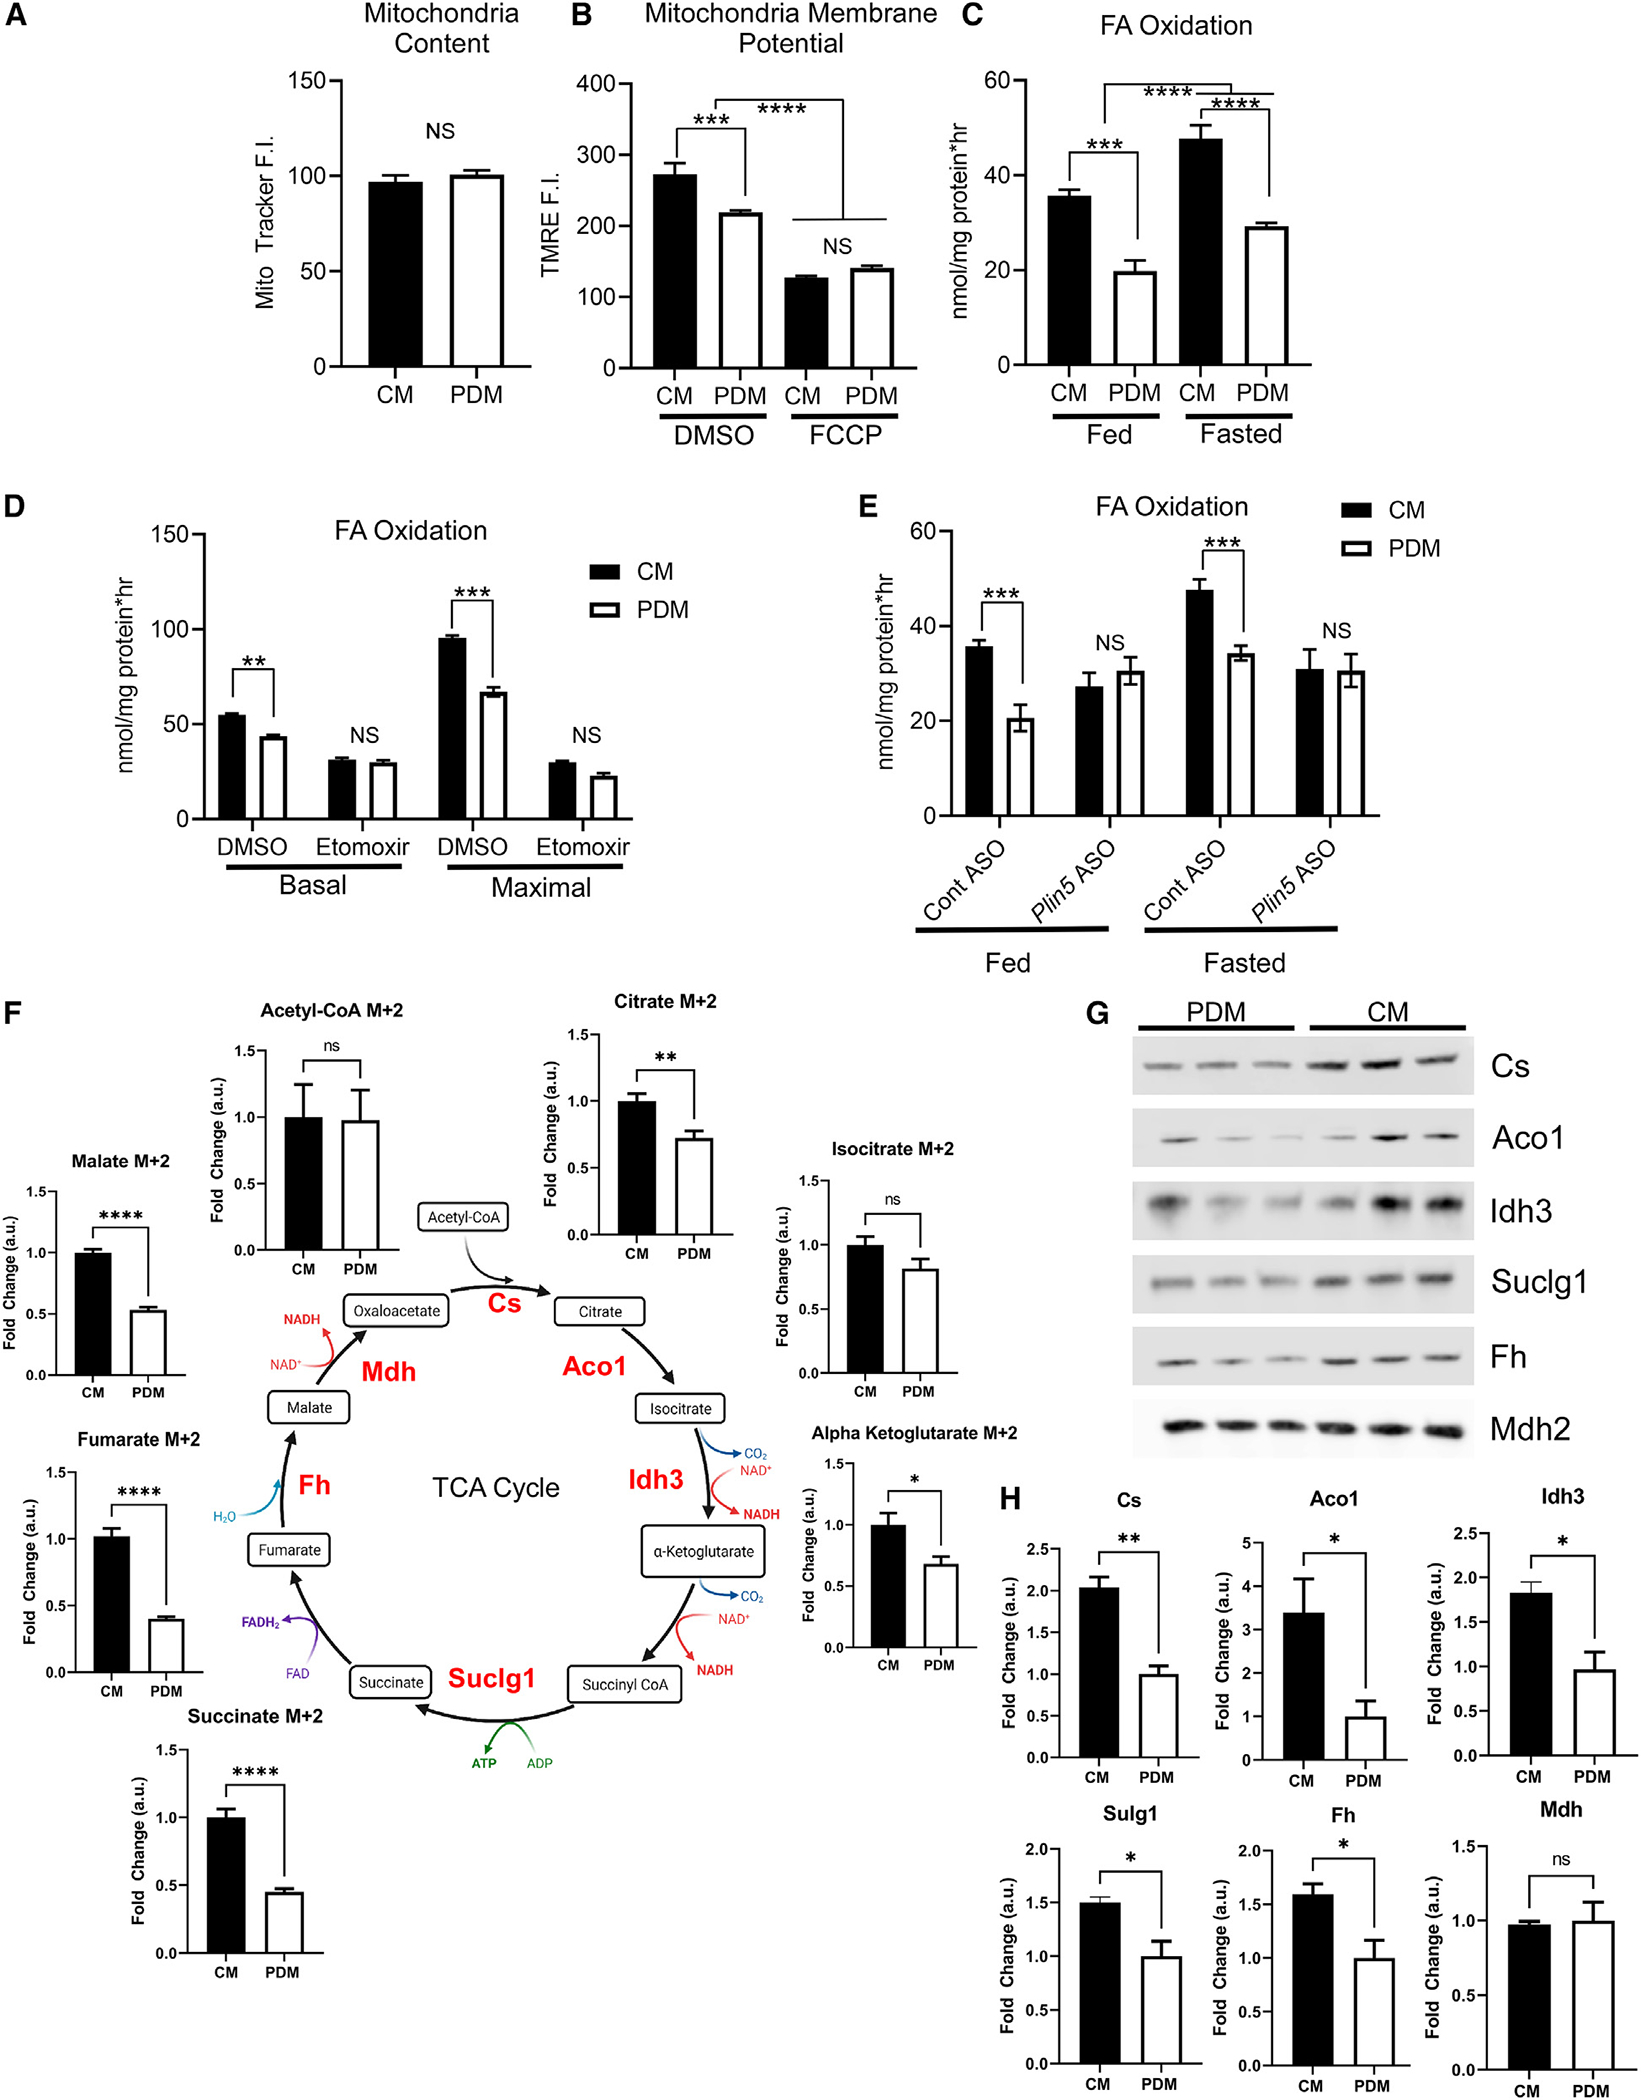
Figure 2.
CM have enhanced bioenergetic capacity
(A) Quantification of MitoTracker Deep Red fluorescence intensity (F.I.) of isolated CM or PDM to ensure equal mitochondrial content. 12u201316 wells were quantified per condition and repeated on thre...
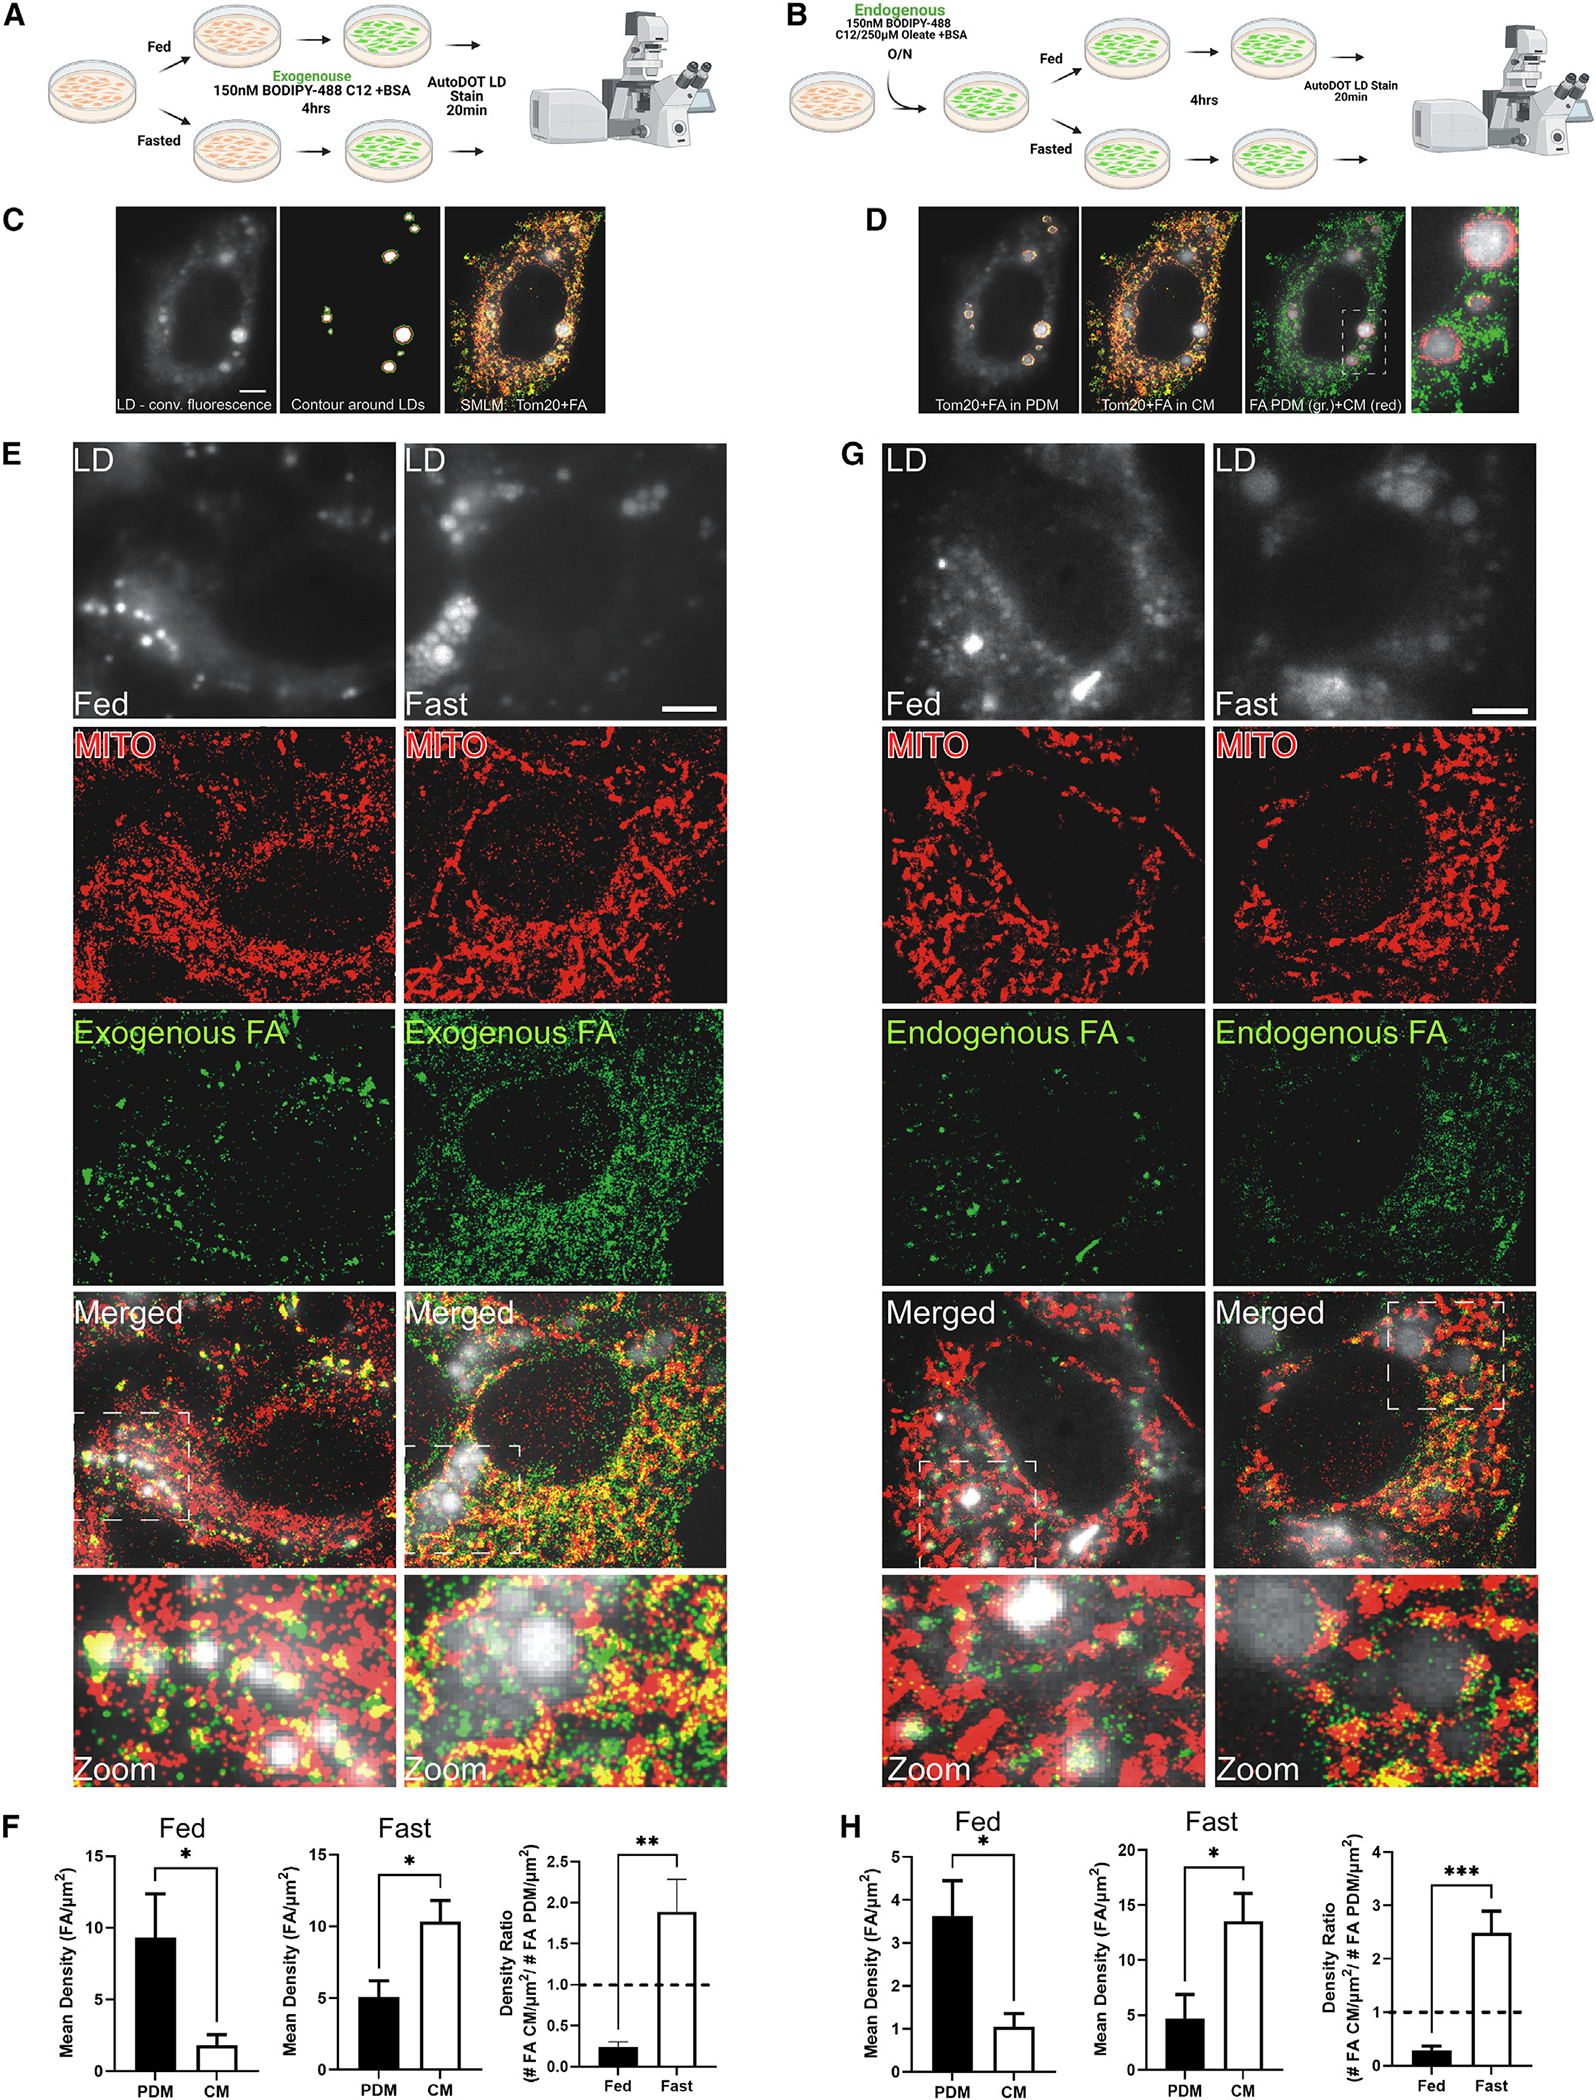
Figure 3.
SMLM quantifies differential FA trafficking to CM and PDM dependent on metabolic state
(A and B) Schematic of the experimental design for exogenous (A) or endogenous (B) FA tracing for SMLM experiments. (C) Left: conventional fluorescence image of LDs in mammalian cells stained with the...
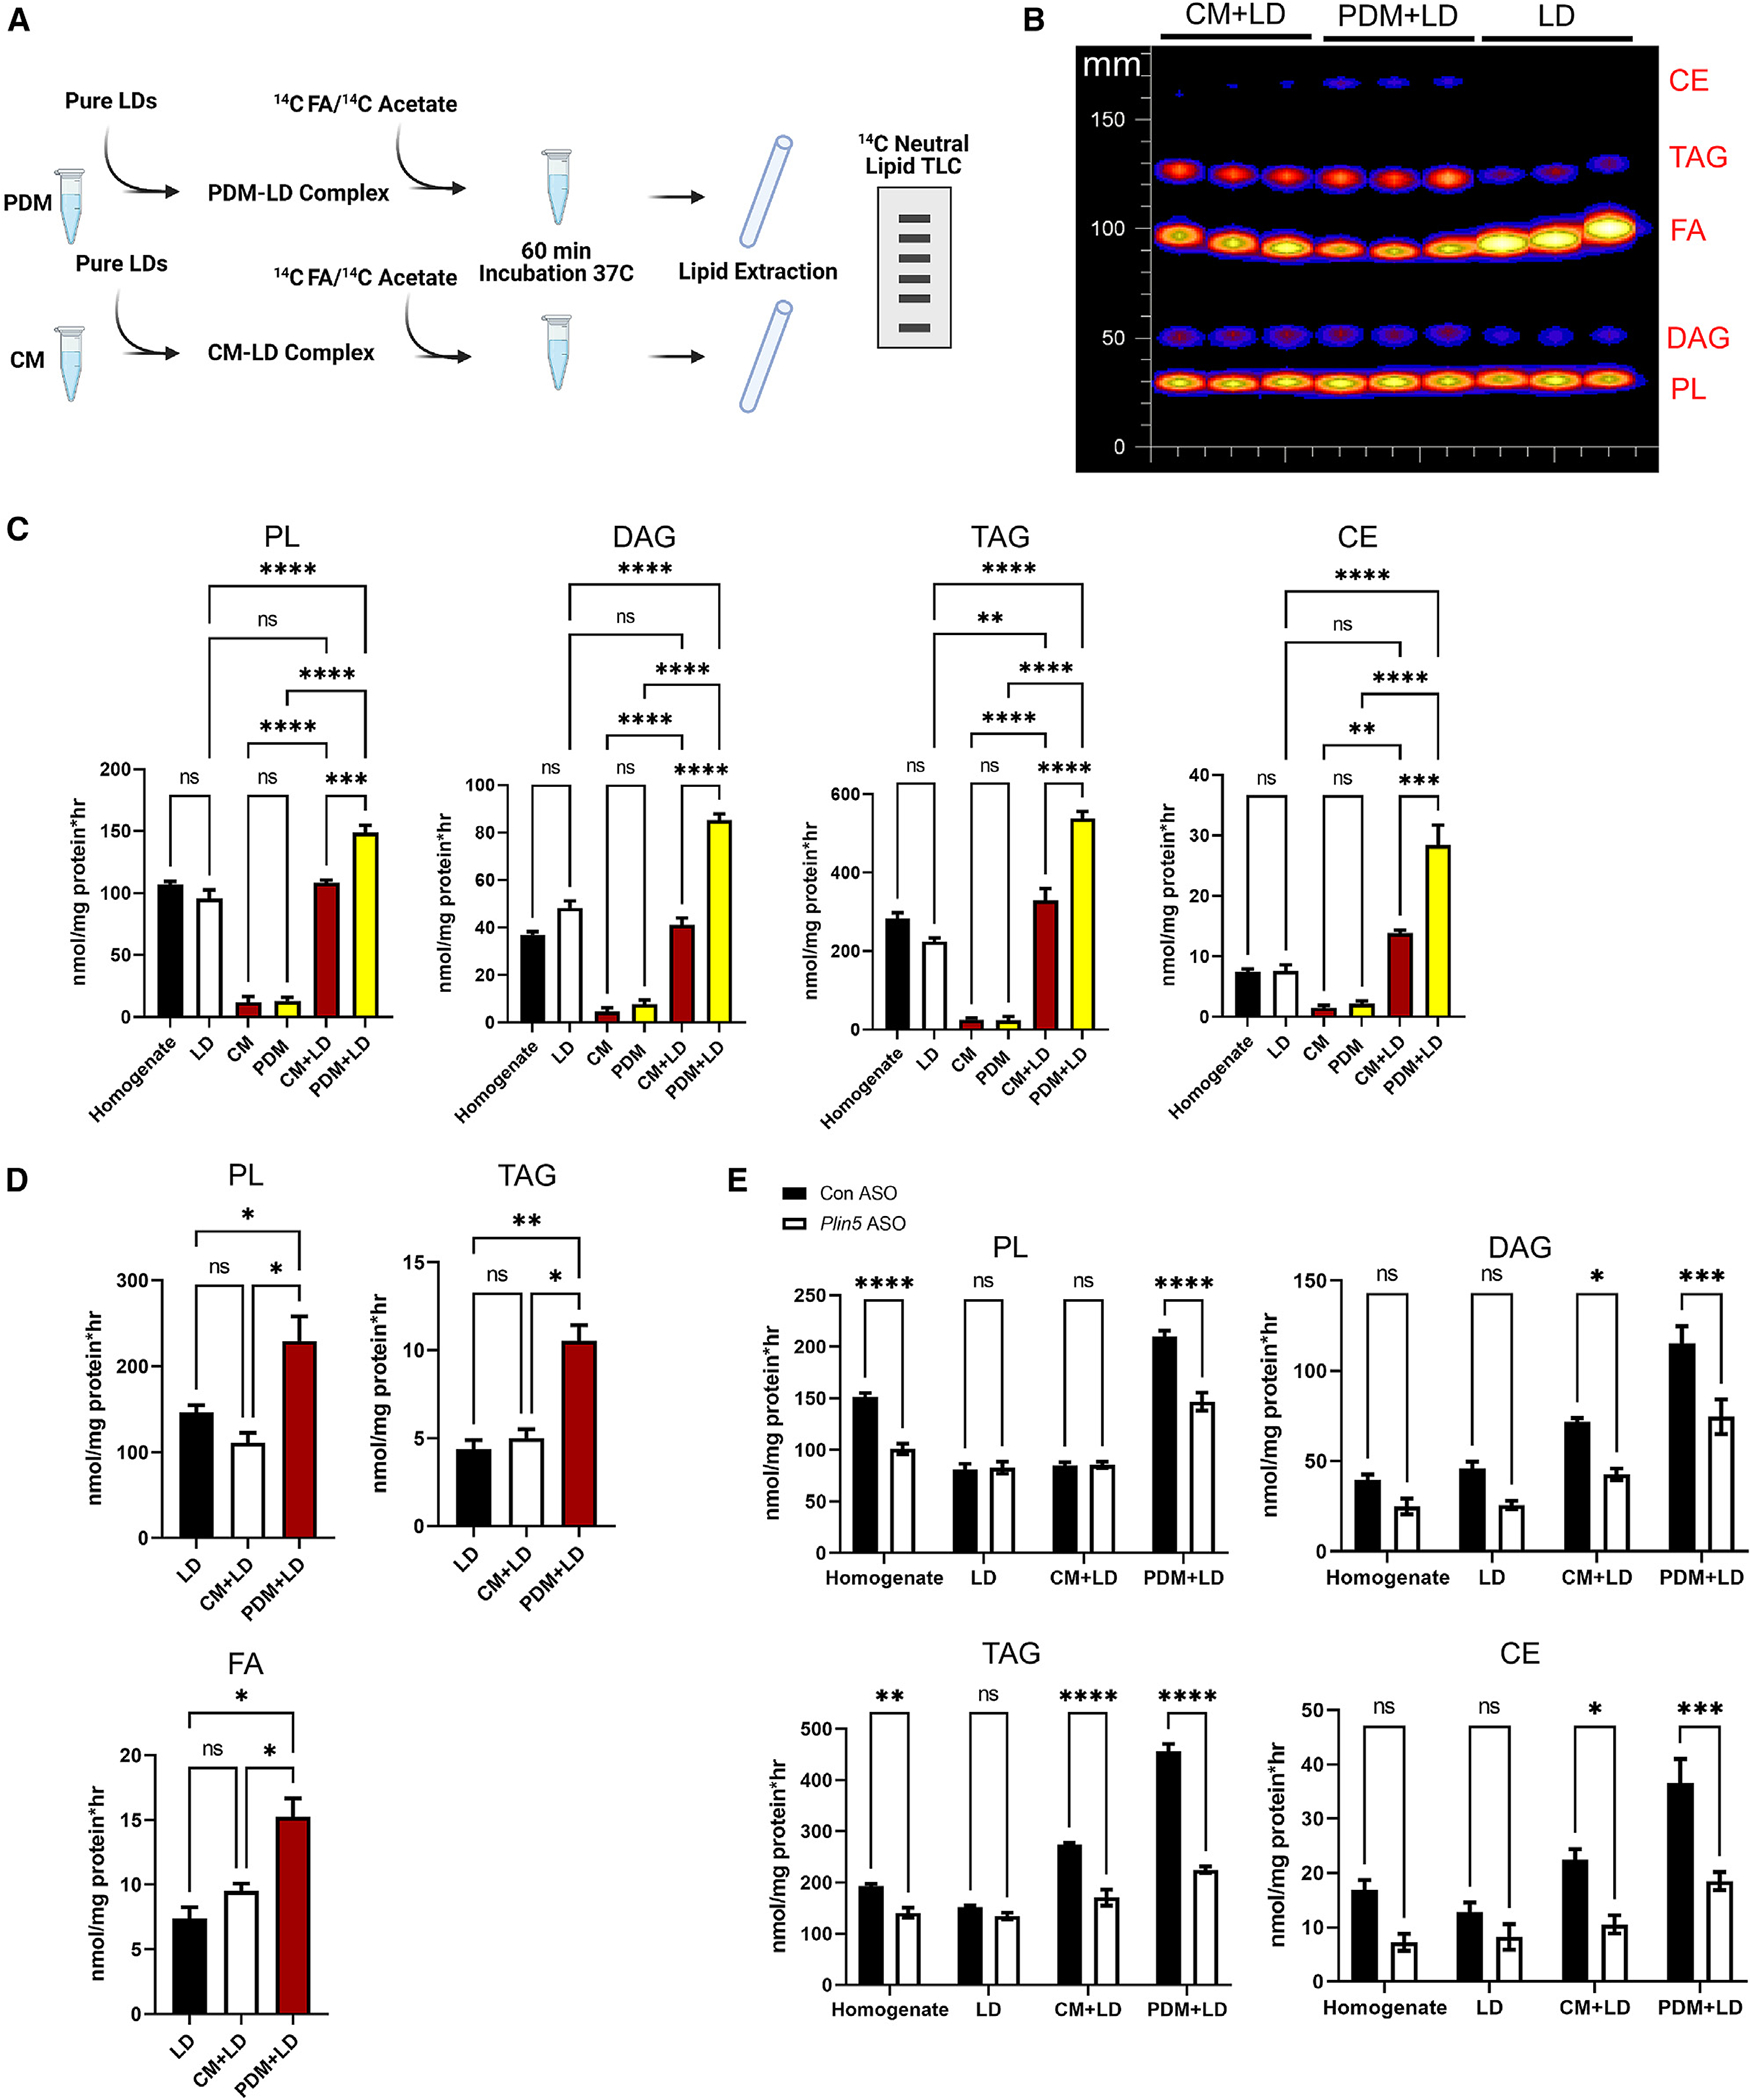
Figure 4.
PDM-LD association promotes lipid synthesis
(A) Schematic of the experimental design using [1- 14 C]oleate or acetate as the substrate to assess FA incorporation into complex lipids from samples isolated from fasted mice. (B) Representative thi...
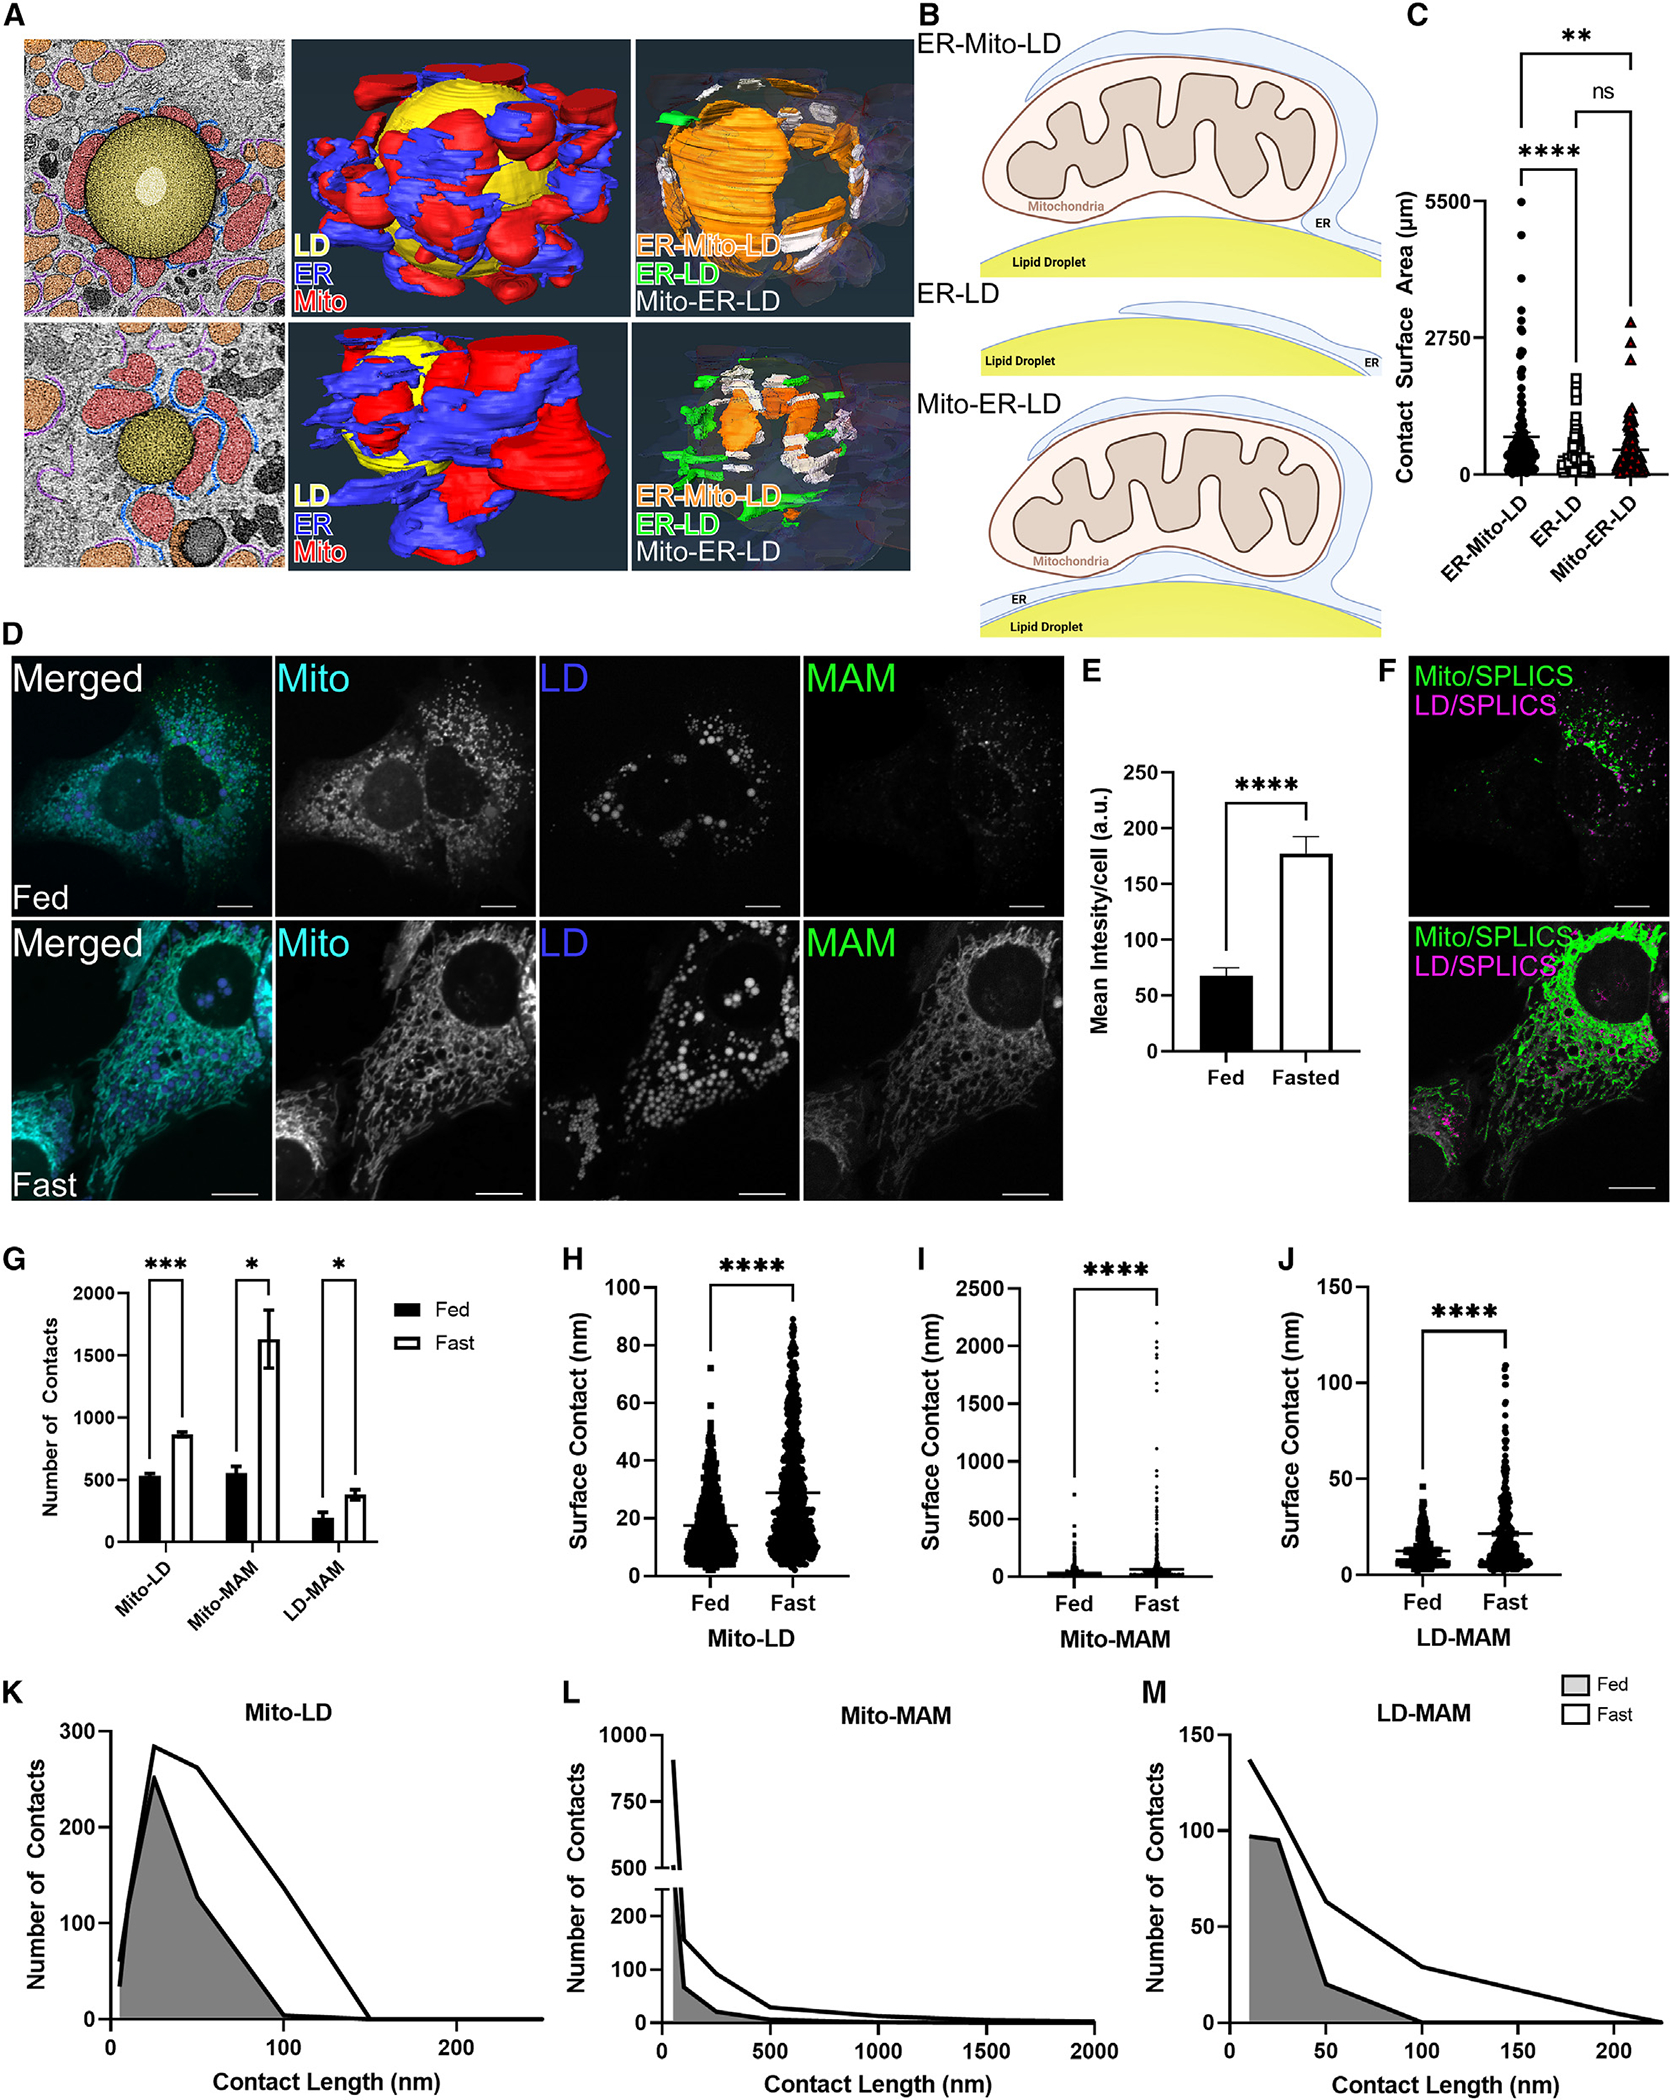
Figure 5.
Fasting-to-feeding transitions regulate mitochondrion-LD and mitochondrion-ER-LD contacts
(A) Micrographs of LDs surrounded by PDM and CM from control ASO mice fasted overnight in addition to 3D reconstruction of serial tomograms compiled as a single image. Blue, ER; red, mitochondria; yel...
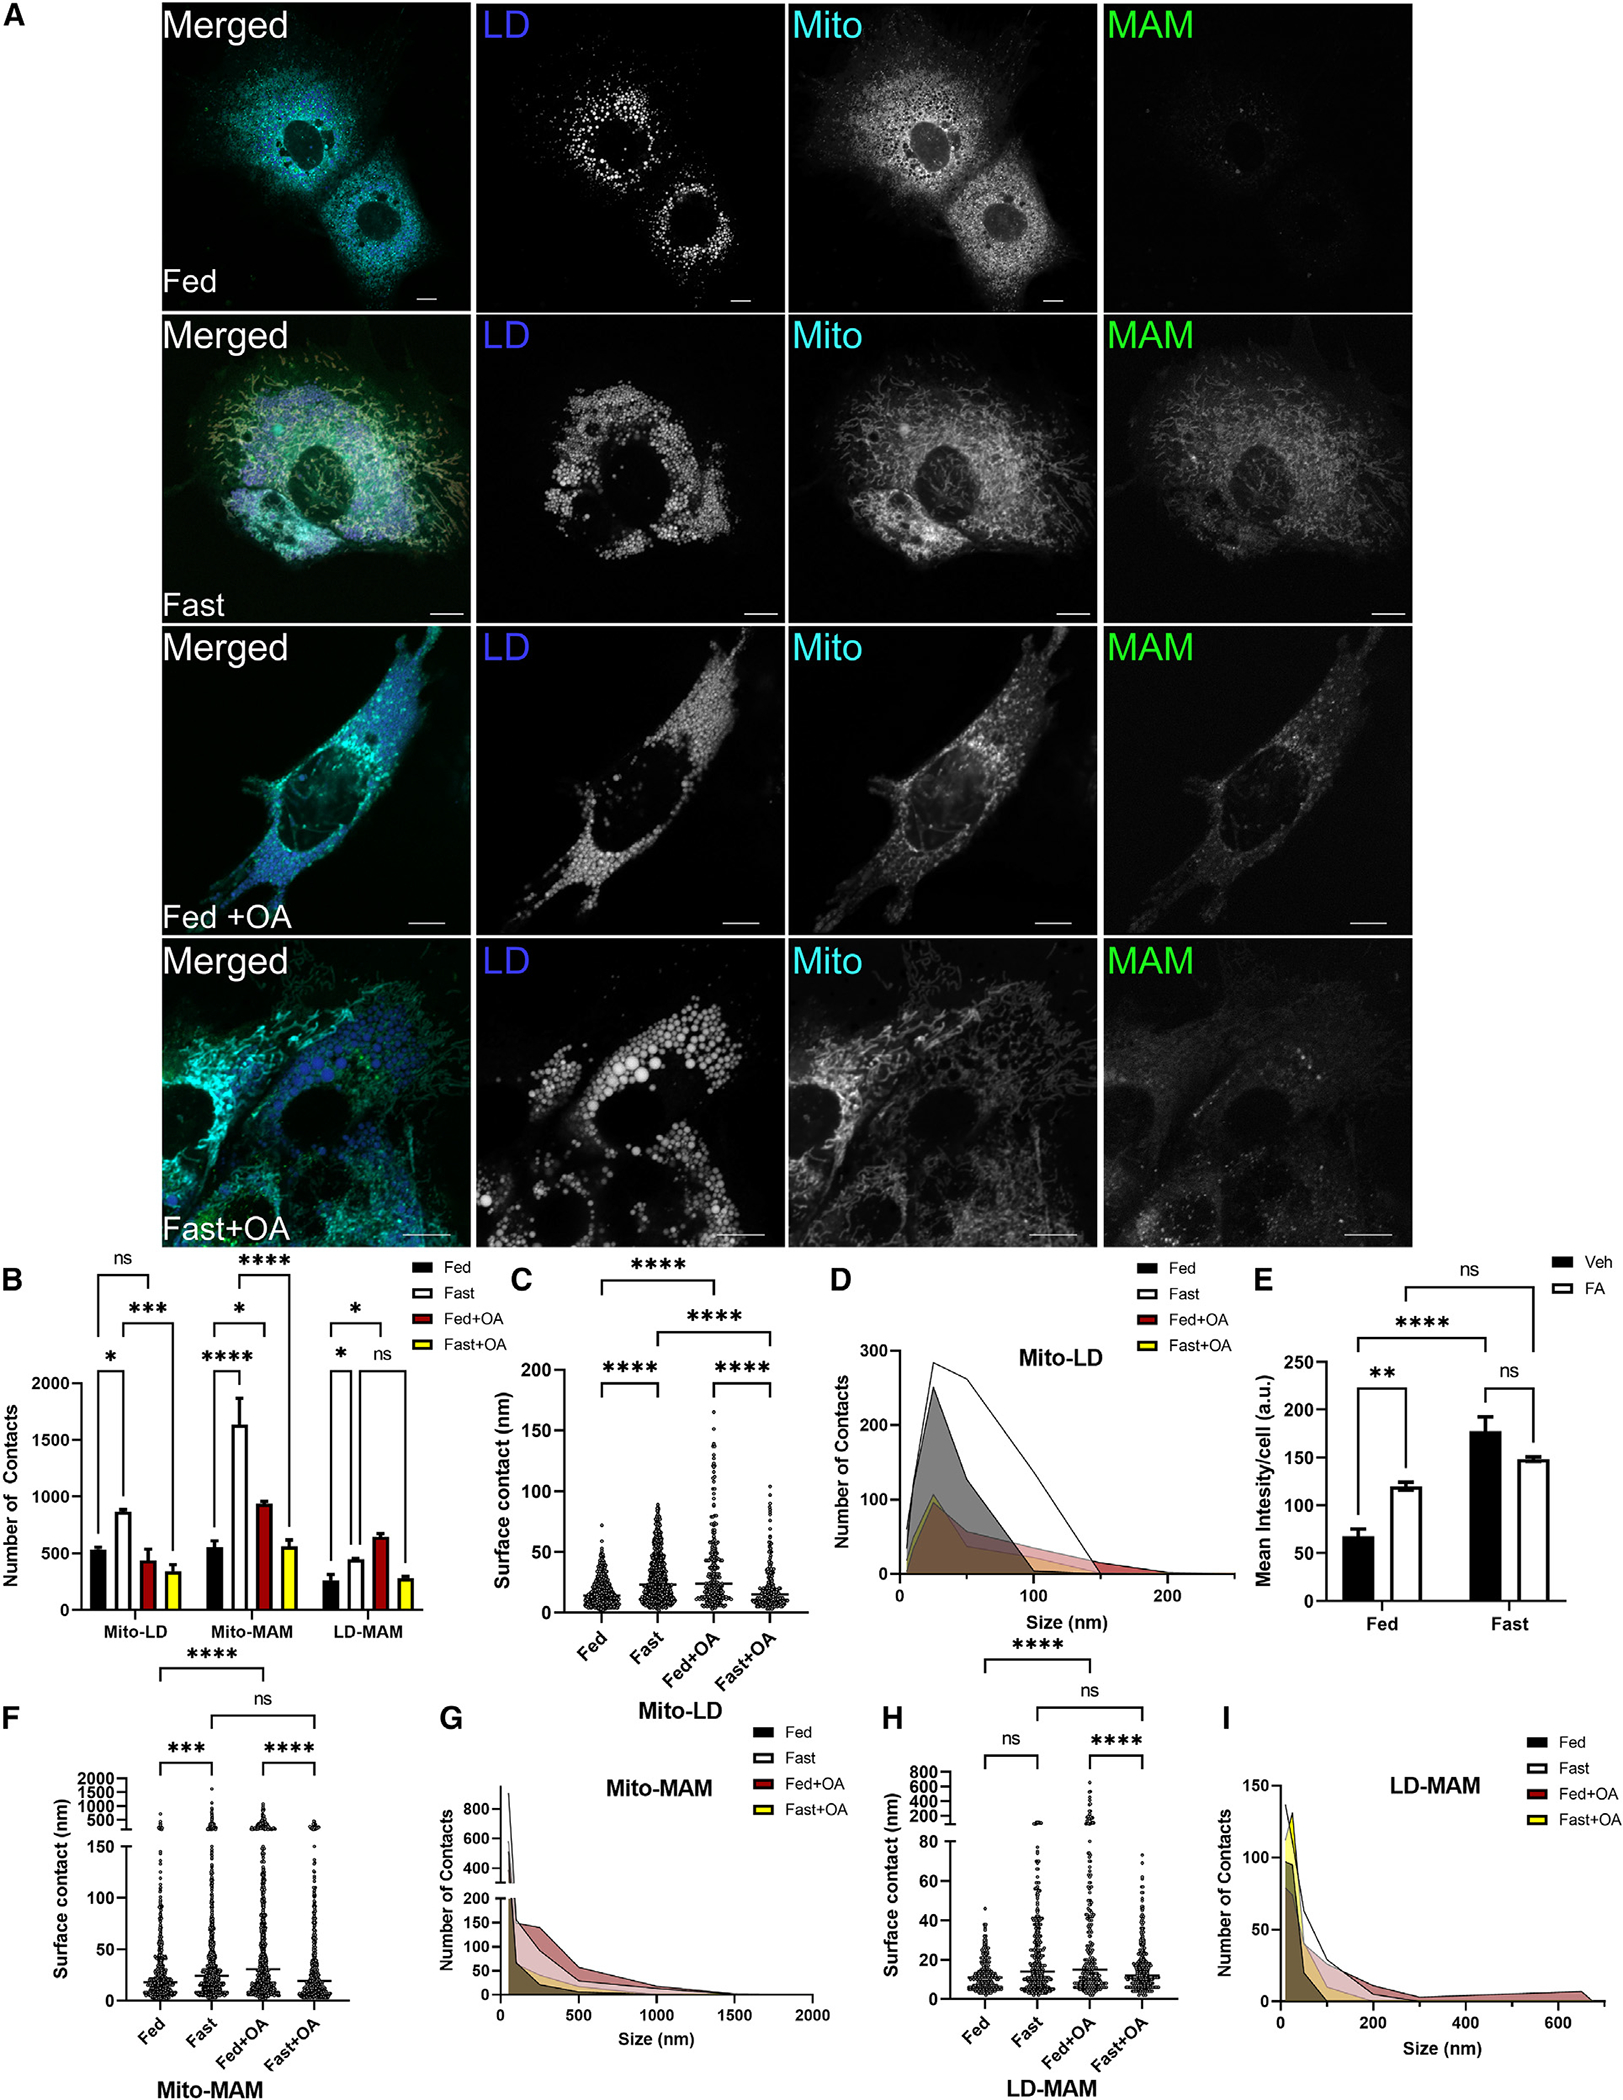
Figure 6.
FAs regulate mitochondrion-LD and mitochondrion-ER-LD contacts regardless of metabolic state
(A) Representative confocal microscopy images of mitochondria and LDs in AML12 cells in fed, fasting, fed plus 250 mM oleate, or fasting plus 250 mM oleate in the medium. (B) DiAna plug-in colocalizat...
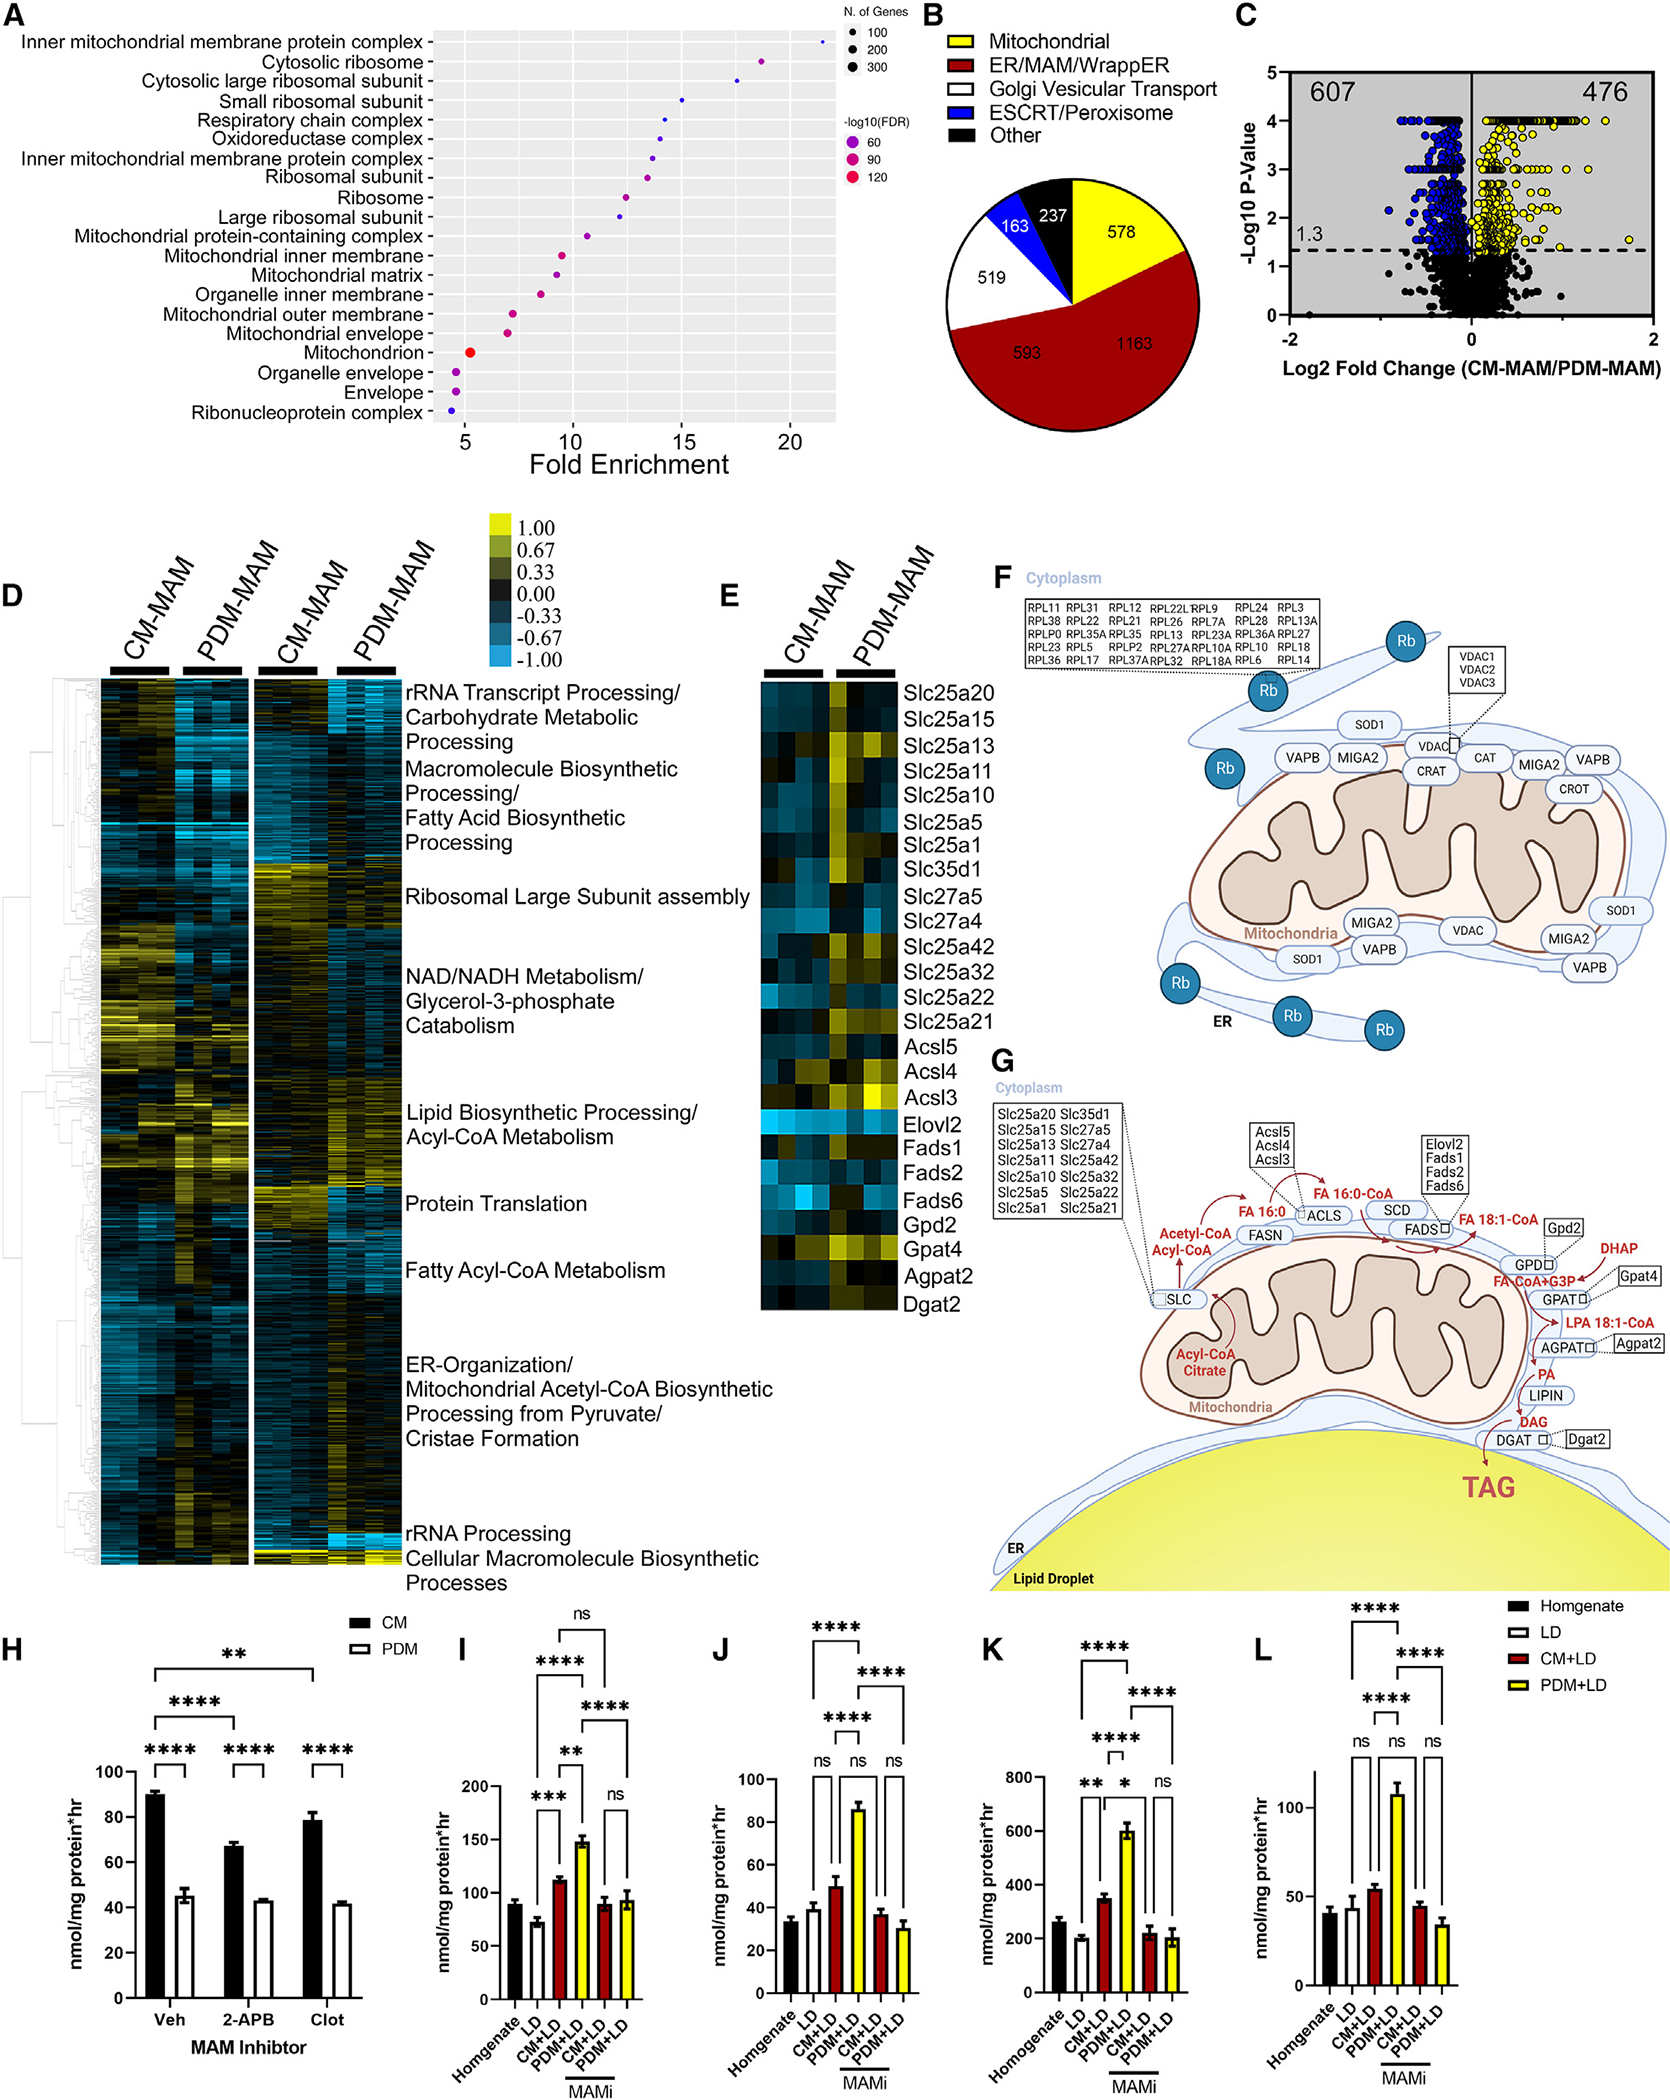
Figure 7.
CM and PDM-MAM have unique proteomes that impact mitochondrial function
(A) Cellular compartment annotation of the entire proteomics dataset, both MAM subpopulations, as determined by GO analysis: cellular component. (B) Pie charts summarizing the proteomics dataset in bo...
Figure images are served from the NIH/NLM PubMed Central Open Access Subset or Europe PMC; copyright remains with the publishers and authors.
💬 Discussion
0 commentsNo comments yet. Be the first to start a discussion!
Leave a Comment