Abstract
We present a quantitative Förster resonance energy transfer (FRET)-based assay using multiphoton fluorescence lifetime imaging microscopy (FLIM) to measure chromatin compaction at the scale of nucleosomal arrays in live cells. The assay uses a human cell line coexpressing histone H2B tagged to either enhanced green fluorescent protein (FP) or mCherry FPs (HeLa(H2B-2FP)). FRET occurs between FP-tagged histones on separate nucleosomes and is increased when chromatin compacts. Interphase cells consistently show three populations of chromatin with low, medium, or high FRET efficiency, reflecting spatially distinct regions with different levels of chromatin compaction. Treatment with inhibitors that either increase chromatin compaction (i.e., depletion of adenosine triphosphate) or decrease chromosome compaction (trichostatin A) results in a parallel increase or decrease in the FLIM-FRET signal. In mitosis, the assay showed variation in compaction level, as reflected by different FRET efficiency populations, throughout the length of all chromosomes, increasing to a maximum in late anaphase. These data are consistent with extensive higher order folding of chromatin fibers taking place during anaphase.
🔬 Techniques
🔭 Microscopes
🧬 Organisms
💻 Software
✨ Fluorophores
🧪 Sample Preparation
🔬 Cell Lines
🏭 Microscope Brands
🧪 Reagent Suppliers
🔴 Lasers
💻 Software Details
💾 Data Repositories
🏛️ Research Organizations (ROR)
Affiliated research institutions:
📋 Methods
Antibodies and plasmids
The antibodies used were as follows: anti-H2B (1:1,000; Millipore), anti-GFP (1:1,000; Roche), and anti-DsRed (1:5,000; Takara Bio Inc.) for Western blotting experiments; and anti–HP1-α (1:500; Euromedex), anti–CENP-C (1:100; gift from J. Swedlow, Wellcome Trust Centre for Gene Regulation and Expression, Dundee, Scotland, UK), and anti-H3K9triMe (1:250; Abcam) for immunostaining experiments. The H2B-EGFP expression vector (pBOS–H2B-GFP-N1) containing the blasticidin resistance gene as a selection marker was a gift from T. Kanda (Hokkaido University, Kita-ku, Sapporo, Japan) and G. Wahl (Salk Institute for Biological Studies, La Jolla, CA; Kanda et al., 1998 ). The mCherry-C1 expression vector containing the neomycin resistance gene as a selection marker was a gift from R.Y. Tsien (Howard Hughes Medical Institute, Chevy Chase, MD; Shaner et al., 2004 ). The mCherry-H2B expression vector was made by cutting the H2B-coding sequence from the pBOS–H2B-GFP vector with KpnI and BamHI restriction enzymes and subcloned into the cloning site of the mCherry-C1 expression vector. Expression vectors coding for EGFP coupled directly to mCherry through a 7-aa linker were generated as described previously ( Llères et al., 2007 ). In brief, EGFP cDNA was amplified by PCR using primers containing XhoI and BamHI sites added to both the 5′ and 3′ ends of the primers, respectively. PCR product was purified on a PCR purification column (QIAGEN) according to the manufacturer’s instructions. Purified PCR product was digested with the appropriate enzymes and cloned using standard methods into the compatible sites of the mCherry-C1 expression vector. The choice of restriction sites results in 7 aa separating the two proteins. Establishment of the HeLa H2B-GFP/mCherry-H2B stable cell line To generate HeLa H2B-GFP/mCherry-H2B , termed HeLa H2B-2FP in the manuscript, which coexpresses histone H2B fused at its carboxy terminus to EGFP ( Kanda et al., 1998 ) and histone H2B fused at its amino terminus to mCherry FP ( Tables S1 and S2 , and see Results section A FLIM–FRET assay for chromatin condensation), a previously described cell line stably expressing H2B-EGFP alone (HeLa H2B-GFP cells; provided by H. Kimura, Osaka University, Osaka, Japan; Kimura and Cook, 2001 ) was grown in DME (Invitrogen) supplemented with 10% FBS, 100 U/ml penicillin/streptomycin (Life Technologies), and 2 µg/ml blasticidin-S (Invitrogen). Exponentially growing cells (in 10-cm dishes) were then transfected with 1 µg of mCherry-H2B plasmid using the Effectene reagent protocol (QIAGEN). 48 h after transfection, the medium was changed with fresh DME containing 2 µg/ml blasticidin-S and 400 µg/ml G418 (Roche). After 15 d of drug selection, surviving colonies were checked under fluorescence microscopy, and those colonies expressing both EGFP and mCherry were isolated. Several clones were selected and expanded into cells lines for further analyses. FACS analyses were performed using a FACScan (BD). Cell culture, treatments, and transfections HeLa cells were cultured in DME supplemented with 10% FBS and 100 U/ml penicillin/streptomycin in a humidified incubator at 37°C with 5% CO 2 . The stable HeLa cell line expressing EGFP-C1 alone (HeLa EGFP ) was grown in DME supplemented with 10% FBS and 100 U/ml penicillin/streptomycin and containing 200 µg/ml G418 ( Trinkle-Mulcahy et al., 2003 ). The stable HeLa cell line expressing histone H2B-EGFP (HeLa H2B-GFP ; Kimura and Cook, 2001 ) was a gift from P.R. Cook (University of Oxford, Oxford, England, UK) and was cultured in DME supplemented with 10% FBS, 100 U/ml penicillin/streptomycin, and 2 µg/ml blasticidin-S ( Kanda et al., 1998 ; Kimura and Cook, 2001 ). HeLa H2B-2FP cells were cultured in DME supplemented with 10% FBS and 100 U/ml penicillin/streptomycin and containing 2 µg/ml blasticidin-S and 200 µg/ml G418. Metaphase spreads were prepared from HeLa H2B-2FP cells after mitotic shake off, swollen in prewarmed 0.56% KCl for 10 min at 37°C, air dried on slides by using a cytocentrifuge (Shandon Cytospin; Thermo Fisher Scientific), and then stained with 20 ng/ml Hoechst 33342. ATP depletion was performed by using 10 mM Na azide (Sigma-Aldrich) in combination with 50 mM 2-DG (Sigma-Aldrich). TSA (Sigma-Aldrich) was added to the cells at a final concentration of 200 ng/ml for 24 h. When indicated, cells were transfected with 1 µg/90-mm dish of the appropriate plasmid DNA using Effectene transfection reagent according to the manufacturer’s instructions. Cell fixation, immunostaining, and microscopy Cells were grown on glass coverslips and fixed for 5 min in 3.7% paraformaldehyde in 37°C PHEM buffer (60 mM Pipes, 25 mM Hepes, 10 mM EGTA, and 2 mM MgCl 2 , pH 6.9). After a 10-min permeabilization with 1% Triton X-100 in PBS, cells were blocked with 1% goat serum for 30 min and then incubated with primary antibodies for 1 h, washed, and incubated with secondary antibodies for 45 min. If required, cells were stained with 0.3 µg/ml DAPI (Sigma-Aldrich). After a final set of washes, cells were mounted in Vectashield media (Vector Laboratories). All images were acquired with a wide-field fluorescence microscope (DeltaVision Spectris; Applied Precision) and a CoolMax charge-coupled device camera (Roper Industries). Imaging was performed at room temperature using a 60× oil immersion NA 1.4 Plan-Apochromat objective from Olympus. SoftWoRx software (Applied Precision) was used for image acquisition and data deconvolution.
Show full methods section
Antibodies and plasmids
The antibodies used were as follows: anti-H2B (1:1,000; Millipore), anti-GFP (1:1,000; Roche), and anti-DsRed (1:5,000; Takara Bio Inc.) for Western blotting experiments; and anti–HP1-α (1:500; Euromedex), anti–CENP-C (1:100; gift from J. Swedlow, Wellcome Trust Centre for Gene Regulation and Expression, Dundee, Scotland, UK), and anti-H3K9triMe (1:250; Abcam) for immunostaining experiments. The H2B-EGFP expression vector (pBOS–H2B-GFP-N1) containing the blasticidin resistance gene as a selection marker was a gift from T. Kanda (Hokkaido University, Kita-ku, Sapporo, Japan) and G. Wahl (Salk Institute for Biological Studies, La Jolla, CA; Kanda et al., 1998 ). The mCherry-C1 expression vector containing the neomycin resistance gene as a selection marker was a gift from R.Y. Tsien (Howard Hughes Medical Institute, Chevy Chase, MD; Shaner et al., 2004 ). The mCherry-H2B expression vector was made by cutting the H2B-coding sequence from the pBOS–H2B-GFP vector with KpnI and BamHI restriction enzymes and subcloned into the cloning site of the mCherry-C1 expression vector. Expression vectors coding for EGFP coupled directly to mCherry through a 7-aa linker were generated as described previously ( Llères et al., 2007 ). In brief, EGFP cDNA was amplified by PCR using primers containing XhoI and BamHI sites added to both the 5′ and 3′ ends of the primers, respectively. PCR product was purified on a PCR purification column (QIAGEN) according to the manufacturer’s instructions. Purified PCR product was digested with the appropriate enzymes and cloned using standard methods into the compatible sites of the mCherry-C1 expression vector. The choice of restriction sites results in 7 aa separating the two proteins. Establishment of the HeLa H2B-GFP/mCherry-H2B stable cell line To generate HeLa H2B-GFP/mCherry-H2B , termed HeLa H2B-2FP in the manuscript, which coexpresses histone H2B fused at its carboxy terminus to EGFP ( Kanda et al., 1998 ) and histone H2B fused at its amino terminus to mCherry FP ( Tables S1 and S2 , and see Results section A FLIM–FRET assay for chromatin condensation), a previously described cell line stably expressing H2B-EGFP alone (HeLa H2B-GFP cells; provided by H. Kimura, Osaka University, Osaka, Japan; Kimura and Cook, 2001 ) was grown in DME (Invitrogen) supplemented with 10% FBS, 100 U/ml penicillin/streptomycin (Life Technologies), and 2 µg/ml blasticidin-S (Invitrogen). Exponentially growing cells (in 10-cm dishes) were then transfected with 1 µg of mCherry-H2B plasmid using the Effectene reagent protocol (QIAGEN). 48 h after transfection, the medium was changed with fresh DME containing 2 µg/ml blasticidin-S and 400 µg/ml G418 (Roche). After 15 d of drug selection, surviving colonies were checked under fluorescence microscopy, and those colonies expressing both EGFP and mCherry were isolated. Several clones were selected and expanded into cells lines for further analyses. FACS analyses were performed using a FACScan (BD). Cell culture, treatments, and transfections HeLa cells were cultured in DME supplemented with 10% FBS and 100 U/ml penicillin/streptomycin in a humidified incubator at 37°C with 5% CO 2 . The stable HeLa cell line expressing EGFP-C1 alone (HeLa EGFP ) was grown in DME supplemented with 10% FBS and 100 U/ml penicillin/streptomycin and containing 200 µg/ml G418 ( Trinkle-Mulcahy et al., 2003 ). The stable HeLa cell line expressing histone H2B-EGFP (HeLa H2B-GFP ; Kimura and Cook, 2001 ) was a gift from P.R. Cook (University of Oxford, Oxford, England, UK) and was cultured in DME supplemented with 10% FBS, 100 U/ml penicillin/streptomycin, and 2 µg/ml blasticidin-S ( Kanda et al., 1998 ; Kimura and Cook, 2001 ). HeLa H2B-2FP cells were cultured in DME supplemented with 10% FBS and 100 U/ml penicillin/streptomycin and containing 2 µg/ml blasticidin-S and 200 µg/ml G418. Metaphase spreads were prepared from HeLa H2B-2FP cells after mitotic shake off, swollen in prewarmed 0.56% KCl for 10 min at 37°C, air dried on slides by using a cytocentrifuge (Shandon Cytospin; Thermo Fisher Scientific), and then stained with 20 ng/ml Hoechst 33342. ATP depletion was performed by using 10 mM Na azide (Sigma-Aldrich) in combination with 50 mM 2-DG (Sigma-Aldrich). TSA (Sigma-Aldrich) was added to the cells at a final concentration of 200 ng/ml for 24 h. When indicated, cells were transfected with 1 µg/90-mm dish of the appropriate plasmid DNA using Effectene transfection reagent according to the manufacturer’s instructions. Cell fixation, immunostaining, and microscopy Cells were grown on glass coverslips and fixed for 5 min in 3.7% paraformaldehyde in 37°C PHEM buffer (60 mM Pipes, 25 mM Hepes, 10 mM EGTA, and 2 mM MgCl 2 , pH 6.9). After a 10-min permeabilization with 1% Triton X-100 in PBS, cells were blocked with 1% goat serum for 30 min and then incubated with primary antibodies for 1 h, washed, and incubated with secondary antibodies for 45 min. If required, cells were stained with 0.3 µg/ml DAPI (Sigma-Aldrich). After a final set of washes, cells were mounted in Vectashield media (Vector Laboratories). All images were acquired with a wide-field fluorescence microscope (DeltaVision Spectris; Applied Precision) and a CoolMax charge-coupled device camera (Roper Industries). Imaging was performed at room temperature using a 60× oil immersion NA 1.4 Plan-Apochromat objective from Olympus. SoftWoRx software (Applied Precision) was used for image acquisition and data deconvolution.
5-FU incorporation assay
HeLa cells, either mock treated or ATP depleted for 30 min or after washing and recovery for 30 min, were incubated with 2 mM 5-FU (Sigma-Aldrich) for 30 min at 37°C. Subsequently, cells were fixed, permeabilized, and incubated with primary anti-BrdU antibody (1:500; Sigma-Aldrich). Immunofluorescence microscopy was performed as indicated in the previous section.
Gel electrophoresis and immunoblotting
In brief, cells were scrapped, pelleted, resuspended in 2× reducing loading buffer (Invitrogen), and denatured at 90°C for 5 min. For Western blot analysis, proteins resolved by 10% Bis-Tris SDS-PAGE were transferred to nitrocellulose filters and probed with specific primary antibodies and the corresponding horseradish peroxidase–conjugated secondary antibodies (GE Healthcare). An ECL reagent (GE Healthcare) was used to visualize protein bands according to the manufacturer’s instructions. Red Ponceau staining of the transferred proteins was used to assess equal loading of the samples. In Fig. 2 D , HeLa H2B-2FP cells in physiological buffer (PB; Kimura et al., 1999 ) were divided into five 100-µl aliquots. One ( Fig. 2 D , lane 1) was mixed with 100 µl PB. Others were mixed with 100 µl PB plus 0.2% Triton X-100 and NaCl to give a final concentration of 0–1 M ( Fig. 2 D , lanes 2–4). After incubation (10 min at 0°C) and pelleting (20,000 g for 1 h at 4°C), 180 µl of the supernatant was collected and mixed with an equal volume of loading buffer ( Fig. 2 D ). The pellet was resuspended in 180 µl PB, and 200 µl of 2× loading buffer was added (Fig. S1 B). The nucleosomal proteins were also resolved in a 10% polyacrylamide gel stained with Coomassie ( Fig. 2 D , top). MNase digestion of chromatin HeLa cells and stable cells expressing H2B-EGFP (HeLa H2B-GFP ) or both H2B-EGFP and mCherry-H2B (HeLa H2B-2FP ) were trypsinized, harvested, and washed once with 1× RSB buffer (10 mM Tris, pH 7.6, 15 mM NaCl, and 1.5 mM MgCl 2 ). After centrifugation, the cell pellet was resuspended in 1× RSB buffer with 1% Triton-X 100 and homogenized by five strokes with a loose-fitting pestle to release nuclei. Nuclei were collected by centrifugation and washed twice with 1 ml of buffer A (15 mM Tris, pH 7.5, 15 mM NaCl, 60 mM KCl, 0.34 M sucrose, 0.5 mM spermidine, 0.15 mM spermine, 0.25 mM PMSF, and 0.1% β-mercaptoethanol). Nuclei were finally resuspended in 1.5 ml of buffer A, and 15 µl of 0.1 M CaCl 2 was added. For making nucleosomal ladders, 0.5 ml of suspended nuclei was digested by adding 1 µl of 200 U/ml MNase (Sigma-Aldrich) at 37°C. 60-µl aliquots were taken at each time point (5, 15, 30, and 60 min), and 1.5 µl EDTA was added to stop the reaction ( Telford and Stewart, 1989 ). To each tube, 18 µl H 2 O, 12 µl of 10% SDS, and 24 µl of 5 M NaCl were added. The mixtures were extracted with phenol-chloroform, and 5 µl of supernatant was analyzed by 1.5% agarose gel electrophoresis.
Fluorescence lifetime measurements by time-correlated single-photon counting
(TCSPC) for FRET measurements FRET can be used to image direct protein–protein interactions in cells. While transferring energy from an excited donor to an acceptor ( Lakowicz, 2006 ), FRET decreases the donor fluorescence and increases the acceptor fluorescence. Because the energy transfer is highly distance dependent, detection of FRET requires that the two fluorophores must be within ∼1–10 nm, i.e., the distance typically found for directly interacting proteins ( Förster, 1949 ). In this study, as a quantitative readout of FRET, we measured the fluorescence lifetime of the donor, which was defined as the mean time between fluorophore excitation and photon emission by using a FLIM approach. FLIM was performed using an inverted multiphoton laser-scanning microscope (Radiance 2100MP; Bio-Rad Laboratories) with a 60× oil immersion NA 1.4 Plan-Apochromat objective from Nikon. The software used to run the Radiance 2100MP multiphoton microscope was Lasersharp 2000 (Bio-Rad Laboratories). The microscope was equipped with a Solent Scientific’s incubation chamber suitable to maintain the live cells and optics at constant temperature (usually 37°C). The chamber was constructed with black walls to exclude external sources of light during the sensitive period of FLIM measurement. Two-photon excitation was achieved using a Chameleon Verdi–pumped ultrafast tunable (720–930 nm) laser (Coherent) to pump a mode-locked frequency-doubled Ti:Sapphire laser that provided sub–200-femtosecond pulses at a 90-Mhz repetition rate with an output power of 1.4 W at the peak of the tuning curve (800 nm). Enhanced detection of the scattered component of the emitted (fluorescence) photons was afforded by the use of fast single-photon response direct detectors (model 5783P; Hamamatsu Photonics). The fluorescence lifetime imaging capability was provided by TCSPC electronics (SPC-830; Becker & Hickl GmbH). TCSPC measures the time elapsed between laser pulses and the fluorescence photons. Indeed, when fluorophore molecules absorb a quantum of light, a valence electron is boosted up into a higher energy orbit, creating an excited state. When this electron returns to its original lower energy orbit (the ground state level), a quantum of light may be emitted. By consequence, the fluorescence lifetime occurs on the nanosecond time scale, and FLIM measurements reflect events occurring in an extremely short period of time. The TCSPC method used in this study is based on the detection of single photons, the measurement of the detection times of the individual photons, and the reconstruction of the waveform from the individual time measurements. Over this integration time, the waveform of the optical pulse builds up and corresponds to a histogram presenting the number of photons recorded for each nanosecond’s detection time interval. Therefore, the FLIM technique provides us with the spatial map distribution of the variations of the fluorescence lifetimes and, indirectly, of the FRET efficiencies at each pixel throughout the nucleus ( Becker, 2005 ). EGFP and mCherry fluorophores were used as a FRET pair for all of the FLIM–FRET measurements. The optimal two-photon excitation wavelength to excite the donor (EGFP) was determined to be 890 nm. Fluorescence emission of EGFP fusion proteins was collected using a bandpass filter (528 ± 25 nm) to limit detection to only the donor fluorophore (EGFP) and prevent contamination from the acceptor (mCherry) emission ( Llères et al., 2007 ). Laser power was adjusted to give a mean photon count rate of the order 10 4 –10 5 photons/s. For imaging live cells by FLIM, the standard growth medium was replaced with CO 2 -independent phenol red–free DME (Invitrogen) supplemented with 10% FBS and 100 U/ml penicillin/streptomycin. Fluorescence lifetime measurements during mitosis were acquired over 90 s. In interphase cells, FLIM measurements were collected over 120 s. Fluorescence lifetimes were calculated for all pixels in the field of view (256 × 256 pixels) or for a particular selected region of interest (ROI; e.g., nucleus) using SPCImage software (Becker & Hickl GmbH).
Analysis of the fluorescence lifetime measurements for FRET experiments
The analysis of the FLIM measurements was performed by using SPCImage software. Because FRET interactions cause a decrease in the fluorescence lifetime of the donor molecules (EGFP), the FRET efficiency can be calculated by comparing the FLIM values obtained for the EGFP donor fluorophores in the presence and absence of the mCherry acceptor fluorophores ( Fig. 3 A , right; and Fig. 5 A , right). Mean FRET efficiency images were calculated such as the FRET efficiency, E FRET = 1 − (τ DA /τ D ), where τ DA is the mean fluorescence lifetime of the donor (H2B-EGFP) in the presence of the acceptor (mCherry-H2B) expressed in the HeLa H2B-2FP and τ D is the mean fluorescence lifetime of the donor (H2B-EGFP) expressed in HeLa H2B-GFP in the absence of acceptor for all of the cells imaged. In the non-FRET conditions, the mean fluorescence lifetime value of the donor in the absence of the acceptor was calculated from a mean of the τ D by applying a monoexponential decay model to fit the fluorescence lifetime decays. It was necessary to apply the best-fitting model to extract an accurate fluorescence lifetime value from the decays. For this purpose, several parameters could be adjusted to optimize the χ 2 of the fit close to one. For example, we defined a threshold value representing the background to establish a minimum number of photons in the peak of a fluorescence curve. Pixels with lower photon numbers were not analyzed by the fitting procedure. This improved the quality of the lifetime parameter histogram. We adjusted the shift parameter to optimize the χ 2 value to as close to one as possible. The scatter parameter (amount of scattered excitation light detected) should be adjusted to a value of either zero or close to zero. Then, in the FRET conditions, we applied a biexponential fluorescence decay model to fit the experimental decay curves f(t) = a e −t/τDA + b e −t/τD . We obtained information about the lifetime of two populations of molecules, i.e., the noninteracting donor population τ D and the donor population that was interacting with the acceptor (τ DA ) as well as the intensity factors a and b of the two decay components. By fixing the noninteracting proteins lifetime τ D using data from control experiments (in the absence of FRET), the value of τ DA was estimated. Then, by knowing both values τ DA and τ D at each single pixel, the FRET efficiency (E FRET ) was derived by applying the following equation: E FRET = 1 − (τ DA /τ D ) at each pixel in a selected ROI using SPCImage software. For FLIM–FRET measurements during interphase, the selected ROI generally comprised several interphase nuclei (see the legends for Figs. 3–5 and Fig. S2 for more details). During mitosis acquisitions, the particular ROI comprised the metaphasic equatorial plate in metaphase, the two separate paired chromosomes in early and late anaphase, or the two daughter nuclei during telophase (see the legends for Fig. 6 and Fig. S5). Furthermore, the FRET distribution curves ( Fig. 3 A , right) from these ROIs were displayed from the extracted associated matrix using SPCImage software and then normalized. In each experiment, FLIM was performed on multiple cells, as indicated in figure legends, in three independent experiments. Enrichment in short lifetime pixels ( Fig. 4 F , high FRET pixels) over time was quantified from the lifetime distribution histograms. The lifetime histogram for each time point was normalized by the total number of pixels F i = f i /N i , where f i and N i are, respectively, the lifetime histogram and the total number of pixels at time point t = i .
Statistical analysis
To interpret the distribution of the percent FRET efficiency data, box and whisker plots were used. The box and whisker plot is a histogram-like method for displaying upper and lower quartiles and maximum and minimum values in addition to median. We used a nonparametric Mann-Whitney test to compare the medians of each dataset for the two-photon FLIM measurements using Prism software (GraphPad Software, Inc.). FRAP HeLa H2B-2FP cells were cultured in glass-bottomed dishes (WILCO; Intracel). Before imaging, growth medium was replaced with phenol red–free CO 2 -independent medium (Invitrogen). In all experiments, a 60× oil immersion NA 1.4 Plan-Apochromat objective (Olympus) was used. HeLa H2B-2FP cells were photobleached by using the photokinetic experiment function of the DeltaVision Spectris wide-field fluorescence microscope ( Phair and Misteli, 2001 ). In brief, a small region in the cells was photobleached with a 488-nm laser (100% laser power for the duration of 0.15 s), and time-lapse sequences of single optical sections for imaging EGFP fluorescence were collected with an exposure time of 0.1 s for each image. SoftWoRx software was used for image acquisition. The fluorescence intensities in the bleached and nonbleached area before and after laser photobleaching were quantitated with the SoftWoRx software. These fluorescence intensity measurements were corrected from the total fluorescence intensity before and after laser photobleaching and from the background intensity level. The mobile fraction of the proteins was calculated using Excel (Microsoft) and Prism software. TEM After fixation in 4% paraformaldehyde/2.5% glutaraldehyde in 0.2 M Pipes, pH 7.3, cells were scraped and then pelleted in Eppendorf tubes and rinsed in 0.2 M Pipes. Samples were postfixed in 1% aqueous osmium tetroxide, rinsed in water, dehydrated in graded alcohol-propylene oxide, and then embedded in Durapan resin (Sigma-Aldrich). Serial sections (60–70 nm) were cut on an ultramicrotome (Ultracut UCT; Leica) and collected on 100 mesh copper grids coated with 1% Pioloform (Agar) in chloroform. Sections were stained with uranyl acetate and lead citrated and examined with a transmission electron microscope (Tecnai 12; FEI) at 6,000 magnification. Images were collected on digital imaging plates, which were read out with a micrometer imaging plate scanner (Ditabis; Digital Biomedical Imaging Systems AG). Online supplemental material Fig. S1 shows the structural model organization of a nucleosome core particle labeled with both H2B-EGFP and mCherry-H2B fluorescent-tagged histones and the biochemical characterization of the HeLa H2B-2FP stable cell line. Fig. S2 shows the effect of ATP depletion on the mean fluorescence lifetime of H2B-GFP (donor) and the effect on the localization of H3K9triMe staining. Fig. S3 shows the mobility by FRAP of H2B-EGFP upon ATP depletion. Fig. S4 shows the statistical analysis of the FRET efficiency percentage upon TSA treatment and the relocalization of CENP-C and HP1-α proteins after TSA treatment. Fig. S5 shows time-lapse FLIM–FRET measurements of a HeLa H2B-2FP cell progressing along mitosis from prometaphase to telophase and the FRET distributions of the control HeLa H2B-GFP stable cell line. Videos 1 and 2 show time-lapse videos of HeLa H2B-2FP cells either untreated or upon ATP depletion treatment, respectively. Tables S1 and S2 show DNA sequences of the H2B-EGFP and mCherry-H2B histone genes, respectively. Online supplemental material is available at http://www.jcb.org/cgi/content/full/jcb.200907029/DC1 .
Online supplemental material Fig. S1 shows the structural model organization of a nucleosome core particle labeled with both H2B-EGFP and mCherry-H2B fluorescent-tagged histones and the biochemical characterization of the HeLa H2B-2FP stable cell line. Fig. S2 shows the effect of ATP depletion on the mean fluorescence lifetime of H2B-GFP (donor) and the effect on the localization of H3K9triMe staining. Fig. S3 shows the mobility by FRAP of H2B-EGFP upon ATP depletion. Fig. S4 shows the statistical analysis of the FRET efficiency percentage upon TSA treatment and the relocalization of CENP-C and HP1-α proteins after TSA treatment. Fig. S5 shows time-lapse FLIM–FRET measurements of a HeLa H2B-2FP cell progressing along mitosis from prometaphase to telophase and the FRET distributions of the control HeLa H2B-GFP stable cell line. Videos 1 and 2 show time-lapse videos of HeLa H2B-2FP cells either untreated or upon ATP depletion treatment, respectively. Tables S1 and S2 show DNA sequences of the H2B-EGFP and mCherry-H2B histone genes, respectively. Online supplemental material is available at http://www.jcb.org/cgi/content/full/jcb.200907029/DC1 .
📊 Figures
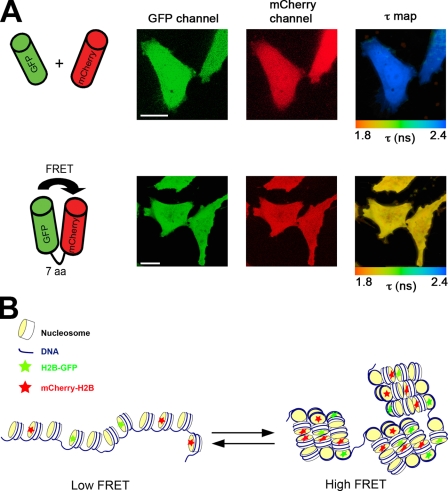
Figure 1.
In vivo FLIMu2013FRET assay for chromatin compaction. (A) HeLa cells coexpressing either free EGFP and mCherry (top) or EGFP-fused to mCherry through a 7-aa linker (bottom) were imaged by multiphoton ...
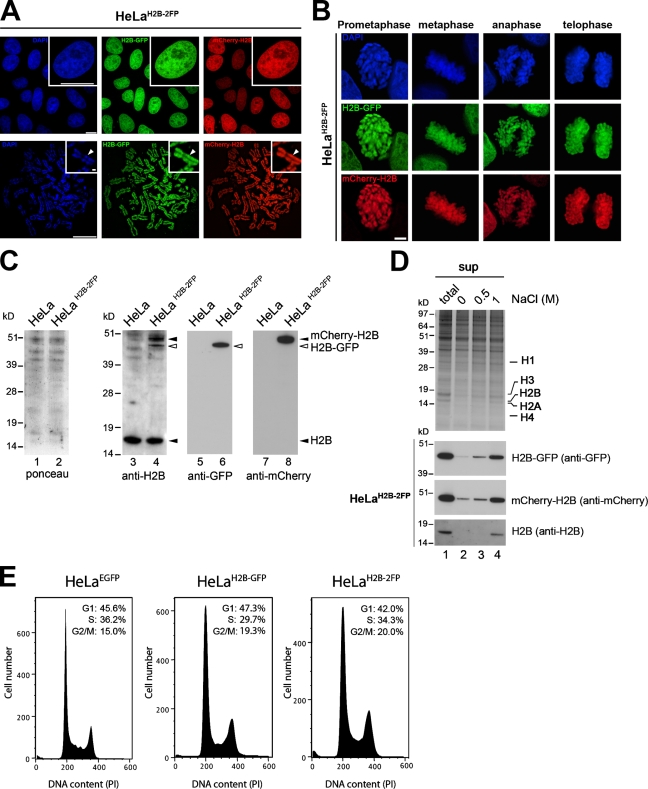
Figure 2.
A stable HeLa H2B-2FP cell line coexpressing H2B-EGFP and mCherry-H2B histones. (A) Fluorescent-tagged H2B histones in HeLa H2B-2FP cells imaged by wide-field fluorescence microscopy in interphase (to...
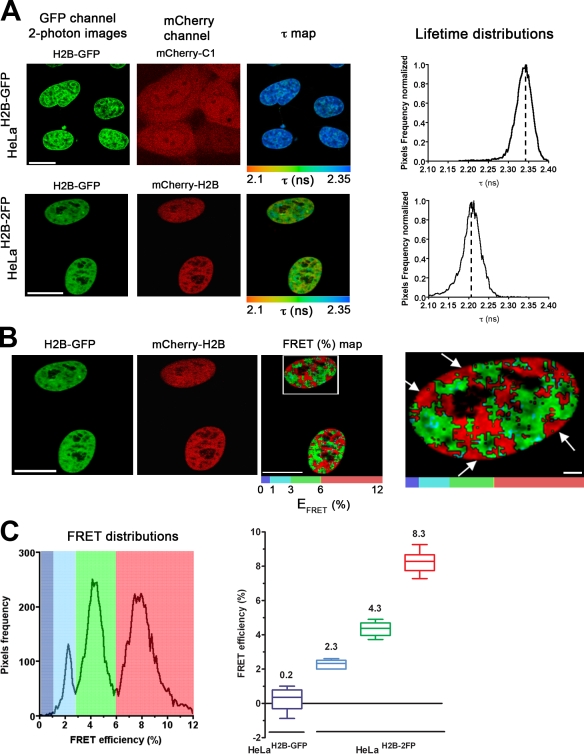
Figure 3.
FLIMu2013FRET measurements spatially discriminate differential chromatin compaction levels in vivo. (A) HeLa H2B-GFP stable cell line transiently transfected with mCherry-C1 empty vector (top) and HeL...
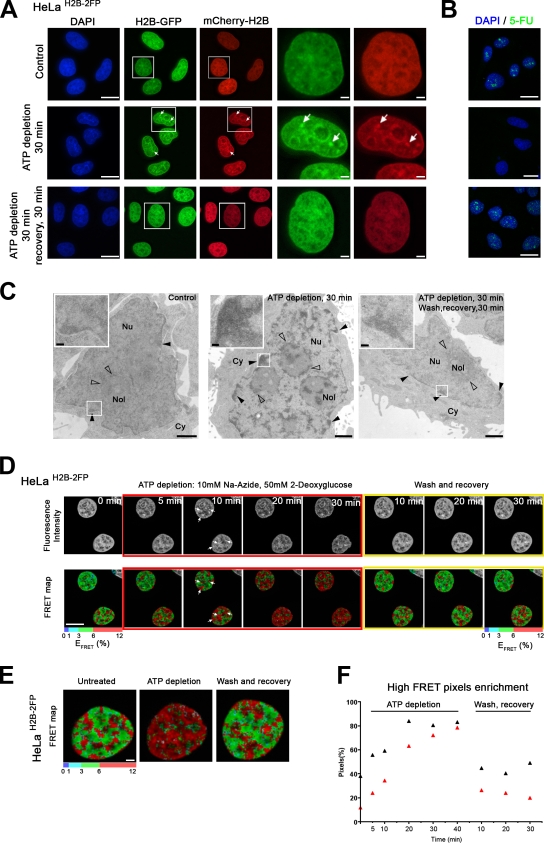
Figure 4.
ATP levels reversibly alter the chromatin compaction balance. (A) Effects of ATP depletion on chromatin organization. HeLa H2B-2FP cells were imaged, and the distribution of both H2B-EGFP (green)u2013...
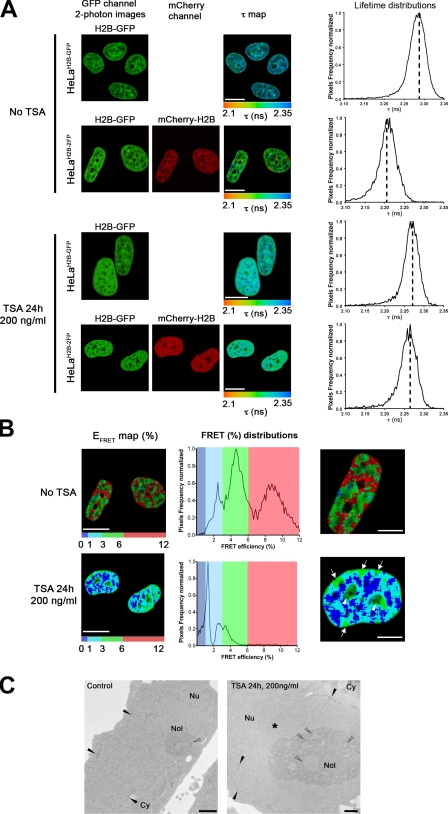
Figure 5.
FLIMu2013FRET analysis of TSA-induced changes in higher order chromatin organization. (A) The spatial distribution of the mean fluorescence lifetime (u03c4 map) in the ROI is shown for both HeLa H2B-G...
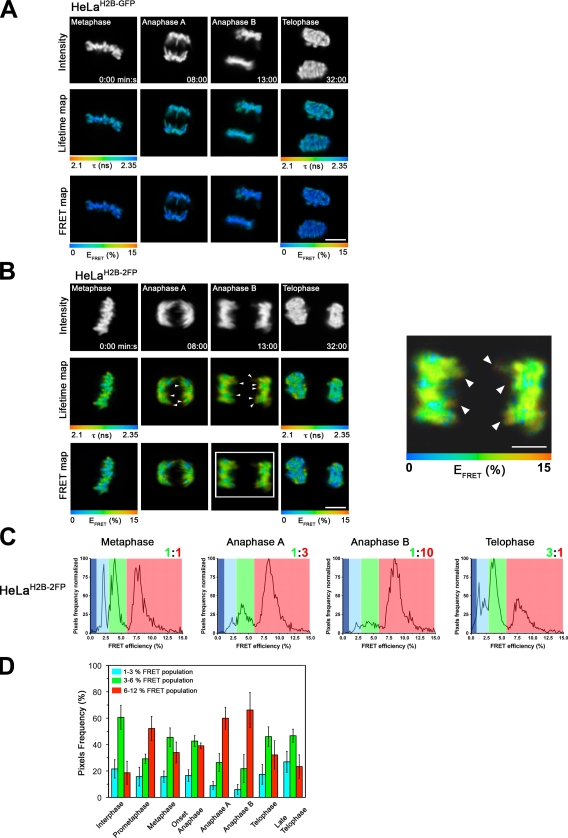
Figure 6.
FLIMu2013FRET analysis of chromosome compaction during mitosis. (A) Time-lapse FLIMu2013FRET measurements of HeLa H2B-GFP cells at different stages of mitosis. (top) Fluorescence intensity of the dono...
Figure images are served from the NIH/NLM PubMed Central Open Access Subset or Europe PMC; copyright remains with the publishers and authors.
💬 Discussion
0 commentsNo comments yet. Be the first to start a discussion!
Leave a Comment