Abstract
Polarized cells frequently use diffusion barriers to separate plasma membrane domains. It is unknown whether diffusion barriers also compartmentalize intracellular organelles. We used photobleaching techniques to characterize protein diffusion in the yeast endoplasmic reticulum (ER). Although a soluble protein diffused rapidly throughout the ER lumen, diffusion of ER membrane proteins was restricted at the bud neck. Ultrastructural studies and fluorescence microscopy revealed the presence of a ring of smooth ER at the bud neck. This ER domain and the restriction of diffusion for ER membrane proteins through the bud neck depended on septin function. The membrane-associated protein Bud6 localized to the bud neck in a septin-dependent manner and was required to restrict the diffusion of ER membrane proteins. Our results indicate that Bud6 acts downstream of septins to assemble a fence in the ER membrane at the bud neck. Thus, in polarized yeast cells, diffusion barriers compartmentalize the ER and the plasma membrane along parallel lines.
🔬 Techniques
🔭 Microscopes
🧬 Organisms
💻 Software
✨ Fluorophores
🧪 Sample Preparation
🏭 Microscope Brands
🧪 Reagent Suppliers
📷 Detectors
🔎 Objectives
💻 Software Details
💾 Data Repositories
🏛️ Research Organizations (ROR)
Affiliated research institutions:
📋 Methods
Strain construction Yeast strains were constructed by standard genetic techniques. Diploids were isolated on selective medium and subsequently sporulated at 23°C. The background is, unless specified otherwise, S288c. ssGFP-HDEL was expressed from the 2-μm vector pG14 ( Lesser and Guthrie, 1993 ); ssGFP-HDEL has the signal peptide of CTS1 and the HDEL retrieval sequence at its COOH terminus (a gift from E. Bertrand, Centre National de la Recherche Scientifique, Montpellier, France). Strains containing Sec61-GFP (provided by D. Liakopoulos, Swiss Federal Institute of Technology [ETH], Zurich, Switzerland), Spa2-GFP, Bud6-GFP, Hmg1-GFP, or pGAL-GFP-Sec22 were made using the PCR-based integration system ( Longtine et al., 1998 ). The different deletions shown in Table I were obtained from the EUROSCARF deletion collection (S288c) and provided to us by M. Peter (ETH, Zurich, Switzerland). Each time that an effect was observed, the mutation was backcrossed several times into our background. The hsl1 Δ , gin4 Δ, shs1 Δ, and swe1 Δ strains are isogenic with S288c. Cdc12-GFP was expressed from a centromeric plasmid ( Dobbelaere et al., 2003 ). The sec18-1 and cdc48-6 strains were gifts of R. Collins (Cornell University, Ithaca, NY) and S. Jentsch (Max Planck Institute, Münich, Germany), respectively. FLIP and FRAP experiments Cells were grown on YPD plates, resuspended in liquid nonfluorescent medium, and immobilized on nonfluorescent medium ( Waddle et al., 1996 ) containing 1.6% agarose. Photobleaching was applied on the area shown on the figures, using a microscope (model LSM510; Carl Zeiss MicroImaging, Inc.) and a Plan-Apochromat 100× objective (NA 1.4). For FRAP, scans were collected at 5-s intervals for a minimum of 120 s using the acquisition software LSM510 (Carl Zeiss MicroImaging, Inc.). Bleaching regions were irradiated with 250 iterations of 50% laser intensity at 30% output of an argon laser (488 nm) and scans were collected with typically 1% laser intensity at the same conditions. All pictures of FLIP experiments shown in the figures were treated to account for the bleaching due to image acquisition, whereas the movies were left untreated. Pictures shown in Fig. 4 B were taken on a spinning-disc confocal system (Axiovert 200M; Carl Zeiss MicroImaging, Inc.) with a Plan-Apochromat 100× objective. The overlay picture was taken on a DeltaVision microscope (Applied Precision) and deconvolved using the softwox software. FLIP analysis of septin mutants ( cdc12-1 and cdc12-6 ) cdc12-1 mutant cells were grown to early log phase at permissive temperature (24°C) in liquid YPD medium and arrested in G1 with 5 μg/ml α-factor for 2.5 h. After removal of α-factor from the medium by washing twice with fresh YPD, cells were mounted on nonfluorescent agarose beds as described in the previous section and immediately shifted to 35°C on a heated stage. FLIP analysis was performed on buds formed after the temperature shift, starting after 30 min. cdc12- 6 cells were grown to mid-log phase on YPD plates at 22°C (permissive), mounted on agarose beds, and shifted to 35°C on the heated stage. FLIP analysis was performed in medium- to large-budded preanaphase cells 30 min after temperature shift.
Show full methods section
Strain construction Yeast strains were constructed by standard genetic techniques. Diploids were isolated on selective medium and subsequently sporulated at 23°C. The background is, unless specified otherwise, S288c. ssGFP-HDEL was expressed from the 2-μm vector pG14 ( Lesser and Guthrie, 1993 ); ssGFP-HDEL has the signal peptide of CTS1 and the HDEL retrieval sequence at its COOH terminus (a gift from E. Bertrand, Centre National de la Recherche Scientifique, Montpellier, France). Strains containing Sec61-GFP (provided by D. Liakopoulos, Swiss Federal Institute of Technology [ETH], Zurich, Switzerland), Spa2-GFP, Bud6-GFP, Hmg1-GFP, or pGAL-GFP-Sec22 were made using the PCR-based integration system ( Longtine et al., 1998 ). The different deletions shown in Table I were obtained from the EUROSCARF deletion collection (S288c) and provided to us by M. Peter (ETH, Zurich, Switzerland). Each time that an effect was observed, the mutation was backcrossed several times into our background. The hsl1 Δ , gin4 Δ, shs1 Δ, and swe1 Δ strains are isogenic with S288c. Cdc12-GFP was expressed from a centromeric plasmid ( Dobbelaere et al., 2003 ). The sec18-1 and cdc48-6 strains were gifts of R. Collins (Cornell University, Ithaca, NY) and S. Jentsch (Max Planck Institute, Münich, Germany), respectively. FLIP and FRAP experiments Cells were grown on YPD plates, resuspended in liquid nonfluorescent medium, and immobilized on nonfluorescent medium ( Waddle et al., 1996 ) containing 1.6% agarose. Photobleaching was applied on the area shown on the figures, using a microscope (model LSM510; Carl Zeiss MicroImaging, Inc.) and a Plan-Apochromat 100× objective (NA 1.4). For FRAP, scans were collected at 5-s intervals for a minimum of 120 s using the acquisition software LSM510 (Carl Zeiss MicroImaging, Inc.). Bleaching regions were irradiated with 250 iterations of 50% laser intensity at 30% output of an argon laser (488 nm) and scans were collected with typically 1% laser intensity at the same conditions. All pictures of FLIP experiments shown in the figures were treated to account for the bleaching due to image acquisition, whereas the movies were left untreated. Pictures shown in Fig. 4 B were taken on a spinning-disc confocal system (Axiovert 200M; Carl Zeiss MicroImaging, Inc.) with a Plan-Apochromat 100× objective. The overlay picture was taken on a DeltaVision microscope (Applied Precision) and deconvolved using the softwox software. FLIP analysis of septin mutants ( cdc12-1 and cdc12-6 ) cdc12-1 mutant cells were grown to early log phase at permissive temperature (24°C) in liquid YPD medium and arrested in G1 with 5 μg/ml α-factor for 2.5 h. After removal of α-factor from the medium by washing twice with fresh YPD, cells were mounted on nonfluorescent agarose beds as described in the previous section and immediately shifted to 35°C on a heated stage. FLIP analysis was performed on buds formed after the temperature shift, starting after 30 min. cdc12- 6 cells were grown to mid-log phase on YPD plates at 22°C (permissive), mounted on agarose beds, and shifted to 35°C on the heated stage. FLIP analysis was performed in medium- to large-budded preanaphase cells 30 min after temperature shift.
Quantification of FLIP experiments
Analysis of the FLIP experiments was performed using the ImageJ 1.29 software ( http://rsb.info.nih.gov/ij ). The loss of fluorescence over time was measured in different regions of interest (usually the mother cortex, bud cortex, and perinuclear ER). In addition, we measured the loss of fluorescence on neighboring control cells to account for the loss due to visualization. Finally, we measured the intensity of the background. The intensity in the region of interest was calculated as (region − background)/(control cell − background) and then put in fractions. BODIPY staining of ER membranes, light and electron microscopy, and image processing For BODIPY staining, cells were grown overnight to early to mid-log phase in YPD, harvested, and resuspended in SC media to 5 OD 600 /ml. The culture was incubated for 10 min at 30°C under agitation. Defatted BSA was added to a final concentration of 5 mg/ml and supplemented with 2.5 μl C6 BODIPY ceramide (4 mM stock in DMSO; Molecular Probes). The cells were incubated for 20 min at 30°C under agitation and mounted for direct inspection. Alternatively, the cells were fixed after the incubation period with 4% formaldehyde. No difference in the staining was detected between life and fixed cells. Light microscopy was performed using either a DeltaVision microscope (DeltaVision Spectris System; Applied Precision) equipped with a Coolsnap HQ camera (Roper Scientific) or an Olympus BX50 equipped with a camera Imago (TiLL Photonics). In all cases, we used 100× objectives of NA 1.4. Deconvolution was performed by a constrained iterative method using the softwox software (Applied Precision). Further image processing was performed using the Photoshop software (Adobe) and was reduced to the optimization of the levels. No gamma adjustments were applied. Unless otherwise indicated, light microscopy was performed at RT (22°C) as described previously ( Dobbelaere et al., 2003 ). EM was performed as described previously ( Sandmann et al., 2003 ).
Model
The quantitative transport model was formulated on the basis of standard physical principles, leading to a system of coupled differential equations. Photobleaching and scanning cycles were modeled as algebraic equations. Online supplemental material The quantitative transport model is fully described and assessed in the online supplemental material. Online supplemental material is available at http://www.jcb.org/cgi/content/full/jcb.200412143/DC1 .
Online supplemental material The quantitative transport model is fully described and assessed in the online supplemental material. Online supplemental material is available at http://www.jcb.org/cgi/content/full/jcb.200412143/DC1 .
📊 Figures
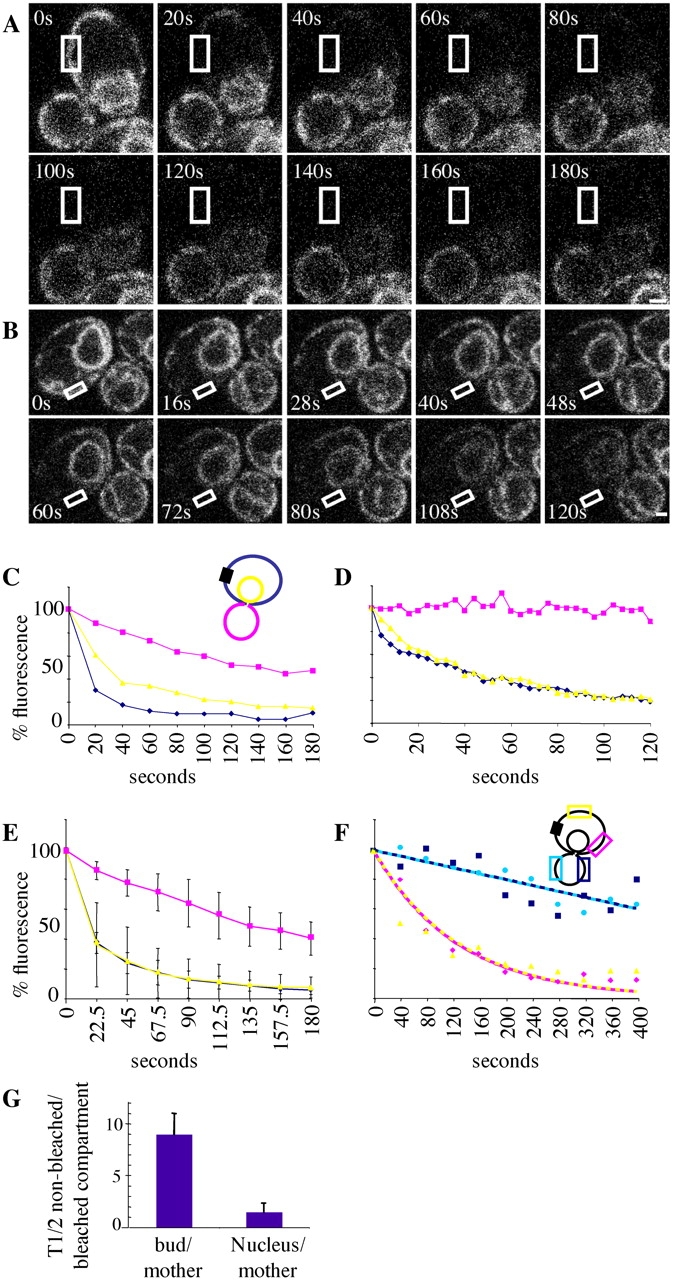
Figure 1.
Dynamics of the translocon subunit Sec61 throughout the yeast ER during metaphase. (A and B) Diffusion from the mother cortex to the bud cortex is slow. FLIP was performed on a metaphase cell expressi...
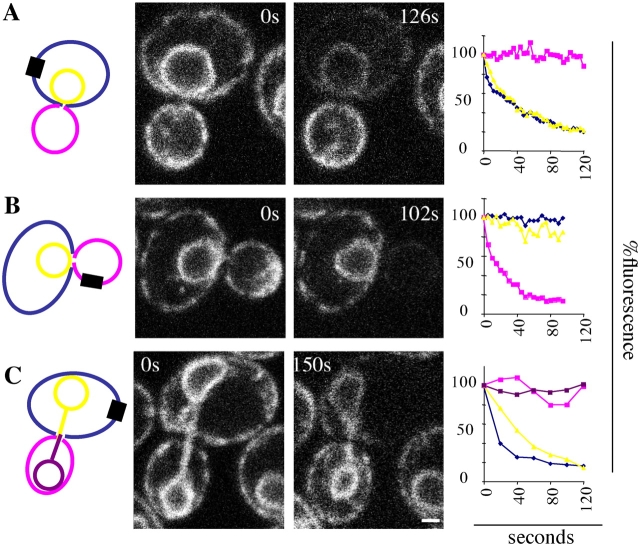
Figure 2.
Dynamics of the translocon subunit Sec61 during a different cell cycle stage. (Au2013C) FLIP is applied on cells expressing Sec61-GFP. Color codes and cartoons are as in Fig. 1 C. Relevant frames are ...
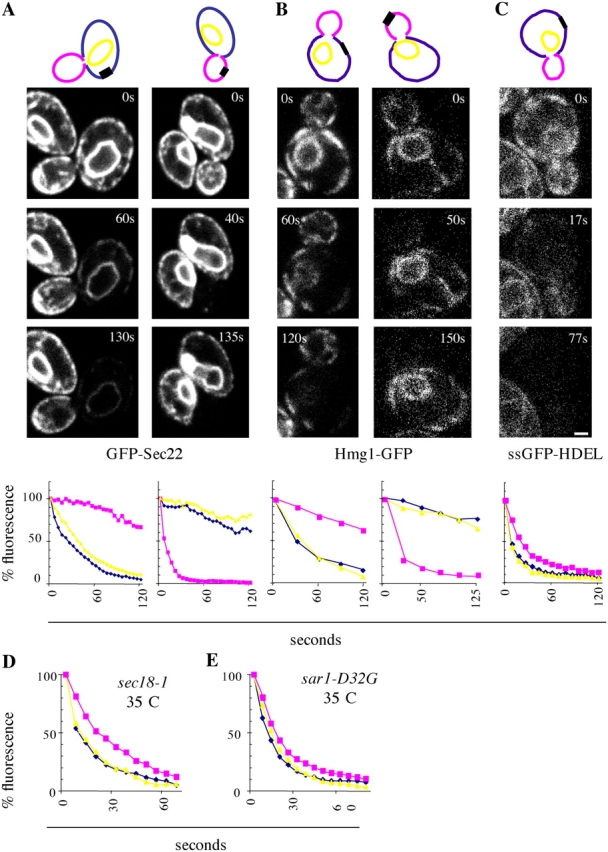
Figure 3.
The diffusion barrier is observed in the membrane of the ER but not in the ER lumen. (A) FLIP experiments on metaphase cells expressing GFP-Sec22 under the control of the GAL1 promotor. Photobleaching...
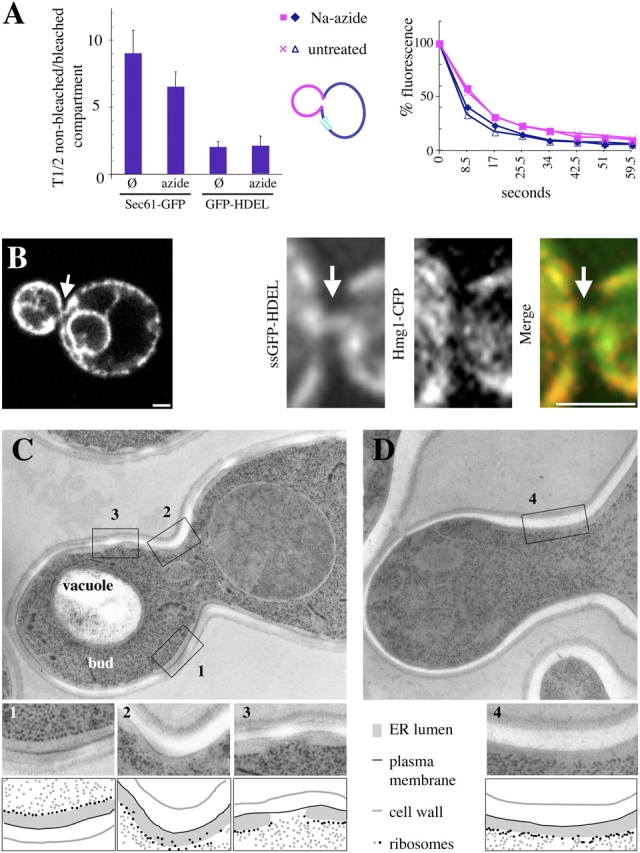
Figure 4.
The ER is continuous through the bud neck and forms a septin-dependent smooth ER structure at the bud neck. (A) Photobleaching was applied to WT cells expressing Sec61-GFP or ssGFP-HDEL treated or not...
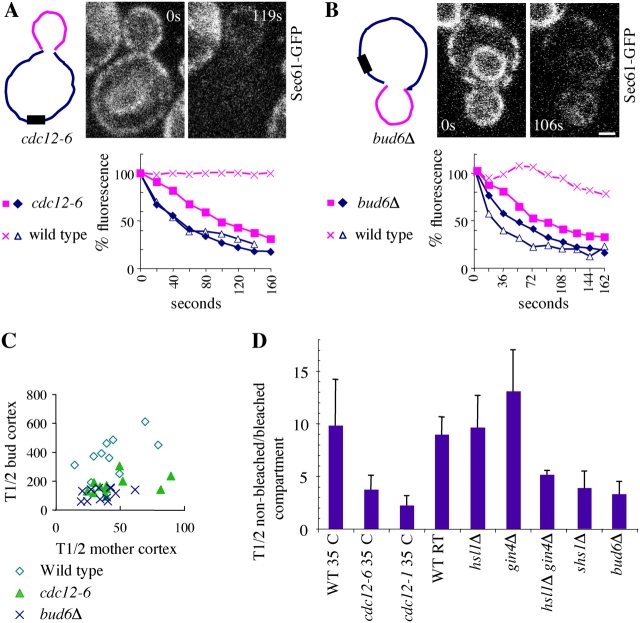
Figure 5.
ER compartmentalization depends on the septins, the SDKs, and Bud6. (A) FLIP experiment on a cdc12-6 cell expressing Sec61-GFP. Photobleaching was applied to the mother cortex. Two frames are shown. T...
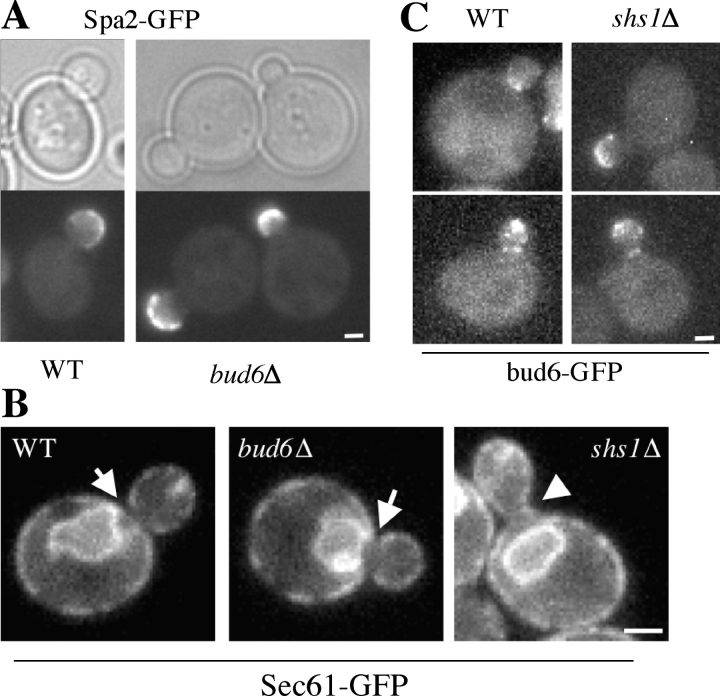
Figure 6.
Bud6 acts downstream of the septins to establish the ER compartmentalization barrier. (A) The plasma membrane is compartmentalized in bud6 u0394 mutant cells. WT and bud6 u0394 mutant cells expressing...
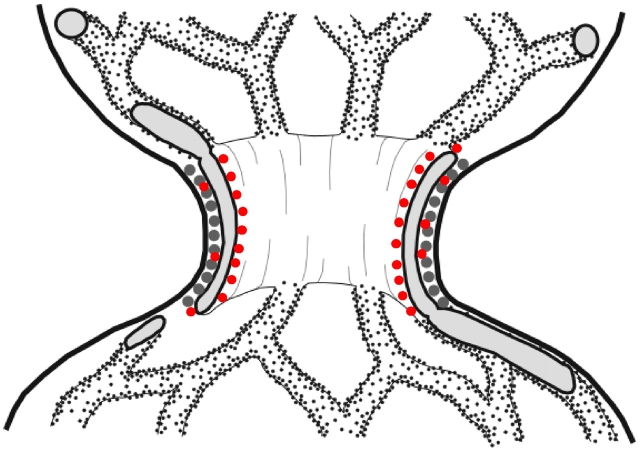
Figure 7.
Model of rough and smooth ER in the bud neck of yeast cells. Sections through the septin filaments are shown in green. Bud6 localization to the smooth ER is symbolized by red dots.
Figure images are served from the NIH/NLM PubMed Central Open Access Subset or Europe PMC; copyright remains with the publishers and authors.
💬 Discussion
0 commentsNo comments yet. Be the first to start a discussion!
Leave a Comment