Abstract
AbstractExtracellular vesicles (EVs) and their cargo constitute novel biomarkers. EV subpopulations have been defined not only by abundant tetraspanins (e.g., CD9, CD63 and CD81) but also by specific markers derived from their source cells. However, it remains a challenge to robustly isolate and characterize EV subpopulations. Here, we combined affinity isolation with super‐resolution imaging to comprehensively assess EV subpopulations from human plasma. Our Single Extracellular VEsicle Nanoscopy (SEVEN) assay successfully quantified the number of affinity‐isolated EVs, their size, shape, molecular tetraspanin content, and heterogeneity. The number of detected tetraspanin‐enriched EVs positively correlated with sample dilution in a 64‐fold range (for SEC‐enriched plasma) and a 50‐fold range (for crude plasma). Importantly, SEVEN robustly detected EVs from as little as ∼0.1 μL of crude plasma. We further characterized the size, shape and molecular tetraspanin content (with corresponding heterogeneities) for CD9‐, CD63‐ and CD81‐enriched EV subpopulations. Finally, we assessed EVs from the plasma of four pancreatic ductal adenocarcinoma patients with resectable disease. Compared to healthy plasma, CD9‐enriched EVs from patients were smaller while IGF1R‐enriched EVs from patients were larger, rounder and contained more tetraspanin molecules, suggestive of a unique pancreatic cancer‐enriched EV subpopulation. This study provides the method validation and demonstrates that SEVEN could be advanced into a platform for characterizing both disease‐associated and organ‐associated EV subpopulations.
🔬 Techniques
🔭 Microscopes
✨ Fluorophores
🧪 Sample Preparation
🏭 Microscope Brands
🧪 Reagent Suppliers
📷 Detectors
💻 Software Details
🏛️ Research Organizations (ROR)
Affiliated research institutions:
📋 Methods
Affinity reagents
The following antibodies (Abs) were used in the experiments of this study: anti‐CD9 (BioLegend, Cat# 312102; San Diego, CA, USA), anti‐CD63 (Novus Biologicals, Cat# NBP2‐42225; Centennial, CO, USA), anti‐CD81 (BioLegend, Cat# 349502), anti‐IGF1R (ganitumab, a kind gift from Dr. J.C. Williams), anti‐cytochrome C (BD Biosciences, Cat# 556432; Franklin Lakes, NJ, USA), anti‐syntenin (Abcam, Cat# ab19903; Waltham, MA, USA) and anti‐ApoA1 (Abcam, Cat# ab52945) Abs, as well as goat anti‐rabbit (anti‐rabbit IgG; Invitrogen, Cat# A16112; Waltham, MA, USA), IRDye 800CW goat anti‐mouse (Li‐Cor Biotechnology, Cat# 926–32210; Lincoln, NE, USA) and IRDye 680RD goat anti‐rabbit (Li‐Cor Biotechnology, Cat# 926–68071) secondary Abs. For ExoView experiments, fluorescently labelled anti‐CD9‐CF488A, anti‐CD63‐CF647 and anti‐CD81‐CF555 Abs from the manufacturer's kit were used (details below). Human lactadherin (MFG‐E8), aa Leu24‐Cys387 (contains both C1 and C2 domains) was purchased from Novus Biologicals (Cat# 2767‐MF‐050).
Antibody conjugation with fluorophore
Anti‐CD9, anti‐CD63 and anti‐CD81 Abs were conjugated with Alexa Fluor 647 N‐hydroxysuccinimide (NHS) ester dye (AF647; Invitrogen, Cat# A20006) using previously reported protocol (Tobin et al., 2018 ). The degree of labelling was assessed by spectrophotometry using a NanoDrop 1000 instrument (Thermo Fisher Scientific). Typical degree of labelling was 1.0–1.5.
Human plasma samples and patient cohort
Two types of human plasma samples were used in this study. The pooled human plasma was used as healthy control. Pooled human plasma (blood derived) was obtained from Innovative Research (Cat# IPLAWBK2E50ML, LOT# 34553; Novi, MI, USA). According to the protocol of Innovative Research, whole blood was collected from donors in an FDA‐approved collection centre by the manufacturer. The blood was collected in K2 ethylenediaminetetraacetic acid (EDTA) containing dry blood collection bag, and it was span at 5000 × g for 15 min in a refrigerated centrifuge. Plasma was isolated with a plasma extractor, frozen and shipped on dry ice. Upon receipt, the plasma was stored at ‐80°C. The plasma from four PDAC patients (P1‐P4) included in this study was collected under the Institutional Review Board (IRB) number 06129 (City of Hope Comprehensive Cancer Center) after informed consent was obtained from each subject. Blood from PDAC patients was collected in EDTA‐containing lavender top blood collection tubes and was kept on ice until processed (typically within 1 h or less). The blood was transferred into a 15‐mL conical tube and centrifuged at 1200 × g for 15 min at room temperature (RT). The plasma fraction was carefully transferred to a 15‐mL conical tube and aliquoted into cryovials. The vials were immediately frozen and stored at −80°C. The experimental team involved in this study was blinded to patient characteristics and was unblinded after all data collection and analysis were completed.
Show full methods section
Affinity reagents
The following antibodies (Abs) were used in the experiments of this study: anti‐CD9 (BioLegend, Cat# 312102; San Diego, CA, USA), anti‐CD63 (Novus Biologicals, Cat# NBP2‐42225; Centennial, CO, USA), anti‐CD81 (BioLegend, Cat# 349502), anti‐IGF1R (ganitumab, a kind gift from Dr. J.C. Williams), anti‐cytochrome C (BD Biosciences, Cat# 556432; Franklin Lakes, NJ, USA), anti‐syntenin (Abcam, Cat# ab19903; Waltham, MA, USA) and anti‐ApoA1 (Abcam, Cat# ab52945) Abs, as well as goat anti‐rabbit (anti‐rabbit IgG; Invitrogen, Cat# A16112; Waltham, MA, USA), IRDye 800CW goat anti‐mouse (Li‐Cor Biotechnology, Cat# 926–32210; Lincoln, NE, USA) and IRDye 680RD goat anti‐rabbit (Li‐Cor Biotechnology, Cat# 926–68071) secondary Abs. For ExoView experiments, fluorescently labelled anti‐CD9‐CF488A, anti‐CD63‐CF647 and anti‐CD81‐CF555 Abs from the manufacturer's kit were used (details below). Human lactadherin (MFG‐E8), aa Leu24‐Cys387 (contains both C1 and C2 domains) was purchased from Novus Biologicals (Cat# 2767‐MF‐050).
Antibody conjugation with fluorophore
Anti‐CD9, anti‐CD63 and anti‐CD81 Abs were conjugated with Alexa Fluor 647 N‐hydroxysuccinimide (NHS) ester dye (AF647; Invitrogen, Cat# A20006) using previously reported protocol (Tobin et al., 2018 ). The degree of labelling was assessed by spectrophotometry using a NanoDrop 1000 instrument (Thermo Fisher Scientific). Typical degree of labelling was 1.0–1.5.
Human plasma samples and patient cohort
Two types of human plasma samples were used in this study. The pooled human plasma was used as healthy control. Pooled human plasma (blood derived) was obtained from Innovative Research (Cat# IPLAWBK2E50ML, LOT# 34553; Novi, MI, USA). According to the protocol of Innovative Research, whole blood was collected from donors in an FDA‐approved collection centre by the manufacturer. The blood was collected in K2 ethylenediaminetetraacetic acid (EDTA) containing dry blood collection bag, and it was span at 5000 × g for 15 min in a refrigerated centrifuge. Plasma was isolated with a plasma extractor, frozen and shipped on dry ice. Upon receipt, the plasma was stored at ‐80°C. The plasma from four PDAC patients (P1‐P4) included in this study was collected under the Institutional Review Board (IRB) number 06129 (City of Hope Comprehensive Cancer Center) after informed consent was obtained from each subject. Blood from PDAC patients was collected in EDTA‐containing lavender top blood collection tubes and was kept on ice until processed (typically within 1 h or less). The blood was transferred into a 15‐mL conical tube and centrifuged at 1200 × g for 15 min at room temperature (RT). The plasma fraction was carefully transferred to a 15‐mL conical tube and aliquoted into cryovials. The vials were immediately frozen and stored at −80°C. The experimental team involved in this study was blinded to patient characteristics and was unblinded after all data collection and analysis were completed.
Size exclusion chromatography
(SEC) enrichment of EVs from plasma EVs from pooled human plasma or PDAC patient plasma were enriched using Izon qEVoriginal Legacy 70 nm size exclusion chromatography (SEC) columns (Izon Science, Cat# SP1; Portland, OR, USA). Following column equilibration with phosphate‐buffered saline (PBS), 400 μL of plasma sample was loaded onto the column and 13 × 500 μL fractions (F) were collected (F1‐F13) following the collection of the 3 mL void volume (VV). For further experiments, combined fractions F1‐F5 were used. Negative staining transmission electron microscopy (TEM) A 4 μL of undiluted EV sample (SEC‐enriched EVs from human pooled plasma and PDAC patient plasma) or 1:2 diluted recombinant EV reference material, rEVs (Millipore Sigma, Cat# SAE0193‐1VL; Burlington, MA, USA) (Geeurickx et al., 2019 ) was adsorbed onto glow discharged, carbon‐coated 200 mesh electron microscopy grids for 5 min. The grids were then sequentially washed in deionized (DI) water three times for 30 s and were contrasted with 1% (w/v) uranyl acetate solution three times for 10 s.
Transmission electron microscopy
(TEM) images were acquired on an FEI Tecnai 12 transmission electron microscope (Thermo Fisher Scientific) at an acceleration voltage of 120 kV using LaB 6 filament. The images were captured with a Gatan 2 k × 2 k CCD camera (Gatan; Pleasanton, CA, USA). The 4 × 4 μm 8‐bit TEM images were converted into 16‐bit images in ImageJ (National Institutes of Health, version 1.53t) and analysed using the TEM ExosomeAnalyzer software (version Aug 13, 2018) (Kotrbová et al., 2019 ), where individual EVs were outlined using the manual editing tool. The diameter and roundness of detected EVs were determined by the automatic analysis module, and EVs within the size range of 30–400 nm were considered. Samples from three independent repeats were analysed (in total 928 EVs were detected). Nanoparticle tracking analysis (NTA) The EV concentration and size distribution of rEVs and SEC‐enriched pooled human plasma samples were determined by nanoparticle tracking analysis (NTA) using an NS300 Nanosight instrument (Malvern Panalytical; Malvern, UK). The samples were injected into the sample chamber with a sterile syringe until the liquid reached the tip of the nozzle. All measurements were performed at RT. The samples for SEC‐enriched pooled human plasma EVs were diluted 1:10 in 1 mL PBS, the samples for rEVs were diluted 1:200 in 1 mL PBS. Using default settings, three measurements were completed, each including a 60‐s movie captured at 30 frames per second with manual shutter and gain adjustments. For statistical analysis of the NTA‐determined size in Figure 1 , only rEVs detected in the 30–400 nm size range were considered. FIGURE 1 Validation of EV size and shape measurements using SEVEN. (a) Scheme of an affinity isolated and fluorescently labelled EV. Anti‐TSPAN Abs (mixture of unlabelled anti‐CD9, anti‐CD63 and anti‐CD81 Abs) were covalently immobilized on the polymer‐coated glass coverslip surface. After affinity capture, EVs were stained using a mixture of fluorescently labelled anti‐TSPAN Abs. (b) Raw SMLM image of TSPAN‐enriched EVs in red. (c) TSPAN‐enriched EVs are imaged in SMLM (red, signal from fluorescent anti‐TSPAN Abs) and TIRF (green, signal from GFP). (d) Tessellation polygons (blue lines) are outlining SMLM localization (red dots); EV is outlined in white dashed line using the Voronoi tessellation algorithm described in Methods . (e) TEM image of EVs. (f) Number of detected EVs per ROI for spot coated with either a mixture of anti‐TSPAN Abs or anti‐rabbit IgG control. (g) EV diameter detected with SMLM imaging and tessellation analysis (SMLM T ); SMLM imaging and EVSCAN analysis (SMLM E ); TEM and segmentation analysis; and NTA. (h) EV circularity detected with SMLM T , SMLM E and TEM. Box plots indicate interquartile range (box), median (centre line), mean (cross); the hollow dots (for TEM and SMLM) indicate EVs detected beyond 1.5‐times the interquartile range (marked by the Whisker lines under and over the box). Error bars, SEM; *** indicates p < 0.001. Numerical values and p ‐values are provided in Tables S1 and S2 . Microfluidic resistive pulse sensing (MRPS) Microfluidic resistive pulse sensing (MRPS) measurements were performed using a Spectradyne nCS1 with hardware version 2.5.0.325 (Spectradyne; Signal Hill CA, USA). The microfluidic system was primed with a solution of 0.1% (v/v) Tween‐20 in PBS (PBS‐T 0.1%). Instrument parameters were automatically determined by the device, including pressure at each cartridge port and voltage at each bias electrode. We filtered our diluent with syringe filters of 0.02 μm (Whatman® Anotop® 10) to avoid false‐positive counts. Particle size distributions were determined using TS‐400 cartridges (65 to 400 nm). Samples were diluted 1:100 in PBS‐T 0.1%. For each measurement, 7 μL of diluted sample was applied to the cartridge. All experiments consisted of continuous acquisitions until the standard error reached
📊 Figures
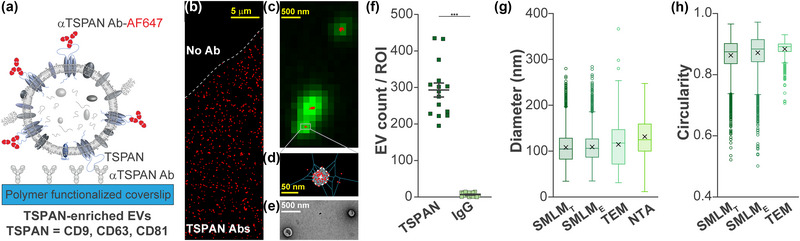
FIGURE 1
Validation of EV size and shape measurements using SEVEN. (a) Scheme of an affinity isolated and fluorescently labelled EV. Antiu2010TSPAN Abs (mixture of unlabelled antiu2010CD9, antiu2010CD63 and an...
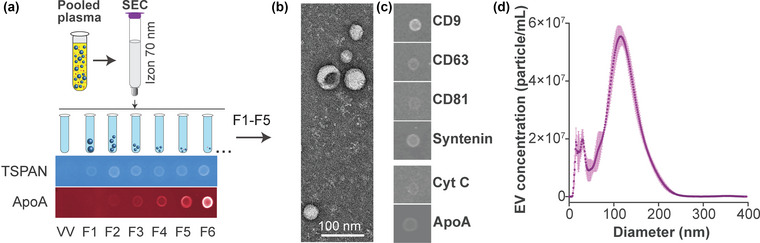
FIGURE 2
Overview of the isolation and characterization of EVs from pooled human plasma. (a) EVs from the pooled human plasma were enriched using Izon Legacy 70u00a0nm SEC columns; collected fractions were ass...
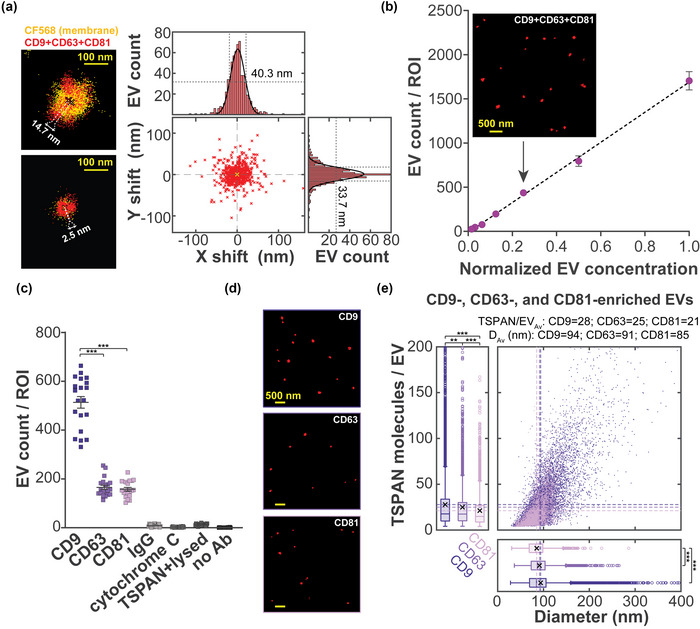
FIGURE 3
SEVEN for characterization of SECu2010enriched EVs from pooled human plasma. (a) Left, Tetraspaninu2010enriched EVs were detected using CF568u2010maleimide (labels available cysteine residues on the m...
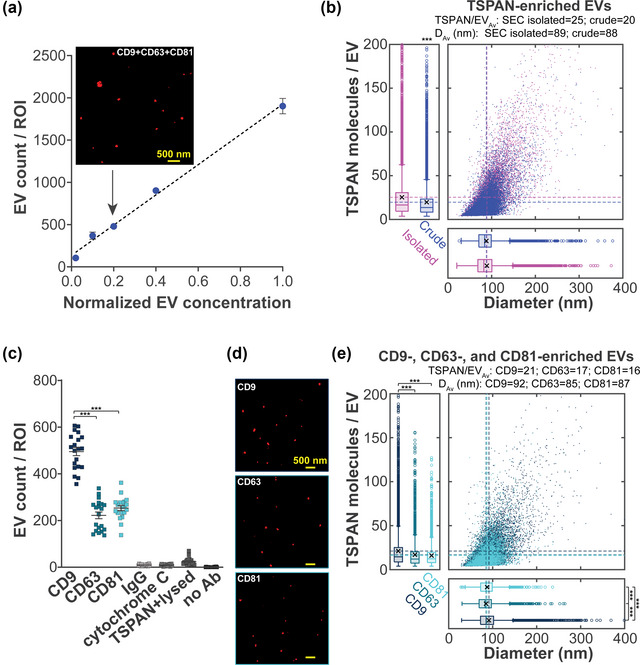
FIGURE 4
SEVEN for characterization of EVs from crude pooled human plasma. (a) Number of detected TSPANu2010enriched EVs per ROI. The xu2010axis represents EV concentrations normalized to the highest applied E...
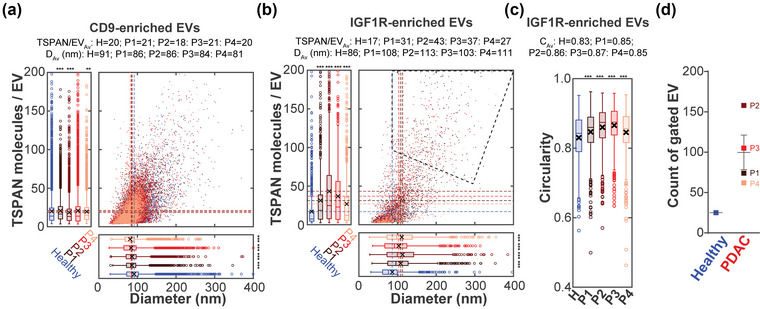
FIGURE 5
SEVEN for characterization of EVs from PDAC patient plasma. 2D histograms and corresponding box plots for CD9u2010enriched EVs (a) and IGF1Ru2010enriched EVs (b) isolated from healthy control plasma (...
Figure images are served from the NIH/NLM PubMed Central Open Access Subset or Europe PMC; copyright remains with the publishers and authors.
💬 Discussion
0 commentsNo comments yet. Be the first to start a discussion!
Leave a Comment