Abstract
Several approaches have been described to fluorescently label and image DNA and chromatin in situ on the single-molecule level. These superresolution microscopy techniques are based on detecting optically isolated, fluorescently tagged anti-histone antibodies, fluorescently labeled DNA precursor analogs, or fluorescent dyes bound to DNA. Presently they suffer from various drawbacks such as low labeling efficiency or interference with DNA structure. In this report, we demonstrate that DNA minor groove binding dyes, such as Hoechst 33258, Hoechst 33342, and DAPI, can be effectively employed in single molecule localization microscopy (SMLM) with high optical and structural resolution. Upon illumination with low intensity 405 nm light, a small subpopulation of these molecules stochastically undergoes photoconversion from the original blue-emitting form to a green-emitting form. Using a 491 nm laser excitation, fluorescence of these green-emitting, optically isolated molecules was registered until "bleached". This procedure facilitated substantially the optical isolation and localization of large numbers of individual dye molecules bound to DNA in situ, in nuclei of fixed mammalian cells, or in mitotic chromosomes, and enabled the reconstruction of high-quality DNA density maps. We anticipate that this approach will provide new insights into DNA replication, DNA repair, gene transcription, and other nuclear processes.
🔬 Techniques
💻 Software
✨ Fluorophores
🧪 Sample Preparation
🔬 Cell Lines
🏭 Microscope Brands
🧪 Reagent Suppliers
📷 Detectors
💻 Software Details
🏛️ Research Organizations (ROR)
Affiliated research institutions:
📋 Methods
Cell culture and sample preparation
HeLa cervical cancer cells were grown on 0.17 mm thick coverslips in 6-well plates filled with Dulbecco's Modified Eagles Medium supplemented with 10% (v/v) fetal bovine serum in 37 °C and high humidity. After 15 min fixation with 4% formaldehyde and following permeabilization using 0.5% Triton X-100, the cells were washed with phosphate buffered saline (PBS) and treated for 1 h with a 0.5 ml solution of aqueous RNase A (0.2 mg/ml, 37 °C). Afterwards, the DNA was stained for 30 min with 1 ml aqueous solution of either Hoechst 33258 (0.2 µg/ml), Hoechst 33342 (0.1 µg/ml), or DAPI (4’,6-diamidino-2-phenylindole, 0.2 µM), added directly to the 6-well plate. Such low concentrations should not provide unforeseen effects on the binding mode. 40 Subsequently, cells were washed with PBS, then embedded in a solution consisting of glycerol with 10% imaging buffer (stock comprising 0.25 mg/ml Glucose oxidase, 0.02 mg/ml Catalase, 0.05 g/ml glucose in PBS), and immediately sealed with nailpolish. Measurements were performed instantly. For chromosome spreads we performed mitotic block on HeLa cells using vinblastine (126 µM for 4 h) followed by washing with medium. Afterwards the medium with mitotic cells was collected to 14 cm 3 flask and centrifuged (150 g, 5 min). Subsequently, the cell pellet was resuspended in 5 ml 75 mM KCl water solution for 10 min. Next, we added 5 ml fixative (3: 1 glacial acetic acid: methanol). After centrifugation (150 g, 5 min) cells were resuspended in ice cold fixative. This step was repeated at least 4 times. A cell suspension with 6 ng/ml Hoechst 33258 was dropped on a coverslip in horizontal position and air-dried until the fixative evaporated. Further sample preparation proceeded as mentioned above. All reagents were obtained from Sigma-Aldrich, Germany.
Show full methods section
Cell culture and sample preparation
HeLa cervical cancer cells were grown on 0.17 mm thick coverslips in 6-well plates filled with Dulbecco's Modified Eagles Medium supplemented with 10% (v/v) fetal bovine serum in 37 °C and high humidity. After 15 min fixation with 4% formaldehyde and following permeabilization using 0.5% Triton X-100, the cells were washed with phosphate buffered saline (PBS) and treated for 1 h with a 0.5 ml solution of aqueous RNase A (0.2 mg/ml, 37 °C). Afterwards, the DNA was stained for 30 min with 1 ml aqueous solution of either Hoechst 33258 (0.2 µg/ml), Hoechst 33342 (0.1 µg/ml), or DAPI (4’,6-diamidino-2-phenylindole, 0.2 µM), added directly to the 6-well plate. Such low concentrations should not provide unforeseen effects on the binding mode. 40 Subsequently, cells were washed with PBS, then embedded in a solution consisting of glycerol with 10% imaging buffer (stock comprising 0.25 mg/ml Glucose oxidase, 0.02 mg/ml Catalase, 0.05 g/ml glucose in PBS), and immediately sealed with nailpolish. Measurements were performed instantly. For chromosome spreads we performed mitotic block on HeLa cells using vinblastine (126 µM for 4 h) followed by washing with medium. Afterwards the medium with mitotic cells was collected to 14 cm 3 flask and centrifuged (150 g, 5 min). Subsequently, the cell pellet was resuspended in 5 ml 75 mM KCl water solution for 10 min. Next, we added 5 ml fixative (3: 1 glacial acetic acid: methanol). After centrifugation (150 g, 5 min) cells were resuspended in ice cold fixative. This step was repeated at least 4 times. A cell suspension with 6 ng/ml Hoechst 33258 was dropped on a coverslip in horizontal position and air-dried until the fixative evaporated. Further sample preparation proceeded as mentioned above. All reagents were obtained from Sigma-Aldrich, Germany.
SPDM setup and measurements
The basic principle of the SMLM technique used here has been described in detail. 12 , 13 Under appropriate physicochemical conditions, the fluorophores are driven into a long-lived 'reversibly bleached'/'dark' state by high intensity illumination, followed by their stochastic recovery to the fluorescent state (SPDM with physically modified fluorophores, in the following abbreviated as SPDM). Single fluorophores returning to the fluorescent state remain fluorescing only for a short period of time until they bleach permanently or return to a reversible “dark state” again. This process of switching between different absorption/emission states has been termed 'blinking' and allows for the optical isolation and localization of single molecules with super-resolution precision (raw images available in Fig. S2 ). The calculated localization accuracy 20 (σ) is dependent on the number of detected photons ( N ), background noise per pixel ( b ), width of the point spread function ( s ), and pixel size ( a ) in the image plane and detection efficiency: σ 2 = s 2 + a 2 12 N + 8 π s 4 b 2 a 2 N 2 The structural resolution in localization microscopy ( R ) depends on the mean localization precision of individual molecules (< σ >) and the mean distance of detected molecules, d (reflecting a quality of sampling the structure of interest): R = ( 2.35 < σ > ) 2 + ( 2 d ) 2 The SPDM method as described by Lemmer et al. 2008 12 did not utilize a secondary light source for conversion or activation of fluorophores and relied solely on suitable embedding media and adjusted laser parameters (wavelength and intensity) of a single laser light source. Using suitably high illumination intensities combined with a high number of registered frames, the use of the 491 nm excitation laser alone was in principle sufficient to obtain SPDM images of the green-emitting photoproducts. For the dyes presented in this report, however, it was advantageous to also use a low intensity illumination at 405 nm in addition to high intensity illumination at 491 nm; this allowed us to increase the number of signals detected by continuously recruiting green-emitting photoproduct molecules during the measurement. Similar enhancements have been obtained in other cases also by dSTORM. 15 For measurements, we used the custom built SMI-Vertico microscope. 13 Both spectrally distinct forms of Hoechst dyes and DAPI were illuminated with 0.002 kW/cm 2 by a 405 nm diode laser (Kvant Ltd) and with 1.5 kW/cm 2 by a 491 nm DPSS laser (Cobolt AB, Sweden). The fluorescence was detected using a 1.4 NA oil immersion objective (HCX PL APO, 63×, Leica Microsystems GmbH) and a high quantum efficiency CCD camera (SensiCam QE, PCO Imaging). To achieve the high laser intensity necessary for the localization mode, an additional achromatic lens (f = 500mm, Chroma GmbH) was used to focus the beam. The emitted fluorescence was registered after passing through the band-pass emission filters 470(40) (Thorlabs GmbH) and 630(90) (Semrock) for the 405 nm laser and 491 nm laser, respectively. The detailed optical setup is shown in Figure S6 . During the experiments, raw image data stacks typically consisting of 20 000 images were recorded with an integration time of 65 ms. In these image stacks, the total number of separate fluorescent bursts identified per optical section of about 500 nm thickness through a cell nucleus ranged from about 400 000 to 2 000 000, depending on the cell line used. To detect and localize these single bursts, we used two different algorithms written in MATLAB (The Mathworks Inc). For the images of the interphase cell nuclei we used the fastSPDM software as described by Grüll et al. 41 which is based on a center of gravity (CG) determination of the single molecule data. The software is particularly focused on high processing speed by efficient programming and possible application of field programmable gate arrays (FPGA). 41 Single molecule fluorescence bursts that were localized in several subsequent frames within the radius given by the localization accuracy were rejected by the software with only one position counted in order to avoid multiple localizations of the same fluorophore. However, a single fluorophore may emit fluorescence bursts again at later times during the measurement. Due to the stochastic nature of the fluorescent bursts, present algorithms are very limited in rejecting such temporally distant events of the same molecule; so far this constitutes an unresolved problem in the SMLM imaging method. For the chromosome images we applied an adjusted algorithm, which uses a more complex method for the background estimation as well as a more realistic noise model and is therefore computationally more intense. Also, a more robust detection routine for closely spaced signals was included in the alternative algorithm. The localization of single events was based on CG determination of the signal weighed according to the maximum likelihood principle. A more detailed description of the algorithm is beyond the scope of this paper and shall be discussed in a subsequent publication. The raw images of the chromosomes contained, due to their condensed nature, higher local densities of blinking signals and also a strongly fluctuating background signal. The more robust alternative detection algorithm was found to be better suited for the chromosome images than fastSPDM, whereas both methods delivered very similar results for the interphase nucleus images. For reconstruction of the latter we have therefore used the previously published fastSPDM algorithm. The long acquisition times resulted in considerable mechanical drift of the stage. We corrected the lateral drift taking advantage of the underlying structure visible in a raw image sequence (averaged over 10 subsequent frames for one sample image) and calculating the auto-correlation between sample images and fitting two (for x and y) eighth order Fourier series to the acquired data to obtain the drift vectors. Density maps of the DNA distribution in chromosomes were obtained using a triangulation procedure. Such an approach of visualization involves iterative, multiplied reconstruction of SMLM images and was described before. 42 Figure 3 was reconstructed using 100 iterations.
Supplementary Material Additional material
📊 Figures
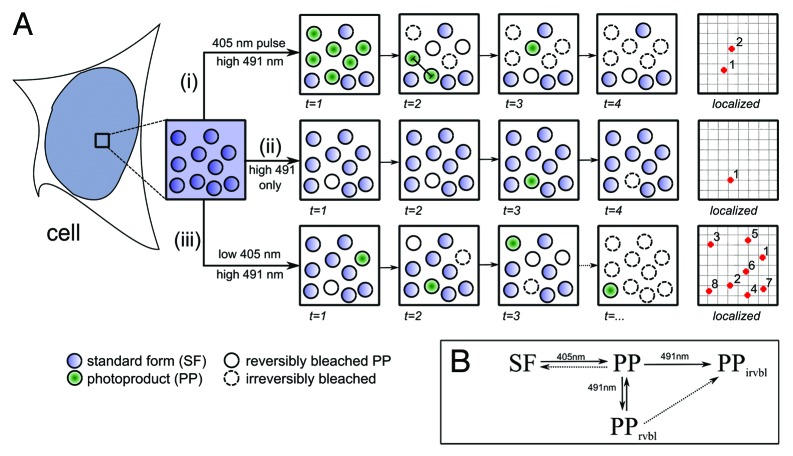
Figure 1
Figureu00a01. A putative scheme suggesting a photophysical mechanism for single molecule localization microscopy of photoconverted DNA minor groove binders, proposed on the basis of our experimental o...
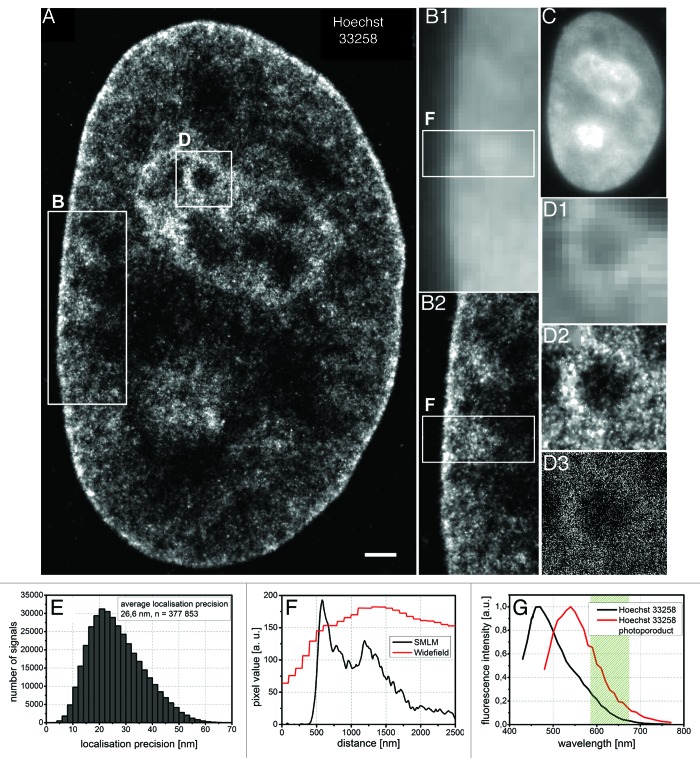
Figure 2
Figureu00a02. Structure of HeLa cell nucleus imaged by means of single molecule localization microscopy of the Hoechst 33258 photoproduct. Image acquired with high intensity laser excitation 491 nm co...
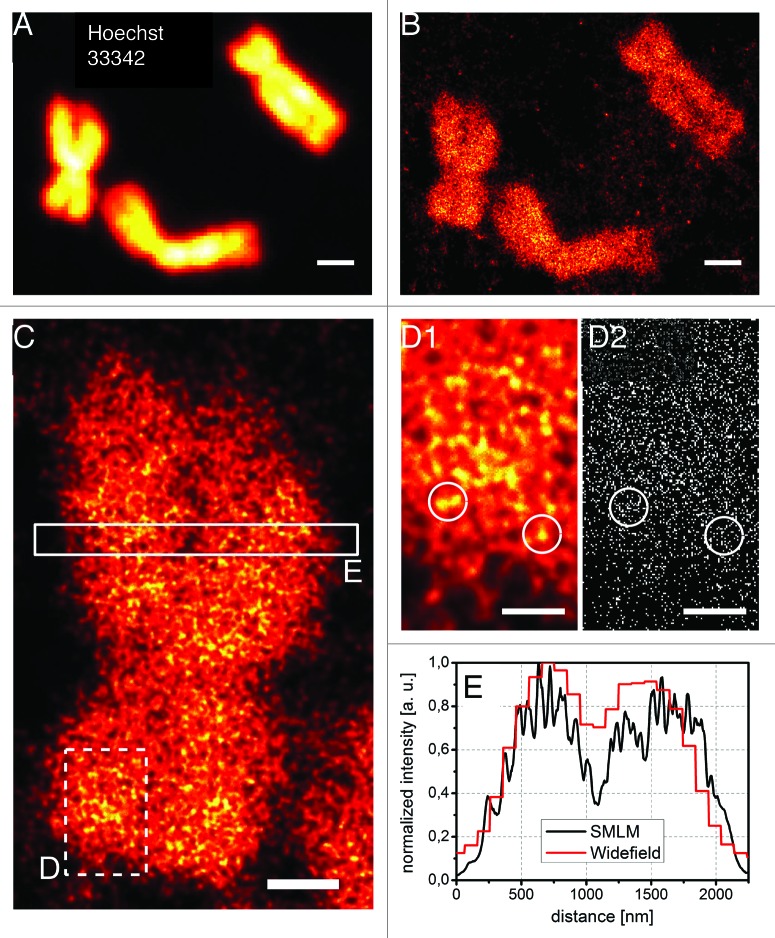
Figure 3
Figureu00a03. Single molecule localization microscopy of mitotic chromosomes stained with Hoechst 33342. Comparison of ( A ) the widefield image (raw data, collected in 450u2012490 nm range) and ( B )...
Figure images are served from the NIH/NLM PubMed Central Open Access Subset or Europe PMC; copyright remains with the publishers and authors.
💬 Discussion
0 commentsNo comments yet. Be the first to start a discussion!
Leave a Comment