Abstract
AbstractThe morphology of podocyte foot processes is obligatory for renal function. Here we describe a method for the superresolution-visualization of podocyte foot processes using structured illumination microscopy of the slit diaphragm, which before has only been achieved by electron microscopy. As a proof of principle, we measured a mean foot process width of 0.249 ± 0.068 µm in healthy kidneys and a significant higher mean foot process width of 0.675 ± 0.256 µm in minimal change disease patients indicating effacement of foot processes. We then hypothesized that the slit length per glomerular capillary surface area (slit diaphragm density) could be used as an equivalent for the diagnosis of effacement. Using custom-made software we measured a mean value of 3.10 ± 0.27 µm−1 in healthy subjects and 1.83 ± 0.49 µm−1 in the minimal change disease patients. As foot process width was highly correlated with slit diaphragm density (R2 = 0.91), we concluded that our approach is a valid method for the diagnosis of foot process effacement. In summary, we present a new technique to quantify podocyte damage, which combines superresolution microscopy with automatized image processing. Due to its diverse advantages, we propose this technique to be included into routine diagnostics of glomerular histopathology.
🔬 Techniques
🔭 Microscopes
💻 Software
✨ Fluorophores
🧪 Sample Preparation
🔬 Cell Lines
🏭 Microscope Brands
🧪 Reagent Suppliers
💻 Software Details
🏛️ Research Organizations (ROR)
Affiliated research institutions:
📋 Methods
Histologic staining
Anonymized formalin-fixed and paraffin-embedded human kidney biopsies that were diagnosed for MCD by experienced pathologists of the Institute of Pathology of the University Medicine Greifswald or University Erlangen-Nürnberg were used for this study. As healthy controls, anonymized excess kidney tissue of partial nephrectomies of the Department of Urology of the University Medicine Greifswald was used. The use of the biopsies from Erlangen has been approved by the Ethics Committee of the Friedrich Alexander University of Erlangen-Nürnberg, waiving the need for retrospective consent for the use of archived excess material (Ref. No. 4415). All subjects stated written informed consent. The local ethics committee of the University Medicine Greifswald approved the use of the biopsies from Greifswald. All experiments were performed in accordance with local guidelines overseen by the Universitätsmedizin Greifswald, Ernst-Moritz-Arndt Universität Greifswald, Greifswald, Mecklenburg - Western Pomerania. After deparaffinization in xylene and an ascending ethanol series, antigen retrieval was performed in citrate buffer by 5 minutes boiling in a pressure cooker. The slides were washed in PBS and blocked for 1 hour with 2% FBS, 2% BSA and 0.2% fish gelatin in PBS. The primary antibody (1:75 in blocking solution, polyclonal guinea pig anti-nephrin IgG, PG-N2, Progen, Heidelberg, Germany) was incubated on the slides for 4 hours at 4 °C. After three times washing in PBS the secondary antibody (Cy3 conjugated goat anti-guinea pig, Jackson Immunoresearch, West Grove, PA, USA) was incubated for 1 hour at 4 °C followed by incubation in DAPI (1:100) and threefold washing in PBS. The slides were mounted in Mowiol for Microscopy (Carl Roth, Karlsruhe, Germany). For PAS staining, a standard protocol was used which can be found in the Supplemental Information.
Show full methods section
Histologic staining
Anonymized formalin-fixed and paraffin-embedded human kidney biopsies that were diagnosed for MCD by experienced pathologists of the Institute of Pathology of the University Medicine Greifswald or University Erlangen-Nürnberg were used for this study. As healthy controls, anonymized excess kidney tissue of partial nephrectomies of the Department of Urology of the University Medicine Greifswald was used. The use of the biopsies from Erlangen has been approved by the Ethics Committee of the Friedrich Alexander University of Erlangen-Nürnberg, waiving the need for retrospective consent for the use of archived excess material (Ref. No. 4415). All subjects stated written informed consent. The local ethics committee of the University Medicine Greifswald approved the use of the biopsies from Greifswald. All experiments were performed in accordance with local guidelines overseen by the Universitätsmedizin Greifswald, Ernst-Moritz-Arndt Universität Greifswald, Greifswald, Mecklenburg - Western Pomerania. After deparaffinization in xylene and an ascending ethanol series, antigen retrieval was performed in citrate buffer by 5 minutes boiling in a pressure cooker. The slides were washed in PBS and blocked for 1 hour with 2% FBS, 2% BSA and 0.2% fish gelatin in PBS. The primary antibody (1:75 in blocking solution, polyclonal guinea pig anti-nephrin IgG, PG-N2, Progen, Heidelberg, Germany) was incubated on the slides for 4 hours at 4 °C. After three times washing in PBS the secondary antibody (Cy3 conjugated goat anti-guinea pig, Jackson Immunoresearch, West Grove, PA, USA) was incubated for 1 hour at 4 °C followed by incubation in DAPI (1:100) and threefold washing in PBS. The slides were mounted in Mowiol for Microscopy (Carl Roth, Karlsruhe, Germany). For PAS staining, a standard protocol was used which can be found in the Supplemental Information.
Microscopy
Micrographs of PAS-stained sections were taken with an Olympus BX50 microscope equipped with an Olympus UC30 camera. 10x (NA 0.25) and 40x (NA 0.6) objectives were used. For confocal laser scanning microscopy a Leica TCS SP5 (Leica Microsystems, Wetzlar, Germany) equipped with a 63x (NA 1.4) oil immersion objective was used. Single micrographs of each glomerulus were acquired with 0.240 µm/pixel and subsequently, plan view areas of the glomerular capillary surface, which were positive for nephrin, were imaged with 0.080 µm/pixel. For SIM a Zeiss Elyra SP.1 system (Zeiss Microscopy, Jena, Germany) equipped with a 63x (NA 1.4) oil immersion objective was used. Z-Stacks with a size of 2,430 × 2,430 pixels 2 (78.35 × 78.35 µm 2 ) with a slice-to-slice distance of 0.3 µm were acquired over approximately 4 µm using the 561 nm laser, with 2.4% laser power and an exposure time of 100 ms. The 34 µm period grating was shifted 5 times and rotated 3 times on every frame. The 3D SIM reconstruction was performed with the Zeiss ZEN Software using following parameters: Baseline Cut, SR Frequency Weighting: 1.3; Noise Filter: −5.6; Sectioning: 96, 84, 83. Parts of the renal biopsies were fixed in 2.5% glutaraldehyde and embedded in Glycidether 100 (formerly called Epon 812). Ultrathin sections of 70–90 nm were cut with a Leica ultratome equipped with a diamond knife, stained with uranyl acetate and lead citrate. The pictures were examined with a Libra 120 electron microscope from Carl Zeiss (Zeiss Microscopy, Jena, Germany). For deconvolution analysis of the wide field image stacks, ZEN 2.3 blue edition (Zeiss Microscopy, Jena, Germany) image processing software was used.
Evaluation of d
FP and automatized l SD /A measurement The d FP in single frames of 3D-SIM stacks was measured in a standardized way with FIJI: The peak-to-peak distance of two neighboring SDs was measured on the half length of a single FP from its origin from the major process to its tip. The mean d FP per glomerulus was evaluated for 20 FP for each glomerulus, with 8–12 included glomeruli per patient leading to ~200 measurements per patient. For automatic assessment of the SD length, a customized macro was programmed for the ImageJ-based platform FIJI and the ImageJ plugin “Ridge Detection” 16 , 17 . The macro only requires manual selection of a capillary area with a plan view on the SD and FP. The source code can be found in the Supplemental Information and the authors can supply the ready-to-use FIJI macro upon request. The macro measures the total SD length (l SD ) and the capillary area (A) and saves the results to an Excel file together with a JPEG file of the result of the SD detection. To account for the SD density, l SD was divided by A. To check for statistical difference of the mean MCD versus control subjects (Tables 1 , 2 ) and of each MCD patient versus control, we applied a Mann-Whitney U test using SPSS (22.0 IBM SPSS Inc., Chicago, IL, USA) comparing the mean d FP and l SD /A of the measured glomeruli. To quantify the severity of the phenotype the results were expressed as “standard deviations below control”. Table 2 l SD /A of control subjects versus MCD patients. l SD /A (µm −1 ) Control MCD M 3.10 1.83 Median 3.09 1.77 StdDev 0.27 0.49 A total (µm 2 ) 16,955 26,475 n subjects 8 13 n glomeruli 72 128 p — 0.000166 StdDev below control — 4.76 Analogue to the 3D-SIM data, the d FP in TEM pictures was measured as the distance from SD to SD from both sides of the same FP using FIJI. The normally distributed d FP values of TEM (n = 124) and SIM pictures (n = 127) were compared using Student’s t test using Prism 5.01 (GraphPad, CA, USA). All graphs were set up using Prism 5.01 (GraphPad, CA, USA).
📊 Figures
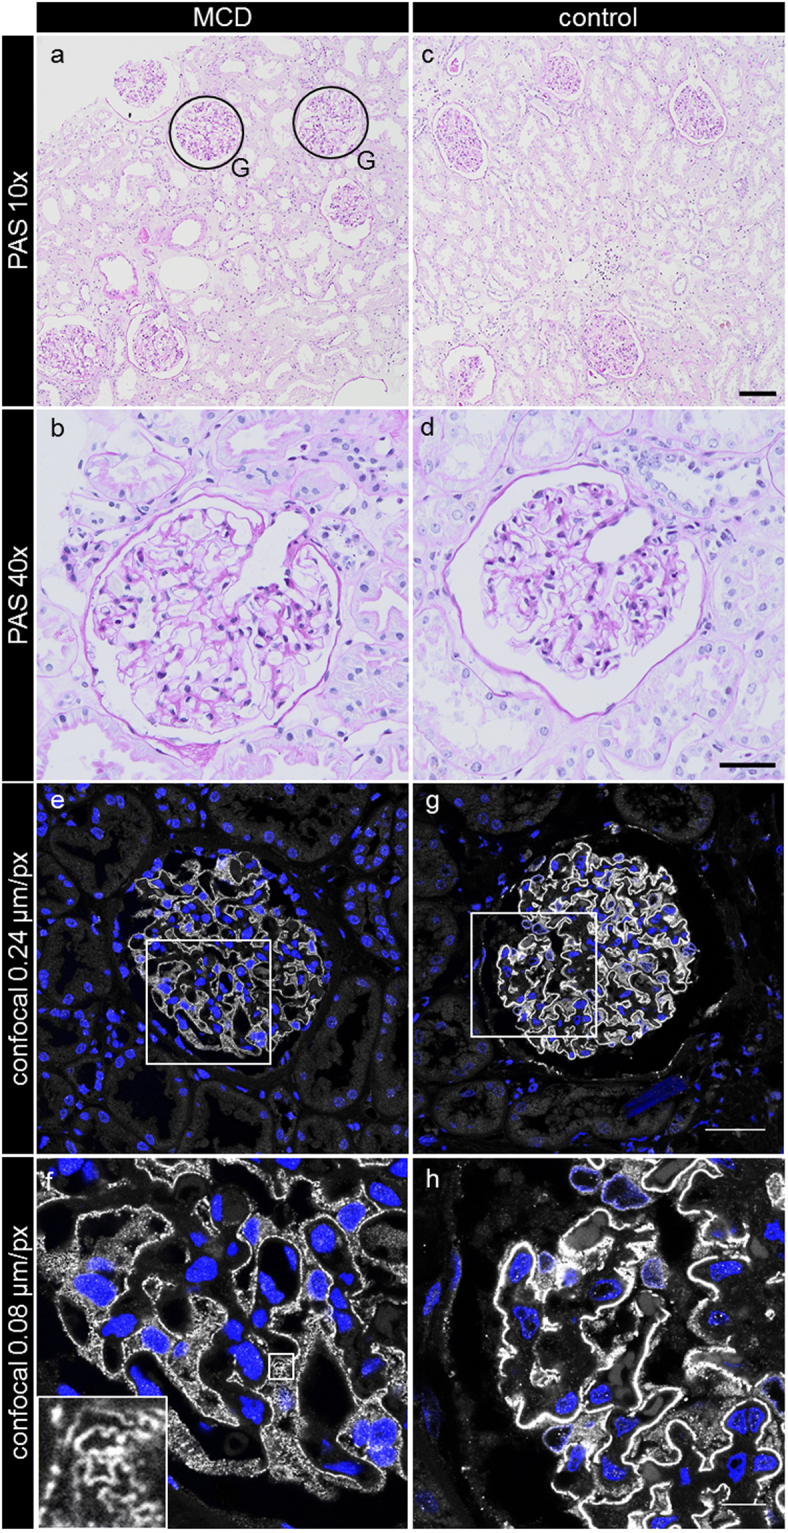
Figure 1
Histopathological features of the PAS-stained kidney sections originating either from MCD-diagnosed patients ( a , b ) or healthy control subjects ( c , d ). No major morphological differences between...
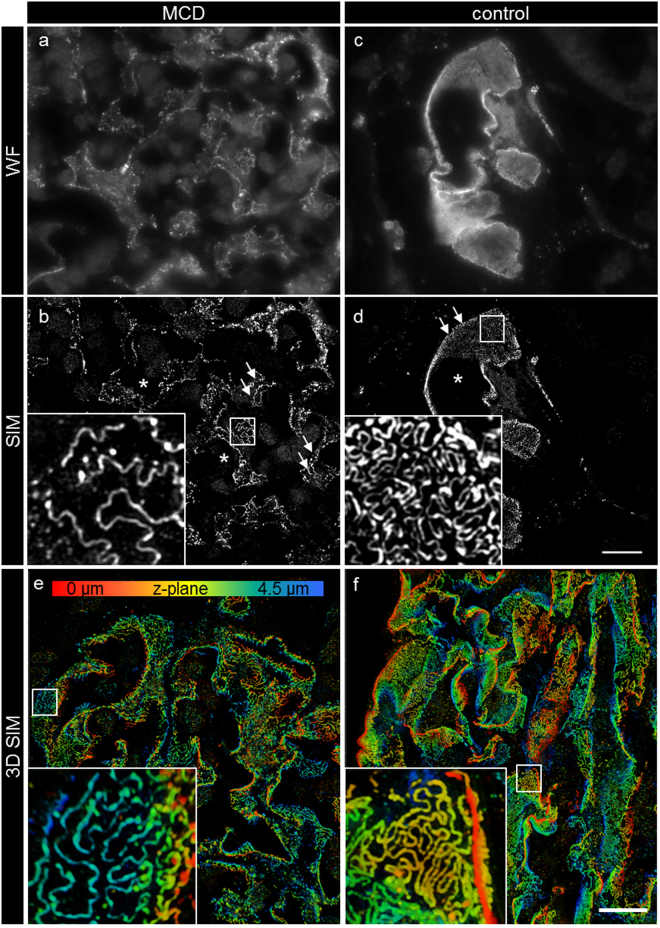
Figure 2
Micrographs of nephrin-stained glomeruli obtained by wide field microscopy and after SIM reconstruction. The micrographs in a and c show a single frame of the original fluorescence-wide field (WF) dat...
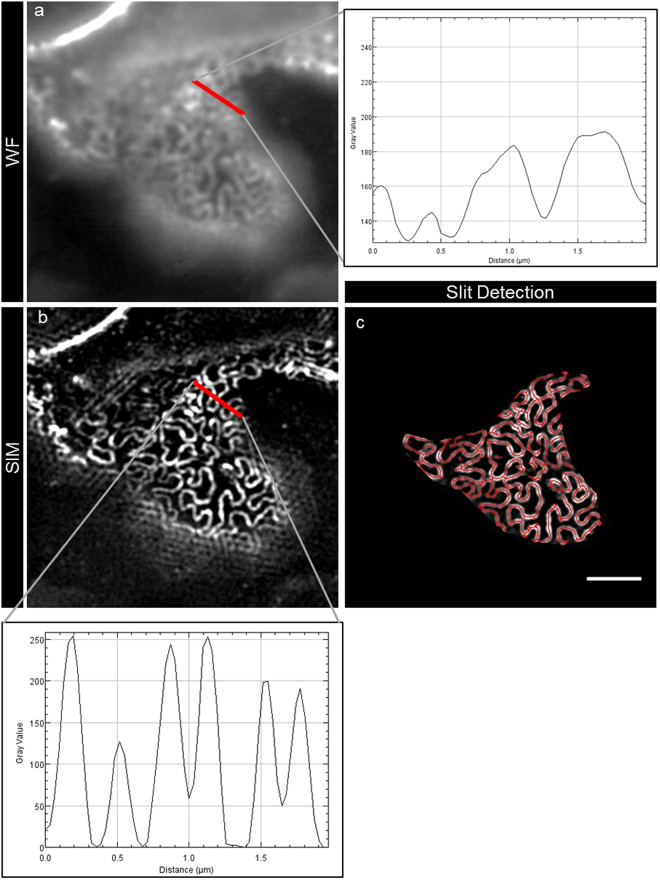
Figure 3
This figure exemplarily shows the process of automated SD detection. Panel ( a ) shows a segment of a fluorescence-wide field image, which was 3D-SIM-reconstructed ( b ). As shown in the graph in pane...
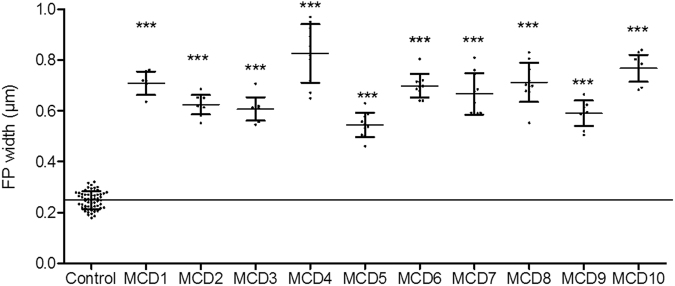
Figure 4
The graphs show the mean d FP (nu2009=u200910 patients), each compared to the control group (nu2009=u20098 subjects). Each patient showed a significant difference when being compared to the control gr...
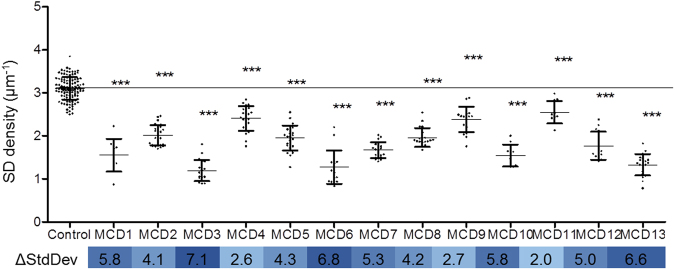
Figure 5
This graph shows the SD densities of the MCD patients (nu2009=u200913), each compared to the control group (nu2009=u20098). A statistically significant lower value was found for every single patient. ...
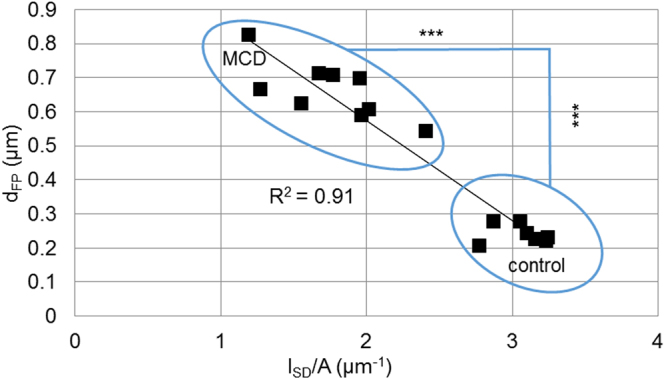
Figure 6
Mean values of d FP and l SD /A, which were measured in biopsies of either MCD or control subjects, are plotted against each other for each individual. Both values show a linear relationship with an R...
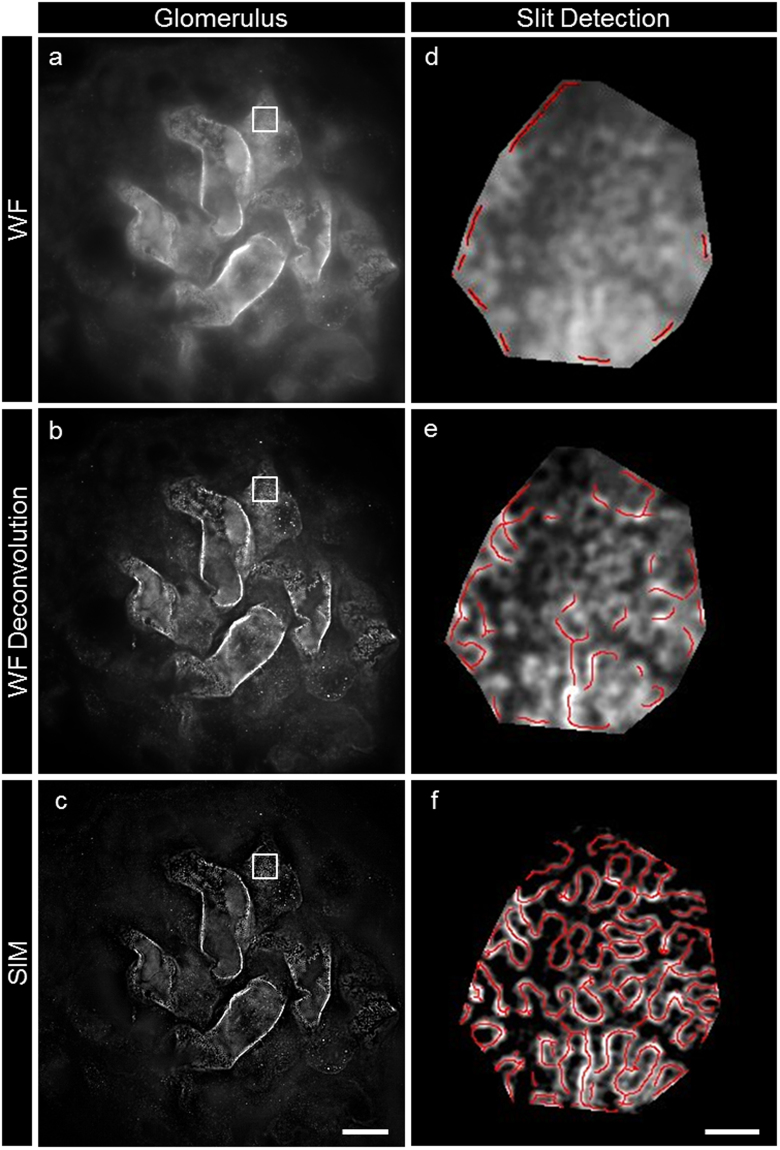
Figure 7
Picture ( a ) shows a view of the surface of glomerular capillaries labeled with nephrin in a single frame of a wide field microscopy z-stack. The image stack was processed by deconvolution enhancing ...
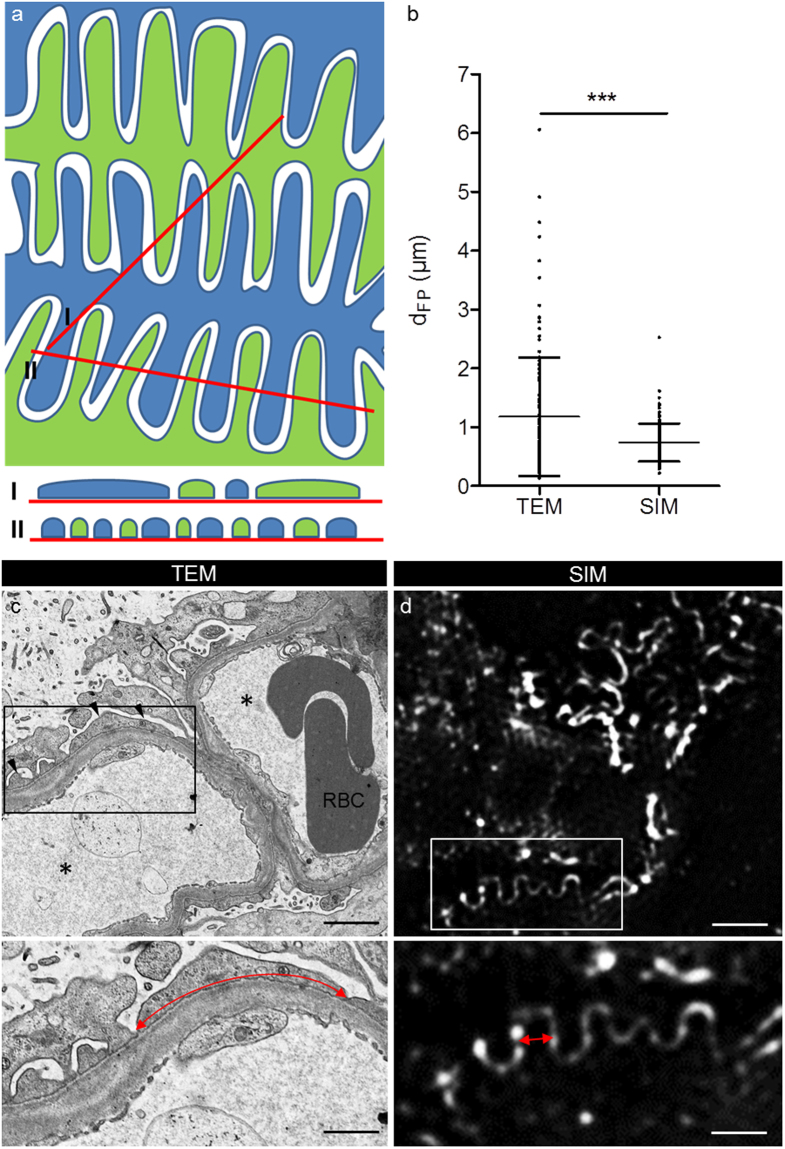
Figure 8
The scheme in ( a ) exemplarily shows the geometric bias of TEM measurement. In TEM, measurement of d FP will lead to false high values (I) compared to when foot processes are measured in an exactly o...
Figure images are served from the NIH/NLM PubMed Central Open Access Subset or Europe PMC; copyright remains with the publishers and authors.
💬 Discussion
0 commentsNo comments yet. Be the first to start a discussion!
Leave a Comment