Abstract
The main function of T cells is to identify harmful antigens as quickly and precisely as possible. Super-resolution microscopy data have indicated that global clustering of T cell antigen receptors (TCRs) occurs before T cell activation. Such pre-activation clustering has been interpreted as representing a potential regulatory mechanism that fine tunes the T cell response. We found here that apparent TCR nanoclustering could be attributed to overcounting artifacts inherent to single-molecule-localization microscopy. Using complementary super-resolution approaches and statistical image analysis, we found no indication of global nanoclustering of TCRs on antigen-experienced CD4+ T cells under non-activating conditions. We also used extensive simulations of super-resolution images to provide quantitative limits for the degree of randomness of the TCR distribution. Together our results suggest that the distribution of TCRs on the plasma membrane is optimized for fast recognition of antigen in the first phase of T cell activation.
🔬 Techniques
🔭 Microscopes
💻 Software
✨ Fluorophores
🧪 Sample Preparation
🔬 Cell Lines
🏭 Microscope Brands
🧪 Reagent Suppliers
🔴 Lasers
📷 Detectors
🔎 Objectives
🎨 Filters
💻 Software Details
🏛️ Research Organizations (ROR)
Affiliated research institutions:
📋 Methods
Cell culture, DNA constructs, Antibodies and Reagents All chemicals and cell culture supplies were from Sigma if not otherwise noted. Primary murine T cells were cultured in RPMI 1640 medium supplemented with 10% fetal bovine serum (FBS), 2 mM L-glutamine, 1 kU/ml penicillin-streptomycin, 50 μM β-mercaptoethanol and 1 mM sodium pyruvate. The phoenix packaging cell line for retroviral infections was cultured in DMEM medium supplemented with 10 % FBS, 2 mM L-glutamine, 1 kU/ml penicillin-streptomycin. All cells were grown in a humidified atmosphere at 37 °C and 5% CO 2 . For expression of the CD3ζ-PS-CFP2 fusion protein, we cloned the sequence of murine CD3ζ in frame with PS-CFP2 into the retroviral expression vector pIB2. Alexa Fluor 647 (AF647)-conjugated TCRβ-specific antibody (clone H57-597); average degree of labeling of 7.4) was purchased from Biolegend (CatNo. 109218; LotNo. B206104). CD3ε-specific antibody (clone KT3) was from AbD Serotec/Bio-Rad Technologies (CatNo. MA1-80783; LotNo. 1603) and was conjugated to AF647 via NHS-ester chemistry following the supplier’s instructions. After removal of unreacted dye using Zeba desalting columns (Thermo Fisher Scientific) an average degree of labeling of 3.8 was determined. T cell isolation and transduction Primary T cells were isolated and treated as described elsewhere 42 . Briefly, splenic T cells were isolated from 5c.c7 αβTCR transgenic mice and cultured in vitro in the presence of 1 μM moth cytochrome c (MCC) peptide (aa 88-103: ANERADL IAYLKQATK , T-cell epitope underlined, Elim Biopharmaceuticals) and IL-2 (added after 24 h) for 7-9 days. For retroviral transduction, we essentially followed protocols from the Nolan lab (Stanford University). Phoenix packaging cells were co-transfected with pIB2-CD3ζ-PS-CFP2 and pCL-eco using TurboFect (Invitrogen Life Technologies) on day 1 after T cell isolation, followed by two days of virus production. On day 3 after isolation, T cell blasts were infected by spin-infection in the presence of 10 μg/ml polybrene and 50 U/ml IL-2. Selection for positive cells was achieved by addition of 10 μg/ml blasticidin on day 4 after isolation. On day 6 after isolation dead cells were removed by a density-dependent centrifugation gradient using histopaque 1119. All experiments were conducted on days 7 – 9 after isolation.
Show full methods section
Cell culture, DNA constructs, Antibodies and Reagents All chemicals and cell culture supplies were from Sigma if not otherwise noted. Primary murine T cells were cultured in RPMI 1640 medium supplemented with 10% fetal bovine serum (FBS), 2 mM L-glutamine, 1 kU/ml penicillin-streptomycin, 50 μM β-mercaptoethanol and 1 mM sodium pyruvate. The phoenix packaging cell line for retroviral infections was cultured in DMEM medium supplemented with 10 % FBS, 2 mM L-glutamine, 1 kU/ml penicillin-streptomycin. All cells were grown in a humidified atmosphere at 37 °C and 5% CO 2 . For expression of the CD3ζ-PS-CFP2 fusion protein, we cloned the sequence of murine CD3ζ in frame with PS-CFP2 into the retroviral expression vector pIB2. Alexa Fluor 647 (AF647)-conjugated TCRβ-specific antibody (clone H57-597); average degree of labeling of 7.4) was purchased from Biolegend (CatNo. 109218; LotNo. B206104). CD3ε-specific antibody (clone KT3) was from AbD Serotec/Bio-Rad Technologies (CatNo. MA1-80783; LotNo. 1603) and was conjugated to AF647 via NHS-ester chemistry following the supplier’s instructions. After removal of unreacted dye using Zeba desalting columns (Thermo Fisher Scientific) an average degree of labeling of 3.8 was determined. T cell isolation and transduction Primary T cells were isolated and treated as described elsewhere 42 . Briefly, splenic T cells were isolated from 5c.c7 αβTCR transgenic mice and cultured in vitro in the presence of 1 μM moth cytochrome c (MCC) peptide (aa 88-103: ANERADL IAYLKQATK , T-cell epitope underlined, Elim Biopharmaceuticals) and IL-2 (added after 24 h) for 7-9 days. For retroviral transduction, we essentially followed protocols from the Nolan lab (Stanford University). Phoenix packaging cells were co-transfected with pIB2-CD3ζ-PS-CFP2 and pCL-eco using TurboFect (Invitrogen Life Technologies) on day 1 after T cell isolation, followed by two days of virus production. On day 3 after isolation, T cell blasts were infected by spin-infection in the presence of 10 μg/ml polybrene and 50 U/ml IL-2. Selection for positive cells was achieved by addition of 10 μg/ml blasticidin on day 4 after isolation. On day 6 after isolation dead cells were removed by a density-dependent centrifugation gradient using histopaque 1119. All experiments were conducted on days 7 – 9 after isolation.
Ethical compliance statement
All animal experimentation (related to breeding, sacrifice for T cell isolation) was evaluated by the ethics committee of the Medical University of Vienna and approved by the Federal Ministry of Science, Research and Economy, BMWFW (BMWFW-66.009/0378-WF/V/3b/2016). Animal husbandry and experimentation was performed under the national laws (Federal Ministry of Science, Research and Economy, Vienna, Austria) and ethics committee of the Medical University of Vienna and according to the guidelines of the Federation of Laboratory Animal 671 Science Associations (FELASA). Protein expression and functionalization IE k -MCC was prepared as described previously 21 . For the generation of single-chain variable fragment (scFv) of TCRβ specific antibody (H57-scFv), mRNA was prepared from H57-597 or KT3 hybridoma (American Type Culture Collection) to serve as a template for 5′ rapid amplification of cDNA ends (RACE; Invitrogen). V H and V L antibody domains were fused as described in detail in Huppa et al 21 and mutagenized for site-specific modification using the Quikchange protocol (Stratagene). After refolding from inclusion bodies 43 , scFv preparations were purified from aggregates on a S-200 size-exclusion column (GE Healthcare), site-specifically labeled for 2 h with AF647- or AS635P-maleimide in the presence of 50 μM tris(2-carboxyethyl) phosphine hydrochloride (TCEP; Pierce) and monomeric scFv–dye conjugates were again purified by size-exclusion chromatography (S-75; GE Healthcare). The label:protein stoichiometry was determined to be close to 1 in all cases.
Preparation of glass-supported lipid bilayers
All lipids were from Avanti Polar Lipids. Preparation of vesicles composed of 90% 1-palmitoyl-2-oleoyl-sn-glycero-3-phosphocholine (POPC) and 10% 1,2-dioleoyl- sn -glycero-3-[(N-(5-amino-1-carboxypentyl)iminodiacetic acid)succinyl] (nickel salt) (18:1 DGS-NTA(Ni)) was done as described previously 21 . Glass cover slides (#1.5, 24x60 mm, Menzel) were plasma cleaned for at least ten minutes and attached to 8-well LabTek chambers (Nunc), where the bottom had been removed. Glass slides were incubated for 10 min at room temperature with the vesicle suspension, followed by extensive rinsing with PBS. Supported lipid bilayers were functionalized with His 10 -ICAM-1 (Sinobiologicals) only or additionally with His 12 -pMHC and His 10 -B7-1 (Sinobiologicals) for 75 min, followed by extensive rinsing with PBS. Before addition of T cells, PBS was replaced with imaging buffer (HBSS + 2% FBS) by sequential dilution.
TCR labeling and sample preparation
All labeling steps were done on ice. Roughly 10 6 cells were washed in imaging buffer. For dSTORM experiments, we used full antibodies bearing multiple fluorophores. This is necessary, since due to high illumination powers used in dSTORM, not all fluorophores return to the active state within the imaging period. Multiple fluorophores per label increase the chance to detect most labels present in the sample. In a first step, unspecific binding sites were blocked with 5% BSA for 25 min, and then the cells were incubated with varying antibody concentrations (H57: 0.05, 1, 5 and 10 μg/ml; KT3: 0.02, 0.2, 2, 10 and 20 μg/ml) for 20 minutes. For experiments under non-activating conditions using KT3-AF647, blocking and antibody labeling was done after cell adhesion to the supported lipid bilayers and fixation, as labeling prior to cell seeding and adhesion induced Ca 2+ influx. PALM and STED experiments were carried out with stoichiometrically labeled scFv, which replicates previously used labeling strategies. Labeling was done for 15 min. For ζ-PS-CFP2 PALM experiments, live T cells were labeled with 50 μg/ml H57-scFv-AF647 to follow microcluster formation before imaging PS-CFP2. For STED experiments we employed saturating concentrations of fluorescent scFv (5 μg/ml H57-scFv-AS635P or 50 μg/ml KT3-scFv-AS635P) or a mixture of fluorescent/non-fluorescent scFv to achieve labeling at single-molecule density (1:10 molar ratio). After labeling, in all cases cells were washed twice with imaging buffer on ice before addition to the sample chambers. Cells were allowed to settle for 15 min under non-activating and 5 min under activating conditions. Cells were then fixed with 4% paraformaldehyde (PFA; Polysciences)/0.2% glutaraldehyde (GA) for 10 min at room temperature. For experiments under non-activating conditions using KT3-AF647, cells were extensively washed after labeling and again fixed for 10 min at room temperature to avoid detachment of the antibodies. Live cell PALM experiments were started 5 min after cell seeding without further preparations. Single-molecule localization microscopy and tracking A Zeiss Axiovert 200 microscope equipped with a 100x Plan-Apochromat (NA=1.46) objective (Zeiss) was used for imaging samples in objective-based total internal reflection (TIR) configuration. The setup was further equipped with a 640 nm diode laser (iBeam smart 640, Toptica), a 405 nm diode laser (iBeam smart 405, Toptica) and a 488 nm optically pumped semiconductor laser (Sapphire, Coherent). Acousto-optic modulators (AOM) were used to modulate intensity and timings using an in-house developed Labview software. For STORM experiments, we used a zt488/640rpc dichroic mirror (Chroma) and an FF01-538/685-25 emission filter (Semrock). For PALM experiments, instead of the emission filter we used a dual view system (Photometrix) with a 640dcxr dichroic mirror and emission filters FF01-525/45 and HQ 700/75m (Chroma). All data was recorded on a back-illuminated EM-CCD camera (Andor iXon DU897). For SMLM images of fixed cells, 7,500 – 10,000 frames were acquired at 100 – 167 Hz, with illumination times of 2 - 3 ms. In live cell PALM experiments, 4,000 frames were recorded at 167 Hz (24 s total recording time). Imaging at 488 nm or 640 nm was done with 1.5 - 3 kW/cm 2 and photoactivation was achieved with continuous 20 - 30 W/cm 2 405 nm light. Importantly, the imaging parameters and sequence length were not changed within one set of experiments. dSTORM blinking buffer consisted of PBS (pH 7.4), 10% glucose, 500 μg/ml glucose oxidase, 40 μg/ml catalase and 50 mM cysteamine 27 . PALM imaging was performed in imaging buffer. Since the reliable detection of clusters requires immobilization of clusters during the acquisition time, we determined the residual mobility of antibody-labeled TCR upon fixation. We found only marginal fluctuations below the achieved localization errors. We performed single-molecule tracking experiments on chemically fixed cells labeled with low concentrations of H57-scFv-AS635P. Image stacks were acquired at an illumination time of t ill = 10 ms and t delay = 490 ms. Signal positions were determined as for SMLM. Tracking was then performed on the data using an in-house adaptation of the algorithm described in 44 . Mean square displacement analysis was performed as described in 45 and fitted with the equation MSD = 4 Dt lag + offset , where D specifies the lateral diffusion coefficient, t lag the analyzed time-lag, and offset the localization errors.
Quantitative analysis of single label blinking
To statistically quantify the blinking of single labels (H57-AF647, KT3-AF647 and CD3ζ-PS-CFP2), we analyzed cells recorded at low antibody concentrations or low expression levels of CD3ζ-PS-CFP2. All localizations appearing within a radius of 1 pixel were considered to be derived from one label molecule. We determined the first frame of appearance, the total number of detections per label (N), the time a label is detectable in consecutive frames (t on ) and the time a label is not detectable (t off ) ( Supplementary Fig. 3a ).
STED microscopy
STED measurements were done in ROXS buffer consisting of 2 mM Trolox, 1 mM methylviologen-dichloride hydrate, 50 μM glucose oxidase, 300 U/ml catalase and 5 %wt glucose 46 . STED images were recorded on a custom-built microscope system, equipped with a 635 nm pulsed diode laser (LHD-D-C-635, PicoQuant) with < 100 ps pulse width. A Ti:Al 2 O 3 laser (Mira900, Coherent) was tuned to 800 nm for stimulated emission depletion. The excitation and STED beam were fed into the objective (HC PL APO 100x/1.4 oil CS2, Leica) and emission was collected by the same objective. A dichroic mirror (zt 625-745 rpc, Chroma) was used to uncouple the emission light, which was then split into four identical channels by 50:50 beam splitters, filtered by band pass filters (685/70 ET, Chroma), coupled into multimode fibers and detected by avalanche photodiodes (SPCMAQR-13-FC, Perkin Elmer Optoelectronics). An additional short pass filter (ET750sp-sp, Chroma) was used to block the STED light. A 3-axis piezo stage (Tritor 102 Cap, Piezosystem Jena) was used to raster scan the T cell membrane. Signals were acquired with a time-correlated single-photon counting board in absolute timing mode (DPC-230, Becker & Hickl GmbH). Time gating was set to 0.8 to 7 ns in respect to the excitation pulse.
Imaging for single-molecules as well as for fully labeled
T cells was done with 50 fJ excitation and 1.6 nJ STED pulse energy at the back aperture of the objective and a pixel dwell time of 100 μs at a pixel size of 20 nm yielding a scanning time of 60-160 ms per line. To ensure that the chosen scanning speed was sufficiently fast to avoid diffusional spreading of the signals, we determined by single-molecule tracking the residual mobility of scFv-labeled TCR in fixed cells, yielding D = 1.6 x 10 -5 ± 4 x 10 -7 μm 2 /s. Together with the σ-width of about 40 nm for single-molecule signals ( Supplementary Fig. 7 ), we estimate that the TCR diffuses 4-6 nm during the recording of a single-molecule signal, which is much smaller than the obtained resolution. Calcium imaging and analysis Roughly 10 6 cells were washed in imaging buffer and incubated with 5 μg/ml Fura-2-AM (Molecular Probes) for 20 min at room temperature. After washing, antibody or scFv labeling was done as for superresolution experiments. Fura-2-AM was excited using a monochromatic light source (Polychrome V, TILL Photonics), coupled to a Zeiss Axiovert 200M equipped with a 20x objective (Olympus) and an Andor iXon Ultra. Imaging was performed at 340 nm and 380 nm at illumination times of 50 and 10 ms, respectively. The total recording time was at least 10 minutes at 1 Hz. ImageJ was used to generate the ratio images. Cells were segmented and tracked using a sum image of both channels using an in-house Matlab algorithm based on Gao Y. et al 44 . Cellular positions and tracks were stored and used for intensity extraction based on the ratio image. Intensity traces were normalized to the starting value at time point zero; the data are displayed as medians ± standard error of the median.
Label-density-variation analysis
Single-molecule signals were fitted with a Gaussian intensity distribution by maximum likelihood estimation using the ImageJ plug-in ThunderSTORM 47 and filtered for intensity, σ and positional accuracy of the fit. dSTORM data were merged with a radius of 35 nm and a maximum off-time of 50 frames 18 . PS-CFP2 data were merged with a maximum distance of 80 nm and a maximum off time of 1 frame. ρ/ρ 0 versus η plots were obtained as described in detail in Baumgart F. et al 18 . Briefly, we determined ρ 0 by fitting the data with a polynomial of the form ρ=ρ 0 (1 + α × η β ) with α=1.4 and β=4. In addition, to improve sensitivity random reference curves were generated for each probe corresponding to its specific blinking statistics: in each case, 50 titration curves were simulated with labeling efficiencies varied from 5% to 95% in 0.5% increments. For analysis of the simulations, the data points were pooled according to the simulated labeling efficiency into 20 equidistant bins (ranging from 0%-95%). From the mean values of these bins a reference line for randomly distributed data was generated. Confidence intervals (represented as SEM) of this simulated random curve were calculated reflecting the experimental situations shown in Fig. 2 , Fig. 3 , Supplementary Fig. 1, and Supplementary Fig. 4 . To approximate the mean number of data points (n) typically found per bin in experimental data, we divided the total number of experimental data points by the number of bins (20). Calculated values for n were: n=3.7 for H57-AF647; n=2.9 for KT3-AF647 and n=1.45 for PS-CFP2.
Simulations for label-density-variation analysis
To test the sensitivity of the label-density-variation method, we simulated different clustering scenarios and compared them with simulated random distributions using in house-written Matlab code. Molecular densities were adjusted to values extracted from experimental data by dividing the number of localizations in fully labeled T cells by the mean number of localizations per label in sparsely labeled T cells, or, in case of PS-CFP2, T cells expressing low levels of CD3ζ-PS-CFP2. We determined 59-81, 68-73 and 37-141 molecules/μm 2 for H57-AF647, KT3-AF647 and CD3ζ-PS-CFP2, respectively. Similar densities of H57-AF647 and KT3-AF647 labeling were a priori not expected, given the presence of two CD3ε subunits per TCRβ chain. We attribute this to incomplete labeling or steric hindrance of antibody binding in the case of KT3-AF647 ( Brameshuber et al., Nature Immunology, accepted ), and due to experimental differences in the staining and fixation procedures (see subsection “ TCR labeling and sample preparation ”). Simulations were done in four steps. All parameters, if not otherwise stated, were randomized following a Poisson distribution with the indicated mean values. First, we simulated the underlying protein distributions for regions of 10 x 10 μm, reflecting approximately the size of a typical cell. Clusters of proteins were placed randomly onto these regions, with adjustable number of clusters per μm 2 (mean = 0, 3, 5, 10, 15 and 20) and σ-width (mean = 20, 40, 60, 80, 100 and 150 nm). We generated a probability mask for the whole region, where each cluster is represented by a Gaussian profile symmetrically truncated at 1 σ. Hence, the σ-width can be interpreted as the cluster radius. To avoid high protein densities in overlapping clusters, the probability map was thresholded at 0.9. Clusters were randomly filled with molecules (mean = 73, 70 and 76 molecules/μm 2 for H57-AF647, KT3-AF647 and PS-CFP2, respectively), until the adjusted fraction of clustered molecules was reached (40, 60, 80, 100 %). The remaining molecules were distributed randomly in the areas outside of the clusters. A non-clustered scenario is naturally represented by the case of 0 clusters per μm 2 . Second, labels were assigned randomly to the molecules; increasing the labeling probability from 5% to 95% allowed for the simulation of titration curves. For each titration step we simulated a new underlying spatial distribution of molecules. Third, to simulate blinking, we assigned a number of detections to each label. This number was drawn from an empirical probability distribution recorded at low labeling concentrations in dSTORM experiments (H57-AF647 and KT3-AF647) or low expression levels of CD3ζ-PS-CFP2. Localization errors were simulated by spreading these detections using a Gaussian profile centered around the molecule position, with widths corresponding to the localization errors of the according experimental data calculated after single-molecule fitting 48 , 49 . Fourth, to account for experimental errors, we included unspecifically bound labels at a mean density of 5 labels/μm 2 . We finally considered also false positive localizations by adding a random background of single localizations at a mean density of 10 localizations/μm 2 . Both values are realistic for the experimental settings. 10 or 50 titration curves were simulated for clustering random or random scenarios, respectively. Curves were analyzed as described in subsection “ Label-density-variation analysis ”. For the analysis of KT3-AF647 data shown in Fig. 4b and Supplementary Fig. 6a we assumed a label stoichiometry of one antibody molecule per TCR complex. This assumption was corroborated by the experimental finding, that staining of CD3ε with full KT3 antibody after fixation yielded similar label densities as labeling of the monomeric β-chain with H57. Nevertheless, we also simulated scenarios assuming two KT3 antibody molecules per TCR complex, yielding essentially identical detection limits (data not shown). This was no surprise, as two antibodies per TCR complex would be mathematically equivalent to twice the amount of fluorophores per antibody; in our previous paper, we found no difference in the results, when performing the label-density-variation analysis of differently labeled antibodies 18 .
Ripley’s K function analysis
Image analysis via Ripley’s
K function was performed via in house-written Matlab code. As is common practice, we linearized the K-function and plotted L ( r ) − r = K ( r ) / π − r 25 .
STED autocorrelation analysis
To evaluate the degree of randomness in STED microscopy data, we calculated image autocorrelation functions for 5 different 2 x 2 μm regions of interest (ROIs) and averaged over all angles 20 . ROIs from experimental samples were compared to simulated random distributions with experimentally determined parameters: STED images of T cells labeled at single-molecule density were used to characterize the point spread function (psf) of the imaging system by fitting single-molecule signals using the ImageJ plug-in ThunderSTORM 47 . The background was determined from the mean fluorescence signal in non-cell regions next to the cells. TCR densities were estimated by dividing the background-corrected mean intensity in fully labeled cells by the average single-molecule intensity, yielding 40 - 150 molecules/μm 2 in the case of H57-scFv-AS635P and 75 – 120 molecules/μm 2 in the case of KT3-scFv-AS635P. Simulated images of random signal distributions were generated using the parameters derived from single-molecule signals, i.e. intensity ( I ), width (σ), background, and density. A log-normal distribution 50 was fitted to the intensity histogram ( Supplementary Fig 7a ). The dependence of σ on the intensity was fitted by the empirical function (Eq. 1) σ ( I ) = a ( 1 − exp ( − I / b ) ) ( Supplementary Fig. 7b ). This dependence likely arose from bleaching of single molecules during the scanning process. To simulate single molecules, I was drawn from a log-normal distribution. For each molecule, σ(I) was calculated using Eq. 1 , which was taken as the mean value of a normal distribution with constant standard deviation 6.24. A total of fluorescent counts ( I ) were then assigned for each molecule to 20 nm pixels using a Gaussian distribution with a radius σ. Finally, we included varying sources of noise in the simulations: (i) Line-scanning errors during the STED image acquisition were simulated by shifting each line horizontally for a randomized value of either -1, 0 or 1 pixels. These values were determined empirically from the STED images. (ii) A Poisson-distributed background was simulated with a mean intensity of 0.86, corresponding to the mean value determined in the experiments.
Simulations for STED autocorrelation analysis
To evaluate the sensitivity of the STED autocorrelation analysis, we compared simulated STED images of clustered and randomly distributed molecules using in house-written Matlab code. Molecular densities were matched to experimentally obtained values from T cells labeled with scFv-KT3-AS635P. We simulated underlying protein distributions in 2 x 2 μm ROIs as stated in the subsection “ Simulations for label-density-variation analysis ” and used these molecule positions to generate a STED image as described in “ STED autocorrelation analysis ”. For each scenario, we simulated five images and analyzed them as described in subsection “ STED autocorrelation analysis ”.
Supplementary Material 1 2
📊 Figures
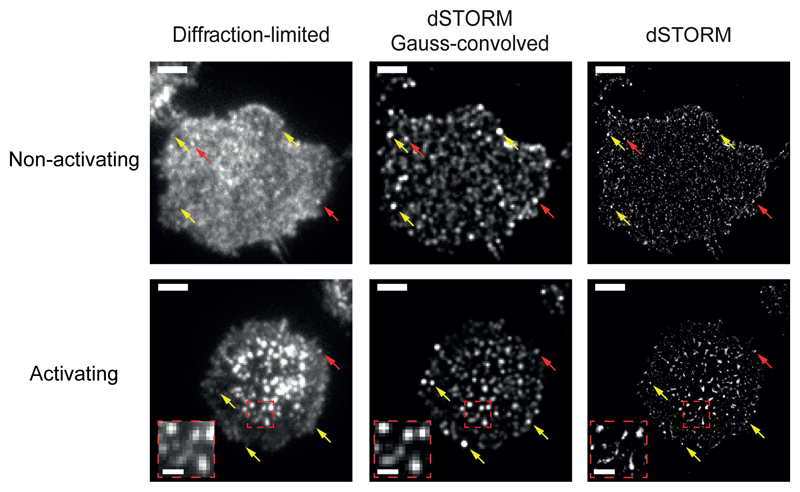
Figure 1
Blinking and multiple observations lead to over-representation of single molecules in SMLM images.
Diffraction-limited images (left), dSTORM localization maps (right), and back-calculated diffraction-limited images based on dSTORM localization maps (center) of fixed primary murine CD4 + T EFF cells...
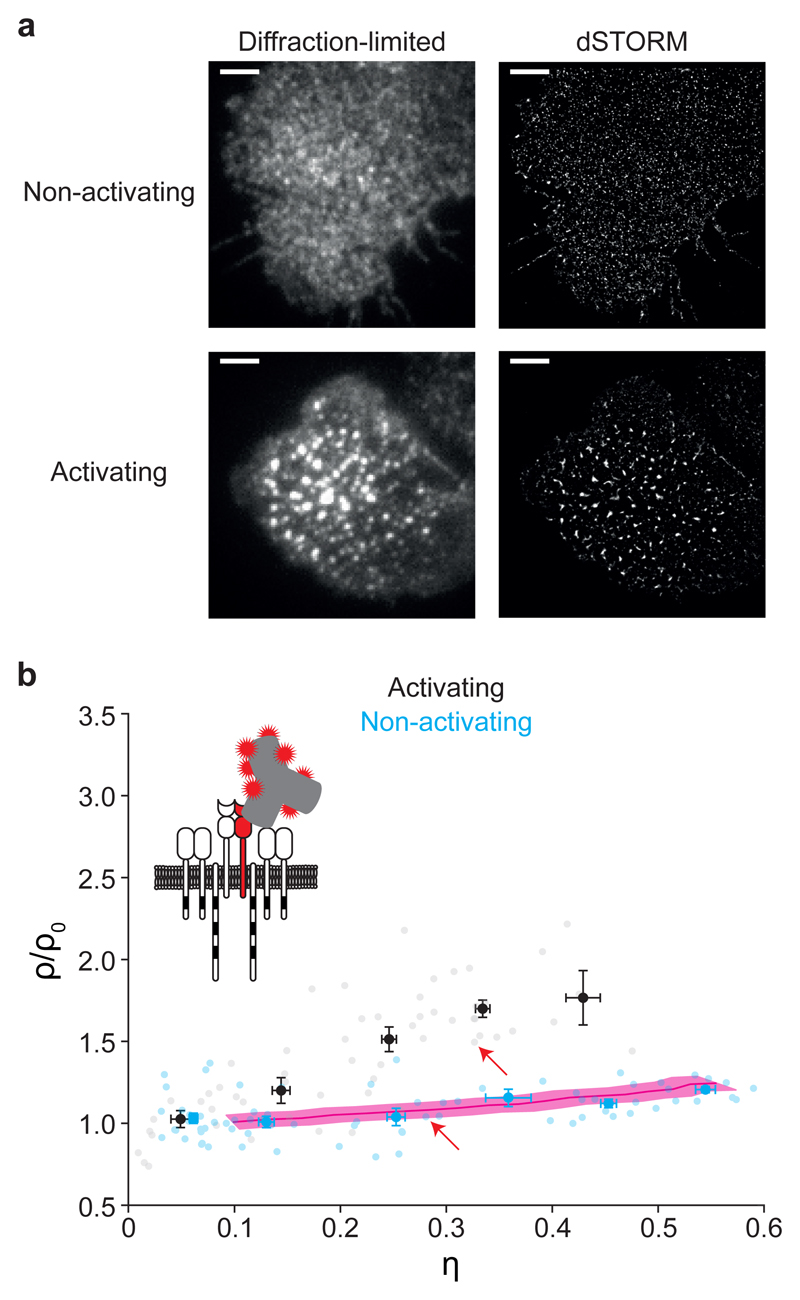
Figure 2
Label-density-variation dSTORM of TCRu03b2.
( a ) Representative diffraction-limited microscopy images ( left ) and dSTORM localization maps ( right ) of fixed primary murine CD4 + T EFF cells labeled with H57-AF647 during interaction with non-...
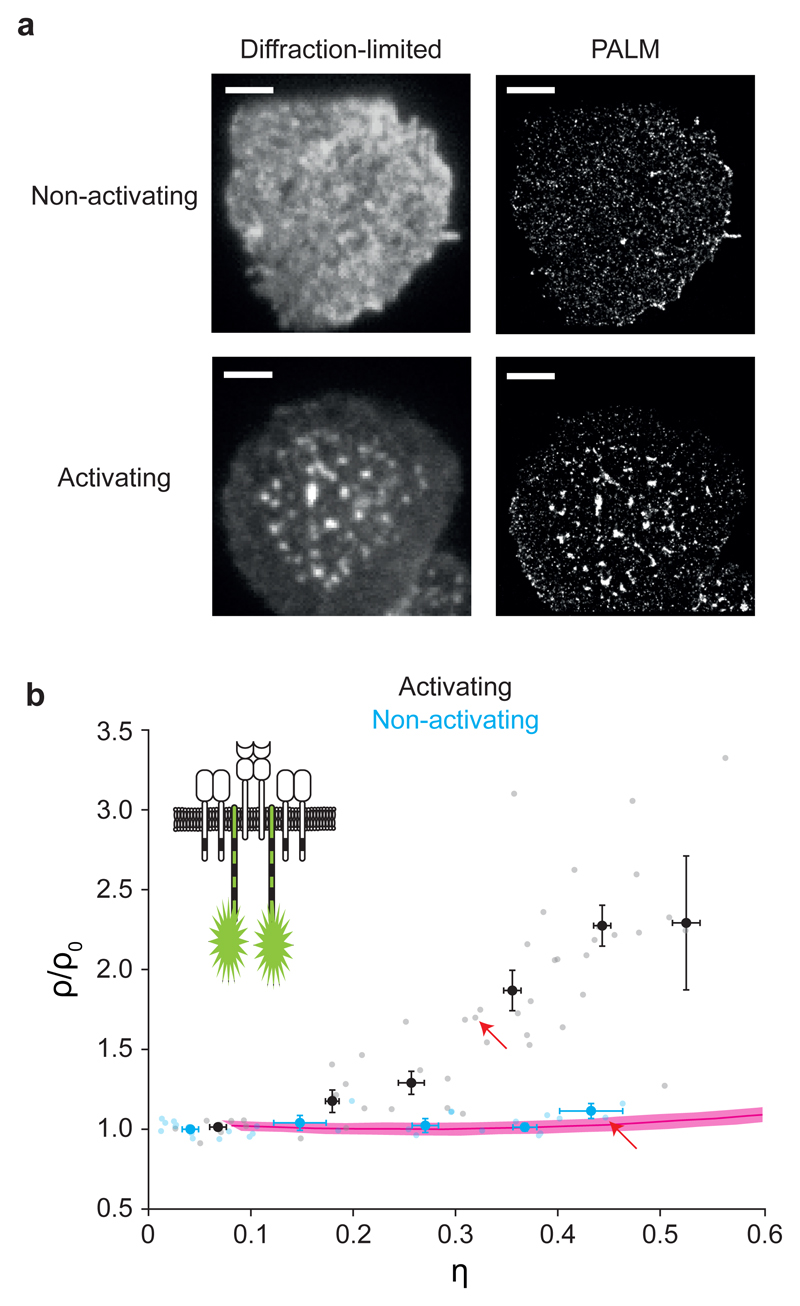
Figure 3
Label-density-variation PALM of CD3u03b6.
( a ) Representative diffraction-limited microscopy images ( left ) and PALM localization maps ( right ) of fixed primary murine CD4 + T EFF cells expressing the fusion construct CD3u03b6-PS-CFP2 and ...
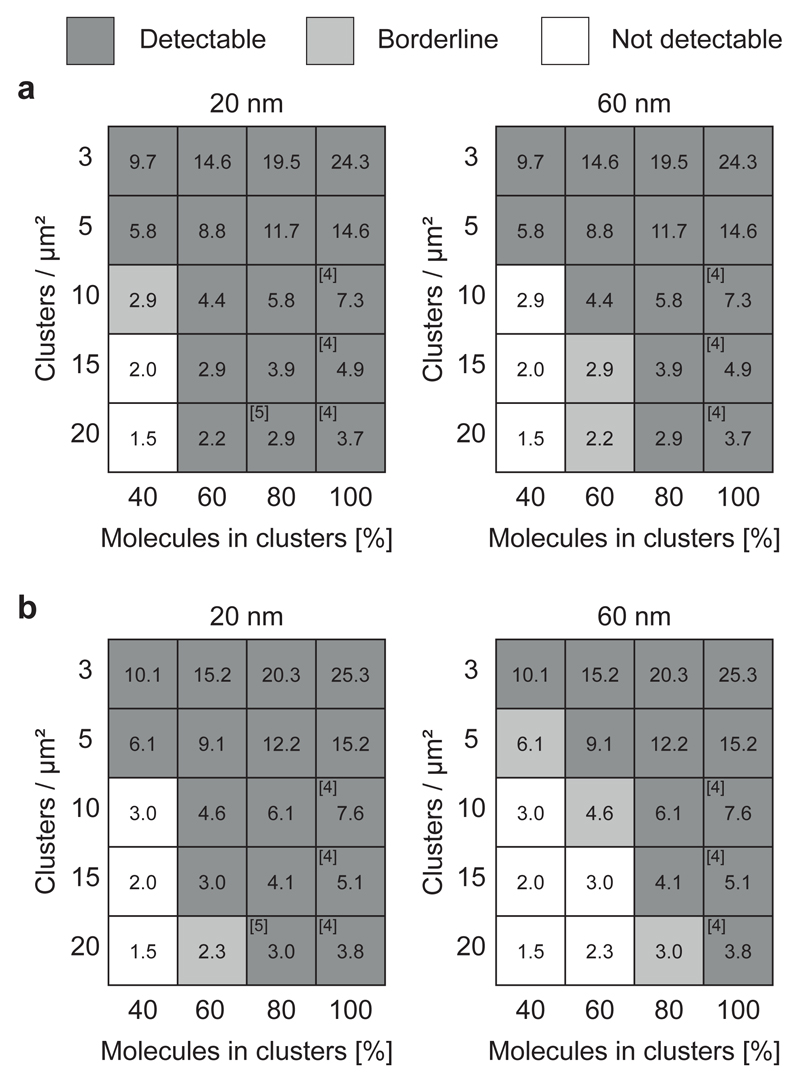
Figure 4
Sensitivity of label-density-variation SMLM to detect nanoclustering.
Normalized u03c1 versus u03b7 plots were calculated for different simulated clustering scenarios and assessed for the difference from simulated random molecular distributions; detectable difference (d...
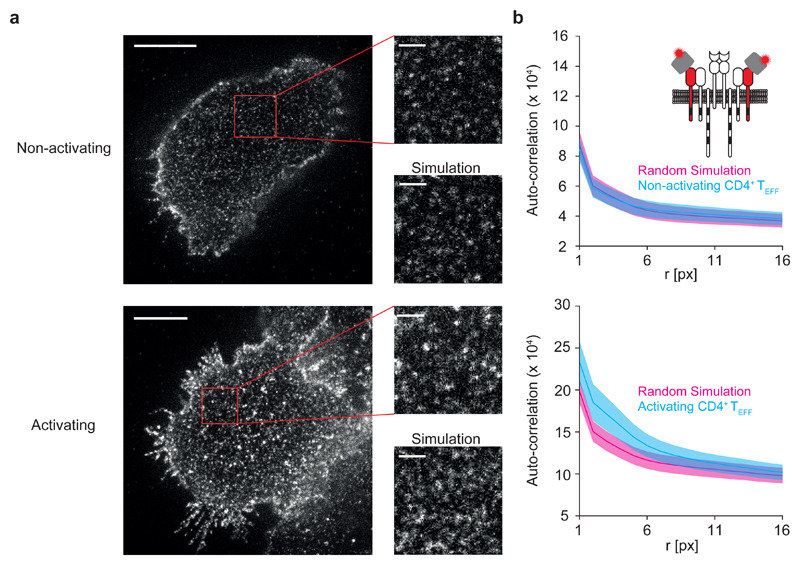
Figure 5
STED microscopy of CD3u03b5 and image autocorrelation analysis.
( a ) Representative STED microscopy images of fixed primary murine CD4 + T EFF cells labeled with KT3-scFv-AS635P during interaction with non-activating ( top ) or activating ( bottom ) supported lip...
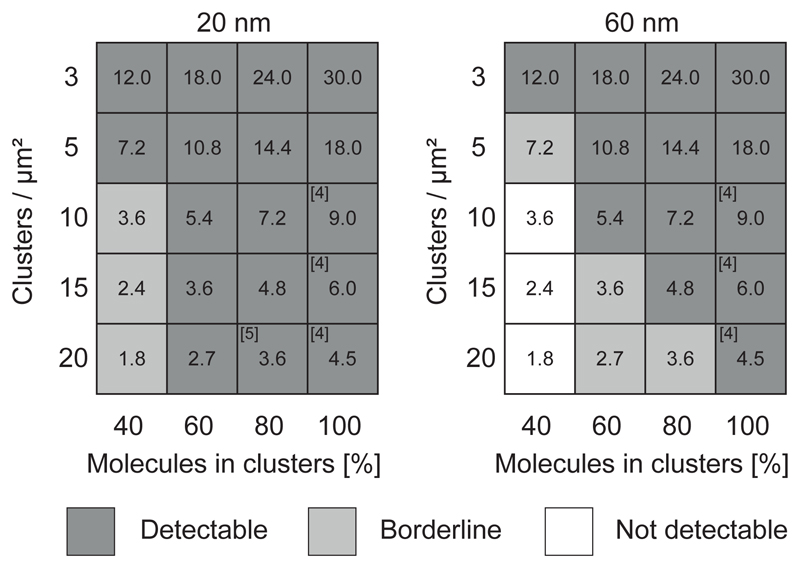
Figure 6
Sensitivity of STED image autocorrelation analysis to detect nanoclustering.
Image autocorrelation analysis was performed for different simulated clustering scenarios and assessed for the difference from simulated random molecular distributions; Detectable difference (dark gra...
Figure images are served from the NIH/NLM PubMed Central Open Access Subset or Europe PMC; copyright remains with the publishers and authors.
💬 Discussion
0 commentsNo comments yet. Be the first to start a discussion!
Leave a Comment