Abstract
Approximately one-third of global CO2 fixation occurs in a phase-separated algal organelle called the pyrenoid. The existing data suggest that the pyrenoid forms by the phase separation of the CO2-fixing enzyme Rubisco with a linker protein; however, the molecular interactions underlying this phase separation remain unknown. Here we present the structural basis of the interactions between Rubisco and its intrinsically disordered linker protein Essential Pyrenoid Component 1 (EPYC1) in the model alga Chlamydomonas reinhardtii. We find that EPYC1 consists of five evenly spaced Rubisco-binding regions that share sequence similarity. Single-particle cryo-electron microscopy of these regions in complex with Rubisco indicates that each Rubisco holoenzyme has eight binding sites for EPYC1, one on each Rubisco small subunit. Interface mutations disrupt binding, phase separation and pyrenoid formation. Cryo-electron tomography supports a model in which EPYC1 and Rubisco form a codependent multivalent network of specific low-affinity bonds, giving the matrix liquid-like properties. Our results advance the structural and functional understanding of the phase separation underlying the pyrenoid, an organelle that plays a fundamental role in the global carbon cycle.
🔬 Techniques
🔭 Microscopes
🧬 Organisms
🧪 Sample Preparation
🏭 Microscope Brands
🧪 Reagent Suppliers
📷 Detectors
💻 Software Details
💾 Data Repositories
🏛️ Research Organizations (ROR)
Affiliated research institutions:
📋 Methods
Strains and culture conditions Chlamydomonas wild-type
(WT) strain cMJ030 was maintained in the dark or low light (~10 μmol photons m −2 s −1 ) on 1.5% agar plates containing Tris-Acetate-Phosphate medium with revised trace elements 33 . For Rubisco extraction, 500 mL Tris-Acetate-Phosphate medium in a 1 L flask was inoculated with a loopful of cells and the culture was grown to 4 × 10 6 cells/mL at 22°C, shaking at 200 rpm under ~100 μmol photons m −2 s −1 white light in 3% CO 2 . Chlamydomonas mutant T60–3 34 (Δ rbcs ; containing a deletion of both RBCS genes) was used for generating Rubisco small subunit point mutants and a wild-type control in the same background. This strain was maintained on agar in the dark or low light (~10 μmol photons m −2 s −1 ).
Protein extraction
Rubisco was purified from Chlamydomonas strain cMJ030 35 . Cells were disrupted by ultrasonication in lysis buffer (10 mM MgCl 2 , 50 mM Bicine, 10 mM NaHCO 3 , 1 mM dithiothreitol, pH 8.0) supplemented with Halt Protease Inhibitor Cocktail, EDTA-Free (Thermo Fisher Scientific). The soluble lysate was fractionated by ultracentrifugation on a 10-30% sucrose gradient in a SW 41 Ti rotor at a speed of 35,000 rpm for 20 hours at 4°C. Rubisco-containing fractions were applied to an anion exchange column (MONO Q 5/50 GL, GE Healthcare) and eluted with a linear salt gradient from 30 to 500 mM NaCl in lysis buffer. Peptide arrays Peptide arrays were purchased from the MIT Biopolymers Laboratory (Cambridge, MA). The tiling array was composed of 18-amino-acid peptides that tiled across the full-length EPYC1 sequence with a step size of one amino acid. Each peptide was represented by at least two spots on the array, and these replicates were averaged during data analysis. The locations of peptides on the array were randomized. In the substitution arrays, peptides were designed to represent every possible one-amino-acid mutation of the indicated region on EPYC1 by substitution with one of the other 19 amino acids. The arrays were activated by methanol, then washed 3×10 min in binding buffer (50 mM HEPES, 50 mM KOAc, 2 mM Mg(OAc) 2 .4H 2 O, 1 mM CaCl 2 and 200 mM sorbitol, pH 6.8). The arrays were then incubated at 4°C with 1 mg purified Rubisco overnight. The arrays were washed in binding buffer to remove any unbound Rubisco. Using a semi-dry transfer apparatus (BIO-RAD), bound Rubisco was transferred onto an Immobilon-P PVDF membrane (Millipore Sigma). The Rubisco was detected by one of two methods: western blotting, or fluorescent labeling. While replicates using the two methods gave similar results, toward the end of the project we found that fluorescent labeling had a lower background, so we show fluorescent labeling data in Figure 1 ; all other data were obtained by western blotting and chemiluminescence. For fluorescent labeling, Rubisco was labeled with Alexa Fluor™ 680 dye (Thermo Fisher Scientific) and detected by Typhoon Scanner (GE Healthcare). For western blotting, Rubisco was immuno-detected with a polyclonal primary antibody raised against Rubisco 15 (1:10,000) followed by a HRP conjugated goat anti-rabbit (1:20,000; Invitrogen), and the chemiluminescence was detected by ImageQuant LAS 4000 (GE Healthcare). Images were analyzed with ImageQuant TL (GE Healthcare). Arrays were stripped with Restore™ Western Blot Stripping Buffer before re-use (Thermo Fisher Scientific). For both types of arrays, values for identical sequences present multiple times were averaged. For tiling arrays, the average value for each sequence was plotted at its position in EPYC1 (or at multiple positions for sequences present multiple times). For amino acid substitution arrays, the ratio of each substitution sequence to the corresponding wildtype sequence was calculated and arrayed by amino acid and position. Surface plasmon resonance (SPR) experiments All the surface preparation experiments were performed at 25°C using a Biacore 3000 instrument (GE Healthcare). Purified Rubisco was immobilized on CM5 sensor chips using a Biacore Amine Coupling Kit according to the manufacturer’s instructions. Briefly, the chip surface was activated by an injection of 1:1 N-hydroxysuccinimide (NHS)/1-ethyl-3-(3-dimethylaminopropyl)carbodiimide hydrochloride (EDC). Rubisco was diluted to ~100 μg/mL in 10 mM acetate (pH 4.5; this pH had been previously optimized using the immobilization pH scouting wizard) and was injected over the chip surface. Excess free amine groups were then capped with an injection of 1 M ethanolamine. Typical immobilization levels were 8,000 to 10,000 resonance units (RU), as recommended for binding experiments of small molecules. For kinetic experiments (for determining the binding affinities), the typical immobilization levels were ~5,000 RU. The control surfaces were prepared in exactly the same manner as the experimental surfaces except that no Rubisco was injected. For immobilizations, the running buffer was the Biacore HBS-EP Buffer (0.01 M HEPES pH 7.4, 0.15 M NaCl, 3 mM EDTA, 0.005% v/v Surfactant P20). All the binding assays were performed using the Biacore PBS-P+ Buffer (20 mM phosphate buffer, 2.7 mM KCl, 137 mM NaCl and 0.05% Surfactant P20, pH 6.8) as a running buffer, as recommended for small molecule analysis in Biacore systems. The analytes, consisting of EPYC1 peptides synthesized by Genscript (Piscataway, New Jersey), were dissolved in the same running buffer and diluted to 1 mM. The analytes were injected over the control surface and experimental surfaces at a flow rate of 26 μL/min for 2.5 minutes, followed by 2.5 minutes of the running buffer alone to allow for dissociation. The surfaces were then regenerated using running buffer at a flow rate of 30 μL/min for 10 minutes. In all cases, binding to the control surface was negligible. For determining the K D of EPYC1 peptide, the kinetic assays were performed with a running buffer consisting of 200 mM sorbitol, 50 mM HEPES, 50 mM KOAc, 2 mM Mg(OAc) 2 •4H 2 O and 1 mM CaCl 2 at pH 6.8 (the same buffer as the peptide array assay). The EPYC1 peptide was dissolved in the same running buffer as the assay and the serial dilutions were also made in the same buffer. The analytes were injected over the control surface and experimental surfaces at a flow rate of 15 μL/min for 2 minutes, followed by 10 minutes with the running buffer alone to allow for dissociation. The surfaces were then regenerated by the running buffer at a flow rate of 30 μL/min for 10 minutes. In all cases, binding to the blank chip was negligible. The fitting and modeling were performed with the BIAevaluation software.
Show full methods section
Strains and culture conditions Chlamydomonas wild-type
(WT) strain cMJ030 was maintained in the dark or low light (~10 μmol photons m −2 s −1 ) on 1.5% agar plates containing Tris-Acetate-Phosphate medium with revised trace elements 33 . For Rubisco extraction, 500 mL Tris-Acetate-Phosphate medium in a 1 L flask was inoculated with a loopful of cells and the culture was grown to 4 × 10 6 cells/mL at 22°C, shaking at 200 rpm under ~100 μmol photons m −2 s −1 white light in 3% CO 2 . Chlamydomonas mutant T60–3 34 (Δ rbcs ; containing a deletion of both RBCS genes) was used for generating Rubisco small subunit point mutants and a wild-type control in the same background. This strain was maintained on agar in the dark or low light (~10 μmol photons m −2 s −1 ).
Protein extraction
Rubisco was purified from Chlamydomonas strain cMJ030 35 . Cells were disrupted by ultrasonication in lysis buffer (10 mM MgCl 2 , 50 mM Bicine, 10 mM NaHCO 3 , 1 mM dithiothreitol, pH 8.0) supplemented with Halt Protease Inhibitor Cocktail, EDTA-Free (Thermo Fisher Scientific). The soluble lysate was fractionated by ultracentrifugation on a 10-30% sucrose gradient in a SW 41 Ti rotor at a speed of 35,000 rpm for 20 hours at 4°C. Rubisco-containing fractions were applied to an anion exchange column (MONO Q 5/50 GL, GE Healthcare) and eluted with a linear salt gradient from 30 to 500 mM NaCl in lysis buffer. Peptide arrays Peptide arrays were purchased from the MIT Biopolymers Laboratory (Cambridge, MA). The tiling array was composed of 18-amino-acid peptides that tiled across the full-length EPYC1 sequence with a step size of one amino acid. Each peptide was represented by at least two spots on the array, and these replicates were averaged during data analysis. The locations of peptides on the array were randomized. In the substitution arrays, peptides were designed to represent every possible one-amino-acid mutation of the indicated region on EPYC1 by substitution with one of the other 19 amino acids. The arrays were activated by methanol, then washed 3×10 min in binding buffer (50 mM HEPES, 50 mM KOAc, 2 mM Mg(OAc) 2 .4H 2 O, 1 mM CaCl 2 and 200 mM sorbitol, pH 6.8). The arrays were then incubated at 4°C with 1 mg purified Rubisco overnight. The arrays were washed in binding buffer to remove any unbound Rubisco. Using a semi-dry transfer apparatus (BIO-RAD), bound Rubisco was transferred onto an Immobilon-P PVDF membrane (Millipore Sigma). The Rubisco was detected by one of two methods: western blotting, or fluorescent labeling. While replicates using the two methods gave similar results, toward the end of the project we found that fluorescent labeling had a lower background, so we show fluorescent labeling data in Figure 1 ; all other data were obtained by western blotting and chemiluminescence. For fluorescent labeling, Rubisco was labeled with Alexa Fluor™ 680 dye (Thermo Fisher Scientific) and detected by Typhoon Scanner (GE Healthcare). For western blotting, Rubisco was immuno-detected with a polyclonal primary antibody raised against Rubisco 15 (1:10,000) followed by a HRP conjugated goat anti-rabbit (1:20,000; Invitrogen), and the chemiluminescence was detected by ImageQuant LAS 4000 (GE Healthcare). Images were analyzed with ImageQuant TL (GE Healthcare). Arrays were stripped with Restore™ Western Blot Stripping Buffer before re-use (Thermo Fisher Scientific). For both types of arrays, values for identical sequences present multiple times were averaged. For tiling arrays, the average value for each sequence was plotted at its position in EPYC1 (or at multiple positions for sequences present multiple times). For amino acid substitution arrays, the ratio of each substitution sequence to the corresponding wildtype sequence was calculated and arrayed by amino acid and position. Surface plasmon resonance (SPR) experiments All the surface preparation experiments were performed at 25°C using a Biacore 3000 instrument (GE Healthcare). Purified Rubisco was immobilized on CM5 sensor chips using a Biacore Amine Coupling Kit according to the manufacturer’s instructions. Briefly, the chip surface was activated by an injection of 1:1 N-hydroxysuccinimide (NHS)/1-ethyl-3-(3-dimethylaminopropyl)carbodiimide hydrochloride (EDC). Rubisco was diluted to ~100 μg/mL in 10 mM acetate (pH 4.5; this pH had been previously optimized using the immobilization pH scouting wizard) and was injected over the chip surface. Excess free amine groups were then capped with an injection of 1 M ethanolamine. Typical immobilization levels were 8,000 to 10,000 resonance units (RU), as recommended for binding experiments of small molecules. For kinetic experiments (for determining the binding affinities), the typical immobilization levels were ~5,000 RU. The control surfaces were prepared in exactly the same manner as the experimental surfaces except that no Rubisco was injected. For immobilizations, the running buffer was the Biacore HBS-EP Buffer (0.01 M HEPES pH 7.4, 0.15 M NaCl, 3 mM EDTA, 0.005% v/v Surfactant P20). All the binding assays were performed using the Biacore PBS-P+ Buffer (20 mM phosphate buffer, 2.7 mM KCl, 137 mM NaCl and 0.05% Surfactant P20, pH 6.8) as a running buffer, as recommended for small molecule analysis in Biacore systems. The analytes, consisting of EPYC1 peptides synthesized by Genscript (Piscataway, New Jersey), were dissolved in the same running buffer and diluted to 1 mM. The analytes were injected over the control surface and experimental surfaces at a flow rate of 26 μL/min for 2.5 minutes, followed by 2.5 minutes of the running buffer alone to allow for dissociation. The surfaces were then regenerated using running buffer at a flow rate of 30 μL/min for 10 minutes. In all cases, binding to the control surface was negligible. For determining the K D of EPYC1 peptide, the kinetic assays were performed with a running buffer consisting of 200 mM sorbitol, 50 mM HEPES, 50 mM KOAc, 2 mM Mg(OAc) 2 •4H 2 O and 1 mM CaCl 2 at pH 6.8 (the same buffer as the peptide array assay). The EPYC1 peptide was dissolved in the same running buffer as the assay and the serial dilutions were also made in the same buffer. The analytes were injected over the control surface and experimental surfaces at a flow rate of 15 μL/min for 2 minutes, followed by 10 minutes with the running buffer alone to allow for dissociation. The surfaces were then regenerated by the running buffer at a flow rate of 30 μL/min for 10 minutes. In all cases, binding to the blank chip was negligible. The fitting and modeling were performed with the BIAevaluation software.
Single-particle cryo-electron microscopy data collection and image processing
Rubisco and EPYC1 49-72 peptides with the final concentrations of 1.69 mg/ml (=3.02 μM) and 7.5 mM, respectively, were incubated together on ice for 20 minutes in buffer consisting of 200 mM sorbitol, 50 mM HEPES, 50 mM KOAc, 2 mM Mg(OAc) 2 •4H 2 O and 1 mM CaCl 2 at pH 6.8 (the same buffer as the peptide array assay and the SPR binding assay). Rubisco and EPYC1 106-135 peptides with the final concentrations of 1.75 mg/ml (=3.13 μM) and 10 mM, respectively, were incubated together on ice for 20 minutes in the same buffer described above. For apo Rubisco and Rubisco incubated with peptides, similar cryo grid-making procedures were used. 400-mesh Quantifoil 1.2/1.3 Cu grids (Quantifoil, Großlöbichau, Germany) were made hydrophilic by glow discharging for 60 seconds with a current of 15 mA in a PELCO easiGlow system. Cryo grids were produced using a FEI Mark IV Vitrobot (FEI company, part of Thermo Fisher Scientific, Hillsboro, OR). The chamber of the Vitrobot was kept at 4°C and 100% relative humidity. 3 μl of sample was applied to the glow-discharged grid and blotted with filter paper for 3 seconds with the equipment-specific blotting force set at 3. After blotting, the grid was rapidly plunge-frozen into a liquid ethane bath. For apo Rubisco and Rubisco incubated with EPYC1 49-72 peptide, cryo grids were loaded into a 300 kV FEI Titan Krios cryo electron microscope (FEI Company) at HHMI Janelia Research Campus, Janelia Krios2, equipped with a Gatan K2 Summit camera. After initial screening and evaluation, fully automated data collection was carried out using SerialEM. The final exposure from each collection target was collected as a movie utilizing dose fractionation on the K2 Summit camera operated in super-resolution mode. The movies were collected at a calibrated magnification of 38,168x, corresponding to 1.31 Å per physical pixel in the image (0.655 Å per super-resolution pixel). The dose rate on the specimen was set to be 5.82 electrons per Å 2 per second and total exposure time was 10 s, resulting in a total dose of 58.2 electrons per Å 2 . With dose fractionation set at 0.2 s per frame, each movie series contained 50 frames and each frame received a dose of 1.16 electrons per Å 2 . The spherical aberration constant of the objective lens is 2.7 mm and an objective aperture of 100 μm was used. The nominal defocus range for the automated data collection was set to be between −1.5 μm and −3.0 μm. For Rubisco incubated with EPYC1 106-135 peptide, the final exposure was collected on Janelia Krios1 equipped with a C S -corrector, a Gatan Bioquantum energy filter and a post-filter K3 camera. The movies were collected at a nominal magnification of 81,000x, corresponding to 0.844 Å per physical pixel in the image (0.422 Å per super-resolution pixel). The dose rate on the specimen was set to be 12 electrons per pixel per second and total exposure time was 3.56 s, resulting in a total dose of 60 electrons per Å 2 . Each movie series contained 60 frames and each frame received a dose of 1 electron per Å 2 . The nominal defocus range for the automated data collection was set to be between −1 μm and −1.6 μm. The movies were 2x binned and motion corrected using MotionCor2 36 and CTF was estimated using CTFFIND 37 in Relion 38 . 1,809,869 EPYC1 49-72 peptide-bound Rubisco particles, 2,257,131 EPYC1 106-135 peptide-bound Rubisco particles, and 677,071 Rubisco particles in the apo state were selected using cisTEM 39 . 2D classification was performed using cisTEM. The classes presenting detailed features in class averages were chosen for 3D classification on cryoSPARC 40 , 41 and on Relion. The 3D class showing clear secondary structures was chosen for 3D auto-refine first without symmetry and then with D4 symmetry imposed. After CTF refinement and Bayesian polishing in Relion, the reconstructed map resolution is 2.68 Å for the apo state, 2.62 Å for the EPYC1 49-72 peptide-bound state, and 2.06 Å for the EPYC1 106-135 peptide-bound state. The EPYC1 49-72 peptide-bound particles at super-resolution pixel size were further subjected to CTF refinement and polishing, resulting in map at 2.13 Å resolution. Details for single-particle cryo-EM data collection and image processing are included in the Supplementary Table 1 . Single-particle cryo-electron microscopy model building, fitting, and refinement A full model for Rubisco from Chlamydomonas was produced from an X-ray structure 13 (PDB entry 1GK8) and used for rigid body fitting into a local resolution filtered apo or EPYC1 49-72 peptide-bound Rubisco cryo-EM map using UCSF Chimera 42 . After rigid body fitting of the full complex, initial flexible fitting was performed in COOT 43 by manually going through the entire peptide chain of a single large and small Rubisco subunit before applying the changes to the other seven large and small subunits. The C-terminal part of the small subunit was built manually and the sequences updated to the RBCS2 sequences. The sequence of the EPYC1 49-72 peptide was used to predict secondary structure elements using JPred4 44 , which gave the prediction that the C-terminal region (NWRQELES) is α-helical. Guided by this prediction, the peptide was built manually into the density using COOT. Additional maps like the initial 2.62 Å from the binned data and maps filtered to different resolutions with various applied B-factors were also used to help with model building in unclear regions. Additional real space refinement of the entire complex was performed using Phenix 45 . The EPYC1 106-135 peptide bound map was used to build a model of the EPYC1 106-135 peptide. First rigid body fitting of the EPYC1 49-72 peptide-bound Rubisco model into a local resolution filtered EPYC1 106-135 peptide-bound Rubisco cryo-EM map was performed using UCSF Chimera. Then the sequence of the peptide was mutated to the EPYC1 106-135 peptide sequence, followed by flexible fitting to slightly adjust the PDB to the density. Models were subjected to an all-atom structure validation using MolProbity 46 . Figures were produced using UCSF Chimera.
Liquid–liquid phase separation assay
Proteins used in the liquid–liquid phase separation assay were obtained and stored essentially as described previously 11 . Briefly, Rubisco was purified from Chlamydomonas reinhardtii cells (CC-2677 cw15 nit1–305 mt-5D, Chlamydomonas Resource Center), grown in Sueoka’s high-salt medium 47 , using a combination of anion exchange chromatography and gel filtration. The EPYC1 full-length gene (encoding amino acids 1-317) and corresponding R/K mutant (EPYC1 R64A/K127A/K187A/K248A/R314A ) were synthesized by GenScript and cloned between the SacII and HindIII site of the pHue vector 48 . Proteins were produced in the E. coli strain BL21 (DE3) harbouring pBADESL 49 for co-expression of the E. coli chaperonin GroEL/S. The purification was conducted with minor changes (dialysis for removal of high immidazol concentrations was skipped by running the gel-filtration column before the second IMAC). After the first IMAC step and cleavage 50 of the N-terminal His 6 –ubiquitin tag, proteins were separated by gel filtration. Finally, the peak fraction was passed a second time through an IMAC column, collecting EPYC1 from the flow through. EPYC1-Rubisco condensates were reconstituted in vitro in a buffer containing 20 mM Tris-HCl (pH 8.0) and NaCl concentrations as indicated. 5 μl reactions were incubated for 3 minutes at room temperature before monitoring the droplet formation by differential interference contrast (DIC) microscopy. DIC images were acquired with a Nikon Eclipse Ti Inverted Microscope using a 60× oil-immersion objective after allowing the droplets to settle on the coverslip (Superior Marienfeld, Germany) surface for about 3 minutes. For droplet sedimentation assays 10 μl reactions were incubated for 3 minutes at 20°C before separating the droplets form the bulk phase by spinning for 3 minutes at 21,000xg and 4°C. Pelleted droplets and supernatant fractions were analyzed using Coomassie-stained SDS-PAGE.
Yeast two-hybrid assay
Yeast two-hybrid to detect interactions between
EPYC1 and RbcS1 was carried out as described previously 12 . EPYC1 was cloned into the two-hybrid vector pGBKT7 to create a fusion with the GAL4 DNA binding domain. Point mutations were introduced by PCR into RbcS1, which was then cloned in the pGADT7 to create a fusion with the GAL4 activation domain. Yeast cells were then co-transformed with binding and activation domain vectors. Successful transformants were cultured, diluted to an optical density at 600 nm (OD600) of 0.5 or 0.1, and plated onto SD-L-W and SD-L-W-H containing increasing concentrations of the HIS3 inhibitor triaminotriazole (3-AT). Plates were imaged after 3 days. Spots shown in Fig. 5a were grown at 5 mM 3-AT from a starting OD600 of 0.5; they are a subset of the full dataset shown in Extended Data Fig. 6 . Cloning of Rubisco small subunit point mutants The plasmid pSS1-ITP 51 which contains Chlamydomonas RBCS1 including UTRs and introns 1 and 2 was used as a starting point for generating plasmids pSH001 and pSH002, which encode RBCS1 D23A/E24A , and RBCS1 M87D/V94D , respectively. The point mutations were generated by Gibson assembly 52 of gBlocks (synthesized by Integrated DNA Technologies) containing the desired mutations into pSS-ITP that had been enzyme digested by restriction endonucleases (XcmI and BbvCI for the D23A/E24A mutations and BbvCI and BlpI for the M87D/V94D mutations). All constructs were verified by Sanger sequencing. The fragment for making pSH001 (containing the D23A/E24A Rubisco small subunit mutant) had the following sequence: GCAGGGCTGCCCCGGCTCAGGCCAACCAGATGATGGTCTGGACCCCGGTCAACAACAAGATGTTCGAGACCTTCTCCTACCTGCCTCCTCTGACCGCCGCGCAGATCGCCGCCCAGGTCGACTACATCGTCGCCAACGGCTGGATCCCCTGCCTGGAGTTCGCTGAGGCCGACAAGGCCTACGTGTCCAAC The fragment for making pSH002 (containing the M87D/V94D Rubisco small subunit mutant) had the following sequence: CTGCCTGGAGTTCGCTGAGGCCGACAAGGCCTACGTGTCCAACGAGTCGGCCATCCGCTTCGGCAGCGTGTCTTGCCTGTACTACGACAACCGCTACTGGACCATGTGGAAGCTGCCCATGTTCGGCTGCCGCGACCCCGACCAGGTGCTGCGCGAGATCGACGCCTGCACCAAGGCCTTCCCCGATGCCTACGTGCGCCTGGTGGCCTTCGACAACCAGAAGCAGGTGCAGATCATGGGCTTCCTGGTCCAGCGCCCCAAGACTGCCCGCGACTTCCAGCCCGCCAACAAGCGCTCCGTGTAAATGGAGGCGCTCGTCGATCTGAGCCGTGTGTGATGTTTGTTGGTGTTTGAGCGAGTGCAATGAGAGTGTGTGTGTGTGTGTTGTTGGTGTGTGGCTAAGCCAAGCGTGATCGC Both the plasmids pSH001 and pSH002 have been submitted to the Chlamydomonas Resource Center ( www.chlamycollection.org ). Transformation of Chlamydomonas to make the Rubisco small subunit point mutants Chlamydomonas strains Δrbcs ; RBCS WT , Δrbcs ; RBCS D23A/E24A , and Δrbcs ; RBCS M87D/V94D (The accession numbers of these strains in Chlamydomonas Resource Center are CC-5616, CC-5617 and CC-5618, respectively.) were generated by transforming pSS1-ITP, pSH001, and pSH002 (encoding Rubisco small subunit constructs) into the Rubisco small subunit deletion mutant T60 ( Δrbcs ) by electroporation as described previously 53 . For each transformation, 29 ng kbp −1 of KpnI linearized plasmid was mixed with 250 μL of 2 x 10 8 cells mL −1 at 16°C and electroporated immediately. Transformant colonies were selected on Tris-Phosphate plates without antibiotics at 3% v/v CO 2 under ~50 μmol photons m −2 s −1 light. The sequence of RbcS in the transformants was verified by PCR amplification and Sanger sequencing. Spot tests Δrbcs ; RBCS WT , Δrbcs ; RBCS D23A/E24A , and Δrbcs ; RBCS M87D/V94D (The accession numbers of these strains in Chlamydomonas Resource Center are CC-5616, CC-5617 and CC-5618, respectively.) were grown in Tris-Phosphate medium at 3% CO 2 until ~2x10 6 cells mL −1 . Cells were diluted in Tris-Phosphate medium to a concentration of 8.7 ×10 7 cells mL −1 , then serially diluted 1:10 three times. 7.5 μL of each dilution was spotted onto four TP plates and incubated in air or 3% CO 2 under 20 or 100 μmol photons m −2 s −1 white light for 9 days before imaging.
Transmission electron microscopy
Samples for electron microscopy were fixed for 1 hour at room temperature in 2.5% glutaraldehyde in Tris-Phosphate medium (pH 7.4), followed by 1 hour at room temperature in 1% OsO 4 , 1.5% K 3 Fe(CN) 3 , and 2 mM CaCl 2 . Fixed cells were then bulk stained for 1 hour in 2% uranyl acetate, 0.05 M maleate buffer at pH 5.5. After serial dehydration (50%, 75%, 95%, and 100% ethanol, followed by 100% acetonitrile), samples were embedded in epoxy resin containing 34% Quetol 651, 44% nonenyl succinic anhydride, 20% methyl-5- norbornene-2,3-dicarboxylic anhydride, and 2% catalyst dimethylbenzylamine. Ultramicrotomy was done by the Core Imaging Lab, Medical School, Rutgers University. Imaging was performed at the Imaging and Analysis Center, Princeton University, on a CM100 transmission electron microscope (Philips, Netherlands) at 80 kV.
Measurement of nearest-neighbor distances between
EPYC1 binding sites on Rubisco holoenzymes within pyrenoids For detailed descriptions of the Chlamydomonas cell culture, vitrification of cells onto EM grids, thinning of cells by cryo-focused ion beam milling, 3D imaging of native pyrenoids by cryo-electron tomography, tomographic reconstruction, template matching, and subtomogram averaging, see our previous study 5 . In that study, we measured the distances between the center positions of Rubisco complexes within tomograms of five pyrenoids. The spatial parameters determined in that study were combined with the EPYC1-binding sites resolved here by cryo-EM single-particle analysis to measure the nearest-neighbor distances between EPCY1 binding sites on adjacent Rubisco complexes within the native pyrenoid matrix. The in situ subtomogram average EMD-3694 5 was used as the reference for the Rubisco model. We extracted the isosurface from this density using the 0.5 contour level recommended in the Electron Microscopy Data Bank entry. We then fit the atomic model of EPYC1-bound Rubisco ( Fig. 2 ) within the EMD-3694 density, and for each EPYC1 binding site, we marked the closest point on the isosurface to define the EPYC1 binding sites on this model. The positions and orientations previously determined by subtomogram averaging were used to place each Rubisco model and its corresponding binding sites into the pyrenoid tomograms using the PySeg program 54 . To compute the nearest-neighbor distances between EPYC1 binding sites on two different Rubisco complexes, first, linkers were drawn between each EPYC1 binding site and all other binding sites within 25 nm. Binding sites on the same Rubisco complex were ignored. Next, the linkers were filtered by length (defined as the Euclidean distance between the two binding sites), and only the shortest linker was retained for each binding site. To prevent edge effects, linkers were discarded if they had a binding site
📊 Figures
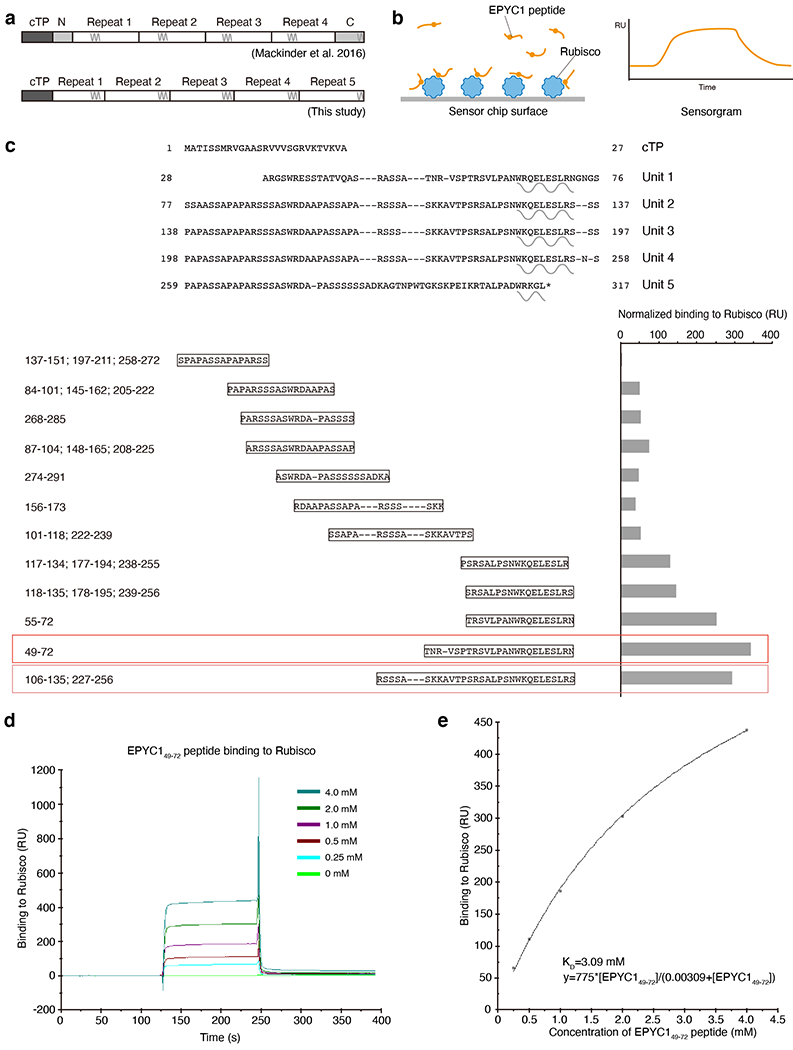
Extended Data Fig. 1
The EPYC1 peptides with the highest binding affinities to Rubisco were chosen for structural studies.
a, Diagram indicating the differences between the previously defined sequence repeats 10 and the newly defined sequence repeats on full-length EPYC1. b, To verify the Rubisco-binding regions on EPYC1,...
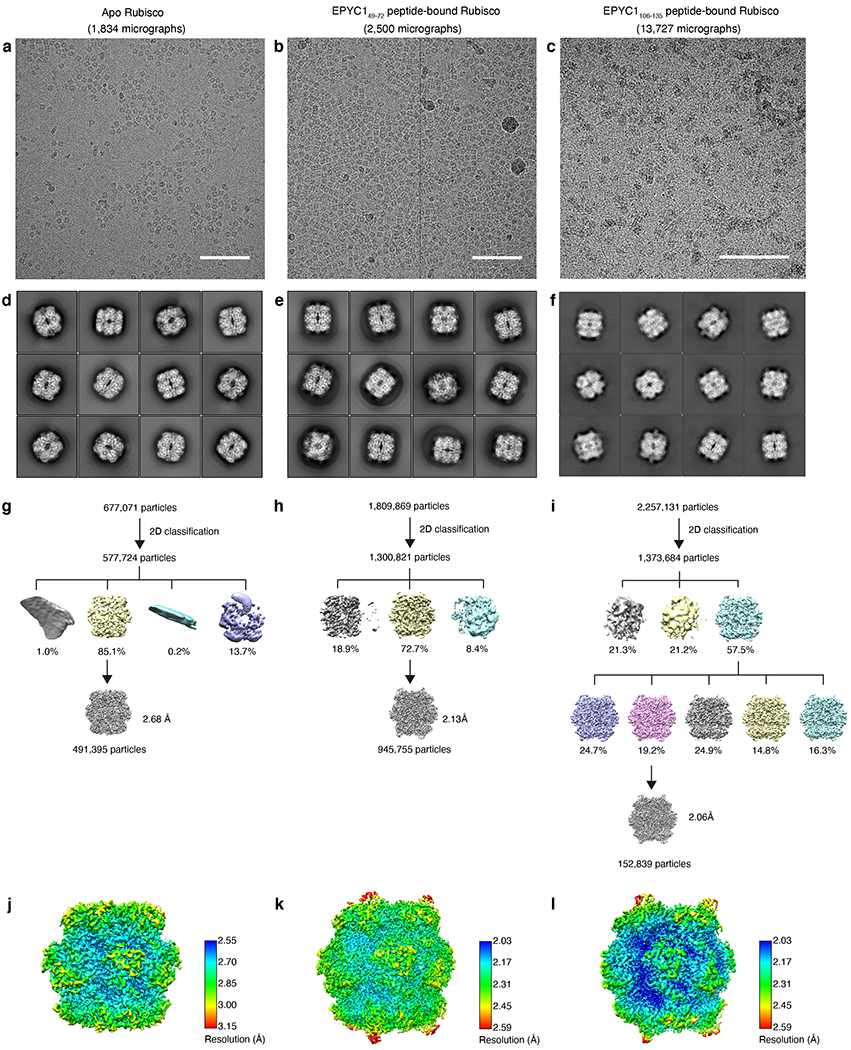
Extended Data Fig. 2
Single-particle cryo-EM data collection and image processing procedure.
a-c, Representative micrographs of the apo Rubisco sample (a), the Rubisco-EPYC1 49-72 complex (b) and the Rubisco-EPYC1 106-135 complex (c). Scale bars = 100 nm. d-f, Representative 2D class averages...
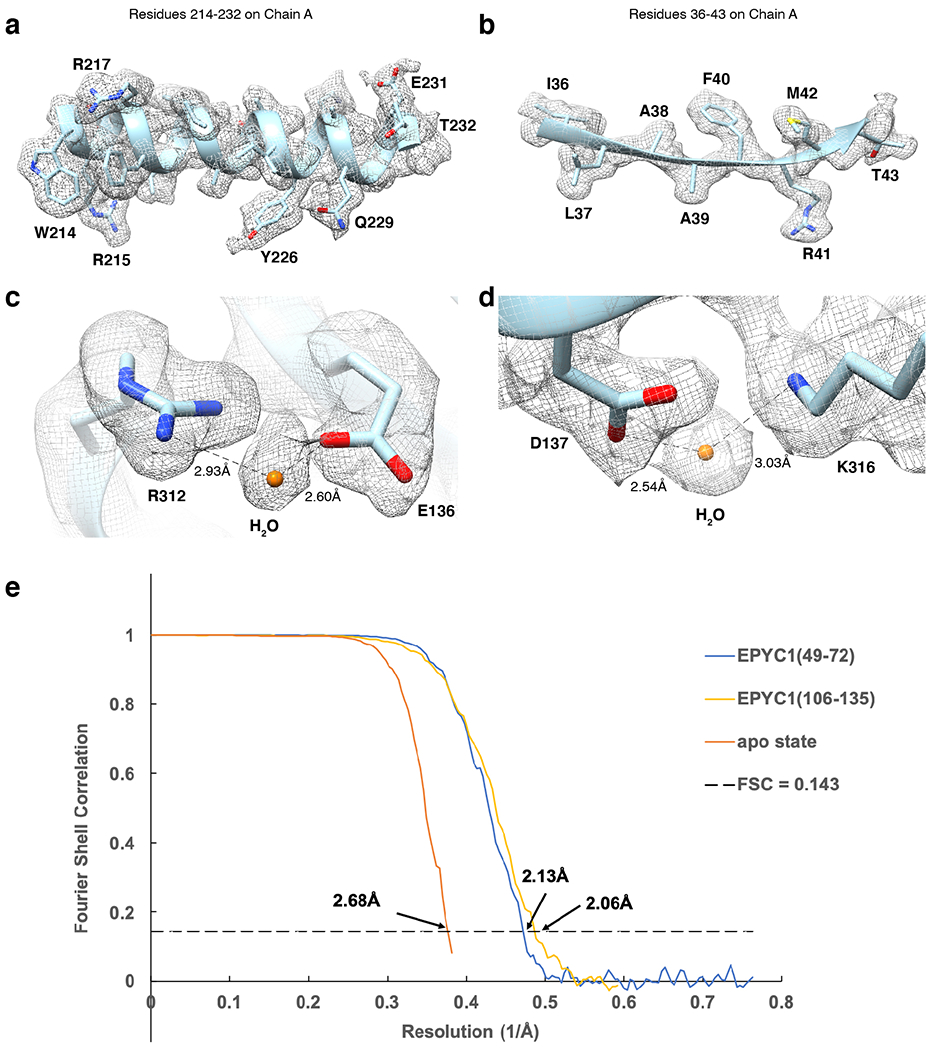
Extended Data Fig. 3
Cryo-EM analysis and resolution of apo Rubisco and Rubisco-EPYC1 peptide complexes in this study.
a-b, Representative cryo-EM density quality showing an u03b1-helix of residues 214-232 in chain A (one of the Rubisco large subunits) (a) and a u03b2-sheet of residues 36-43 in chain A (b) of the Rubi...
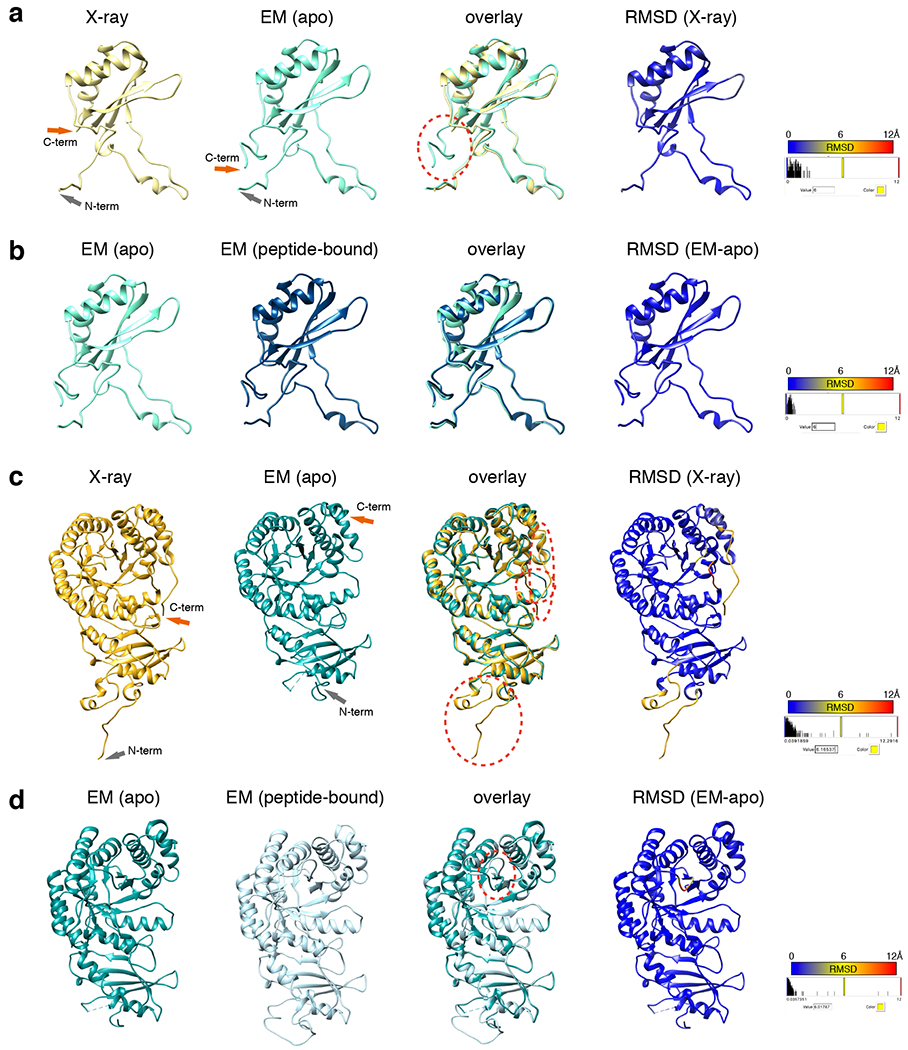
Extended Data Fig. 4
Comparison of our EM structure of apo Rubisco and the published X-ray crystallography structure (1gk8) of Rubisco purified from Chlamydomonas reinhardtii 13 , and comparison of our EM structure of apo Rubisco and Rubisco bound with EPYC1 49-72 peptide.
a, Comparison of the structure of the small subunit of apo Rubisco obtained here by EM with 1gk8. The EM structure has additional C-terminus density past residue 126, circled by a red dashed line. b, ...
Extended Data Fig. 5
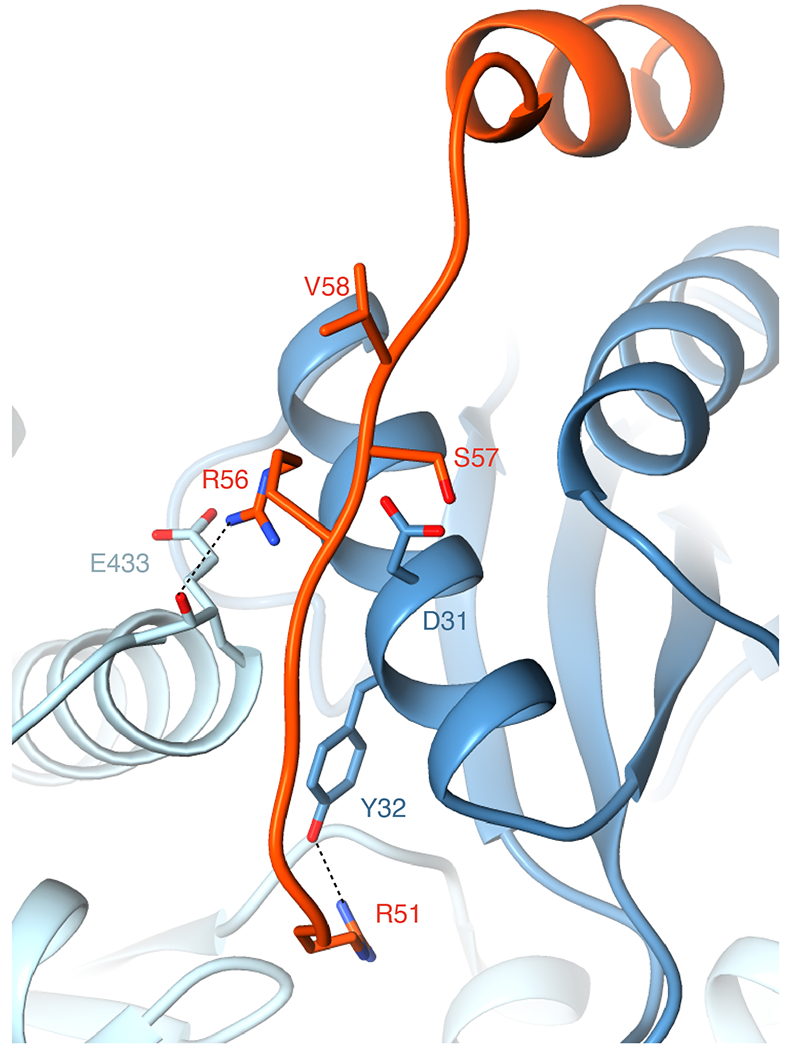
Additional residues may contribute to the interaction between EPYC1 and Rubisco.
Our Rubisco-EPYC1 49-72 peptide structure suggests that R56 of the EPYC1 49-72 peptide may interact with D31 of the Rubisco small subunit and E433 of the Rubisco large subunit (the atoms of the backbo...
Extended Data Fig. 6
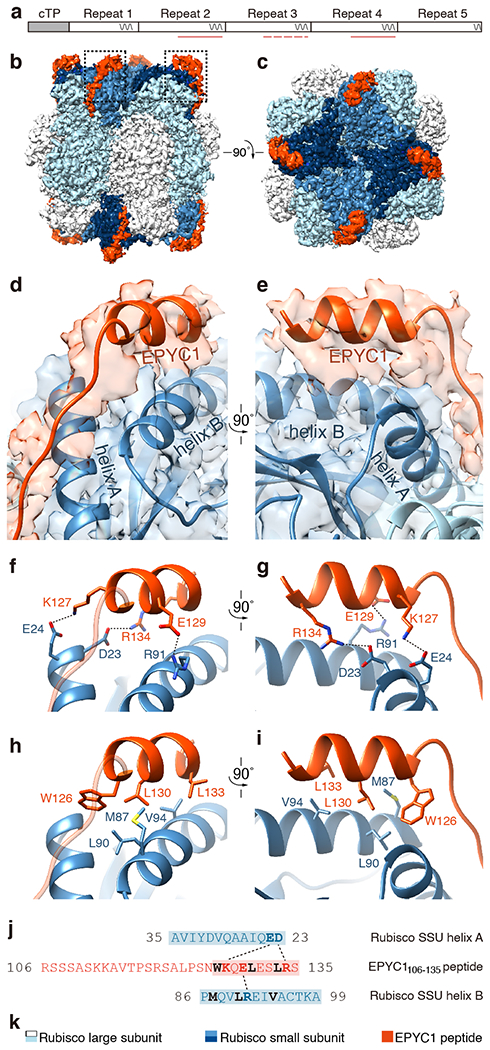
The EPYC1 106-135 peptide binds to Rubisco small subunit u03b1-helices via salt bridges and a hydrophobic pocket in a similar manner to the EPYC1 49-72 peptide.
a, The EPYC1 106-135 peptide represents the second, third and fourth Rubisco-binding regions of EPYC1 indicated by pink lines and dash line (the peptide is a perfect match to the second and fourth Rub...
Extended Data Fig. 7
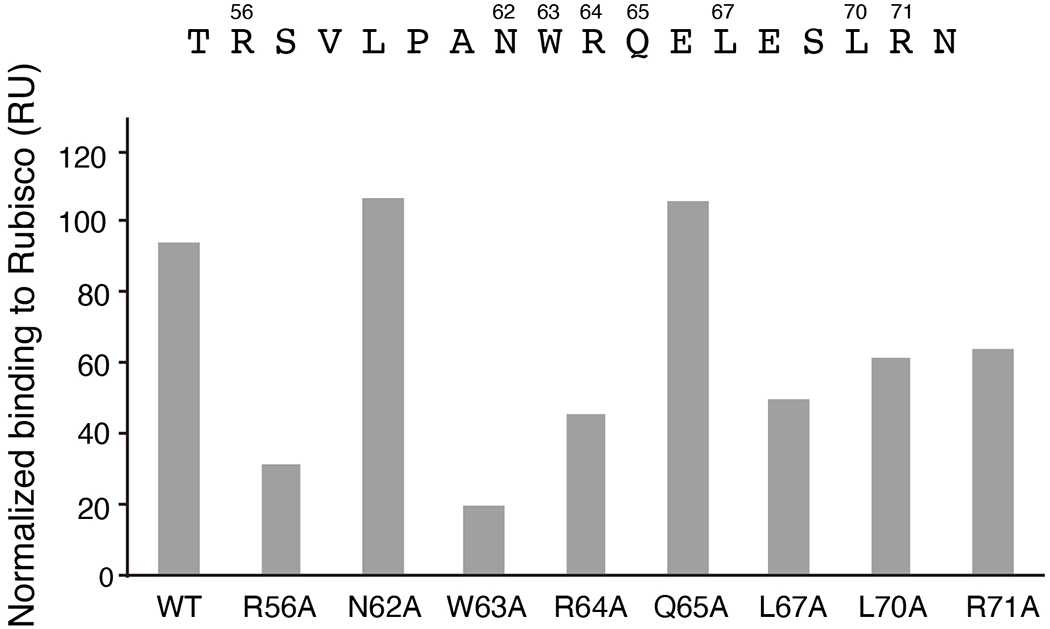
Surface plasmon resonance analysis of binding of point mutants of EPYC1 55-72 to Rubisco.
The wild-type (WT) peptide or peptides with the indicated mutations were synthesized, and their Rubisco-binding signal was measured by surface plasmon resonance.
Extended Data Fig. 8
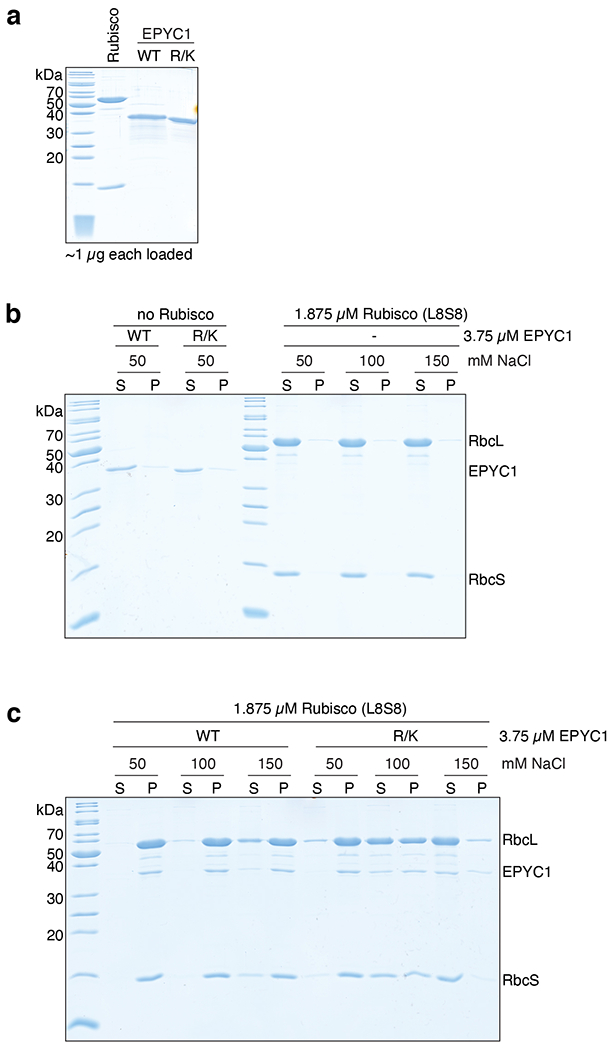
Interface residues on EPYC1 identified by cryo-EM are important for binding and phase separation of EPYC1 and Rubisco.
a, SDS-PAGE analysis of purified proteins used for in vitro phase separation experiments. WT = wild-type EPYC1; R/K = EPYC1 R64A/K127A/K187A/K248A/R314 . b-c, A droplet sedimentation assay was used as...
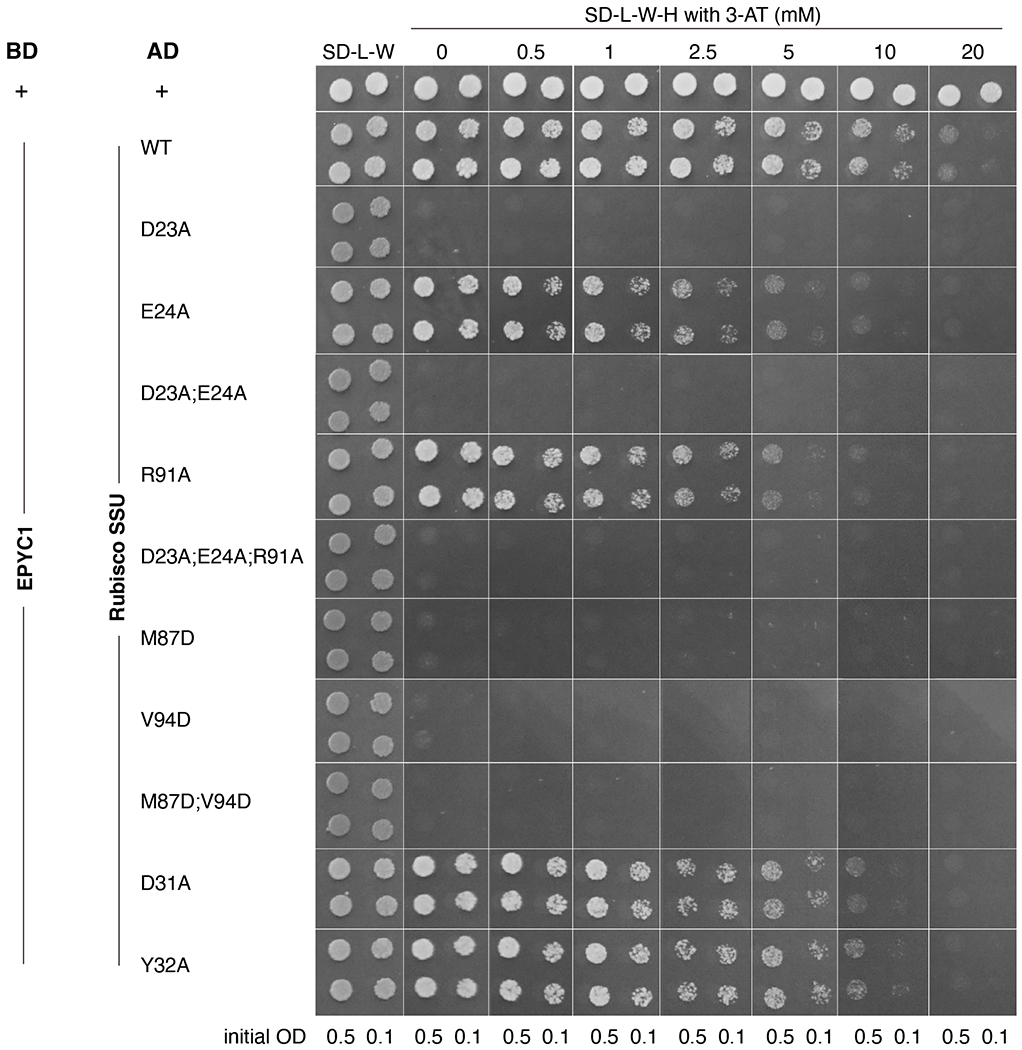
Extended Data Fig. 9
Yeast two-hybrid assays of interactions between EPYC1 and wild-type or mutated Rubisco small subunit.
Colonies are shown after 3 days growth on plates. A subset of the data shown in this figure is shown in Fig. 5a .
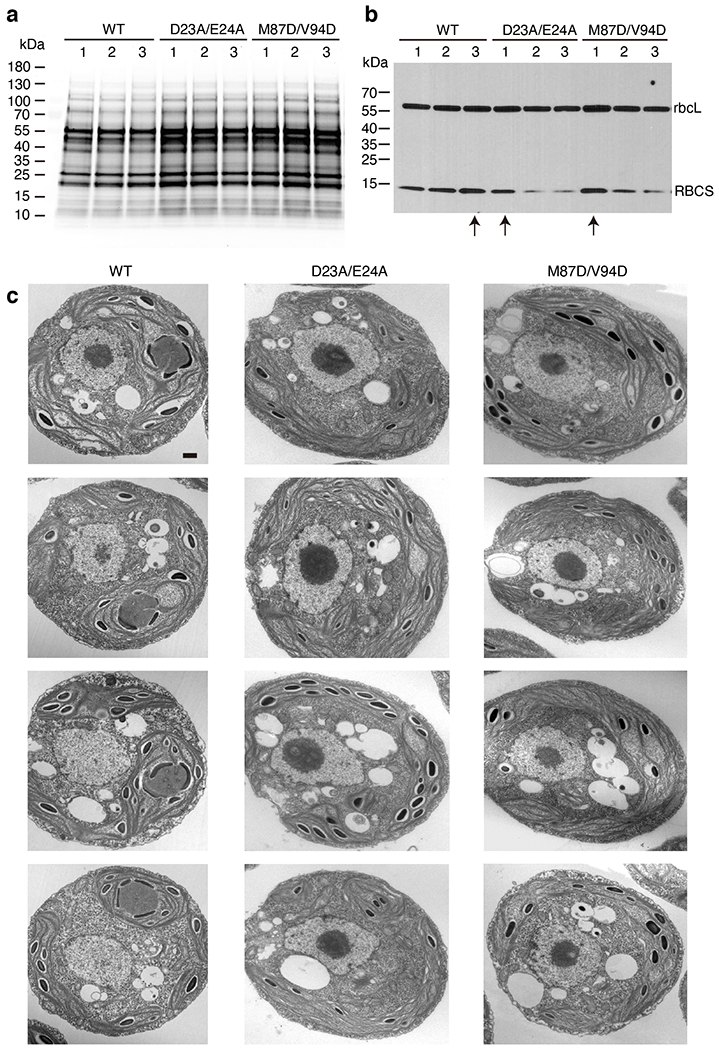
Extended Data Fig. 10
Selection of the Rubisco small subunit mutant strains for phenotype analysis.
a, The Rubisco small subunit-less mutant T60 ( u0394rbcs ) was transformed with DNA encoding wild-type and mutant Rubisco small subunits (RBCS) to produce candidate transformants with the genotypes u0...
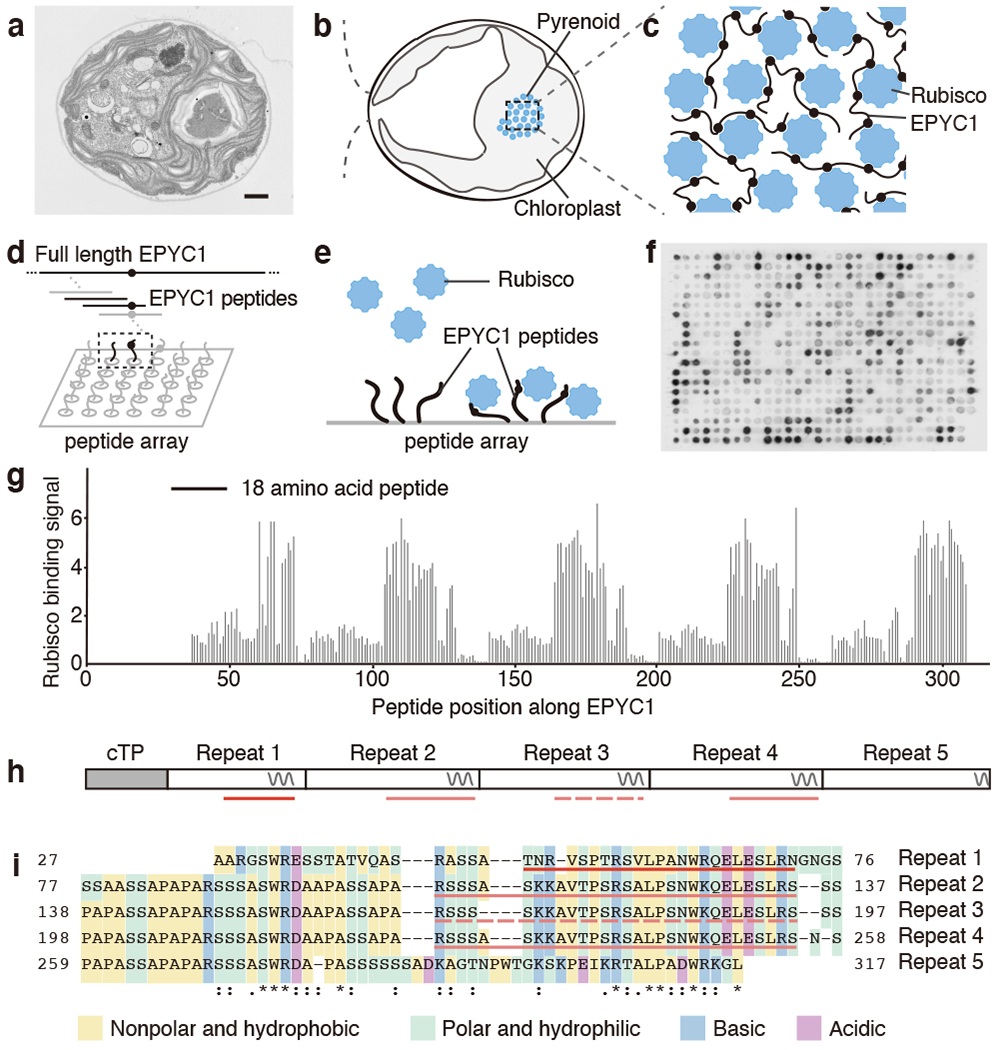
Fig. 1 |
EPYC1 consists of five tandem sequence repeats, each of which contains a Rubisco-binding region.
a , A representative (N=15) transmission electron microscopy (TEM) image of a Chlamydomonas cell. Scale bar = 1 u03bcm. b , Cartoon depicting the chloroplast and pyrenoid in the image shown in panel a...
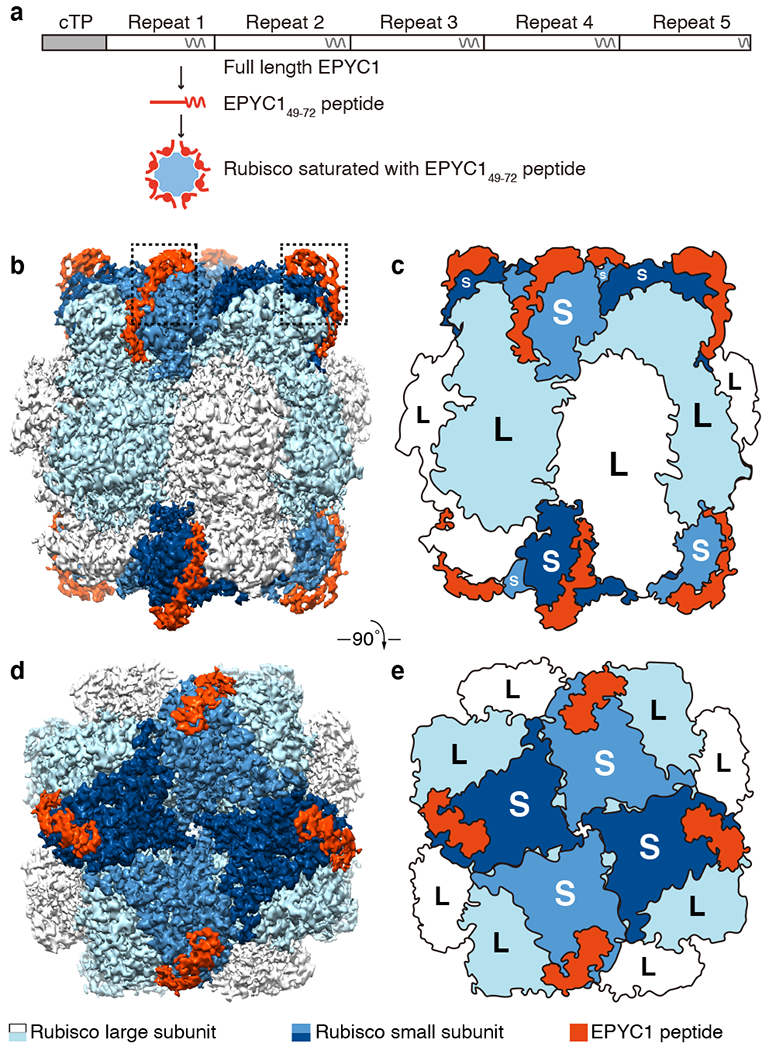
Fig. 2 |
EPYC1 binds to Rubisco small subunits.
a , Peptide EPYC1 49-72 , corresponding to the first Rubisco-binding region of EPYC1, was incubated at saturating concentrations with Rubisco prior to single-particle cryo-electron microscopy. b - e ,...
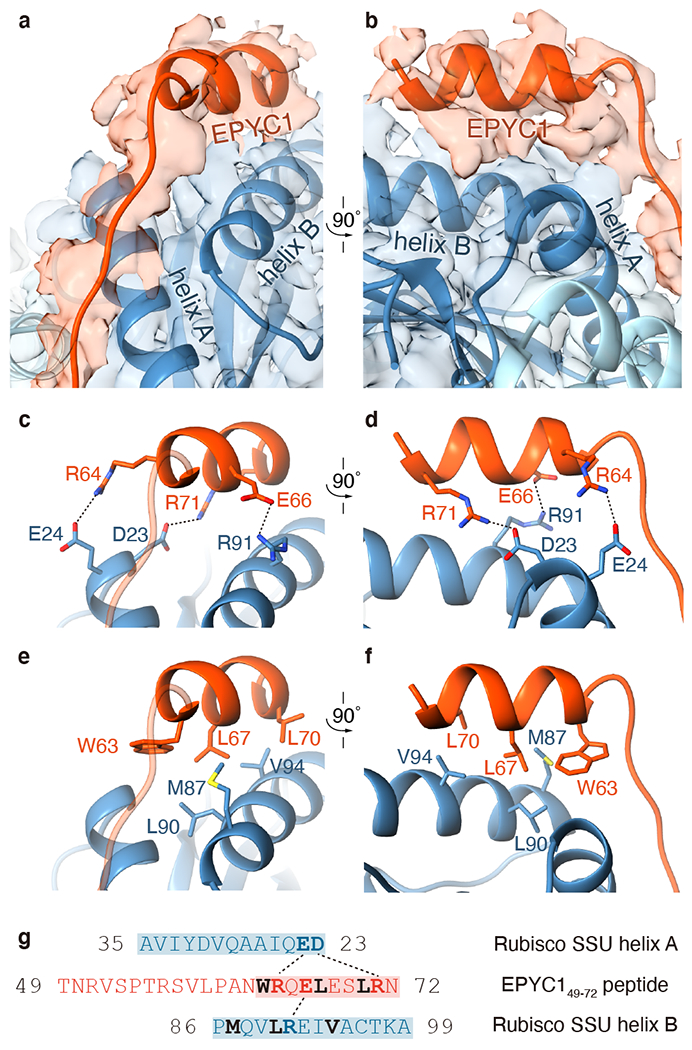
Fig. 3 |
EPYC1 binds to Rubisco small subunit u03b1-helices via salt bridges and a hydrophobic pocket.
a - b , Front (a) and side (b) views of the EPYC1 49-72 peptide (red) bound to the two u03b1-helices of the Rubisco small subunit (blue). c - d , Three pairs of residues form salt bridges between the ...
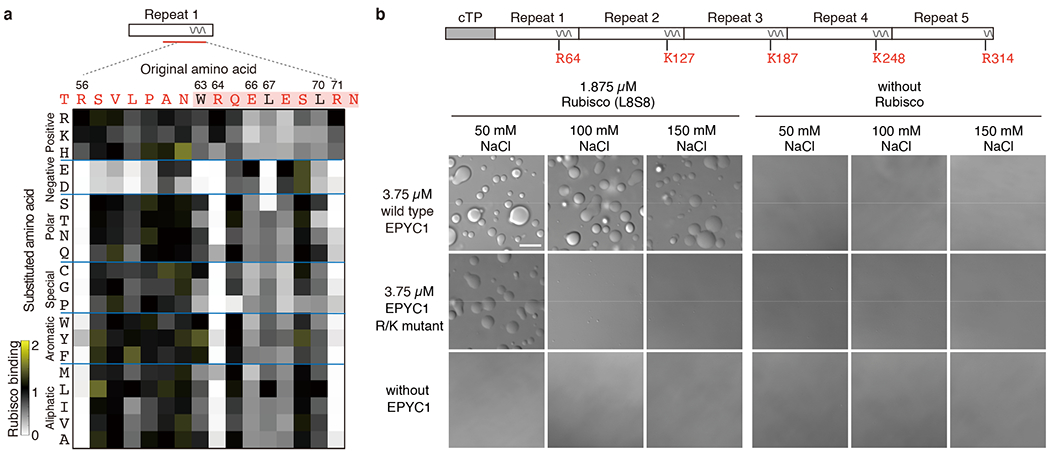
Fig. 4 |
Interface residues on EPYC1 are required for binding and phase separation of EPYC1 and Rubisco in vitro.
a , Rubisco binding to a peptide array representing every possible single amino acid substitution for amino acids 56-71 of EPYC1. The binding signal was normalized by the binding signal of the origina...
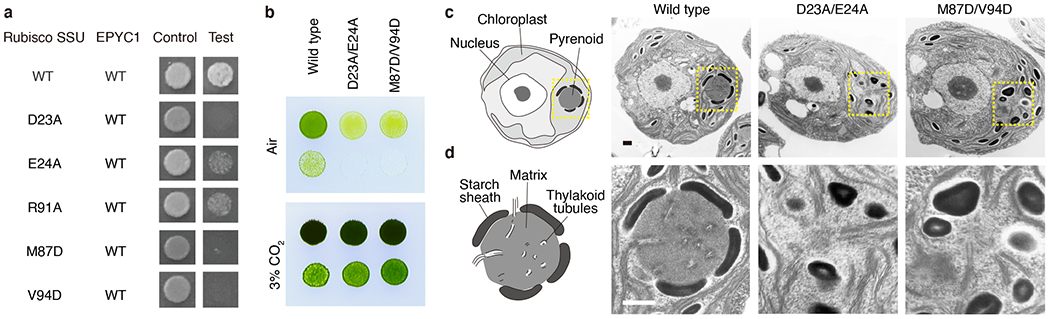
Fig. 5 |
Interface residues on Rubisco are required for yeast two-hybrid interactions between EPYC1 and Rubisco, and for pyrenoid matrix formation in vivo .
a , The importance of Rubisco small subunit residues for interaction with EPYC1 was tested by mutagenesis in a yeast two-hybrid experiment. b , The Rubisco small subunit-less mutant T60 ( u0394rbcs ) ...
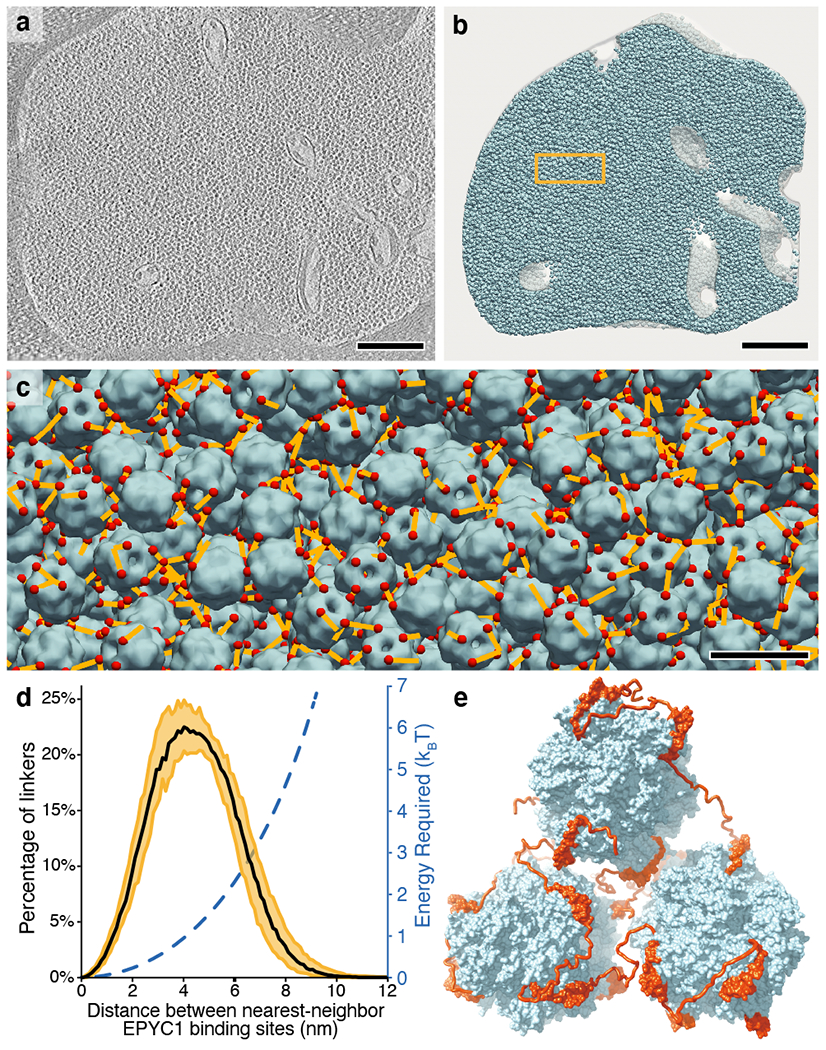
Fig. 6 |
A model for matrix structure consistent with in situ Rubisco positions and orientations.
a , The pyrenoid matrix was imaged by cryo-electron tomography 5 . An individual slice through the three-dimensional volume is shown. Scale bar = 200 nm. b , The positions and orientations of individu...
Figure images are served from the NIH/NLM PubMed Central Open Access Subset or Europe PMC; copyright remains with the publishers and authors.
💬 Discussion
0 commentsNo comments yet. Be the first to start a discussion!
Leave a Comment